35% of Older Philadelphians Live Below or Near the Poverty Line
Amid financial pressures, more Philadelphians age 65 or older are working now than a decade ago

Overview
Philadelphia has the highest poverty rate among the nation’s 10 largest cities and one of the highest rates among big cities in general, with about 1 in 5 residents living in poverty—a pattern that applies to older Philadelphians as well.1 Over the past decade, as residents ages 65 and older have felt the pressures of poverty, their labor force participation rate has increased noticeably in Philadelphia and throughout the nation.

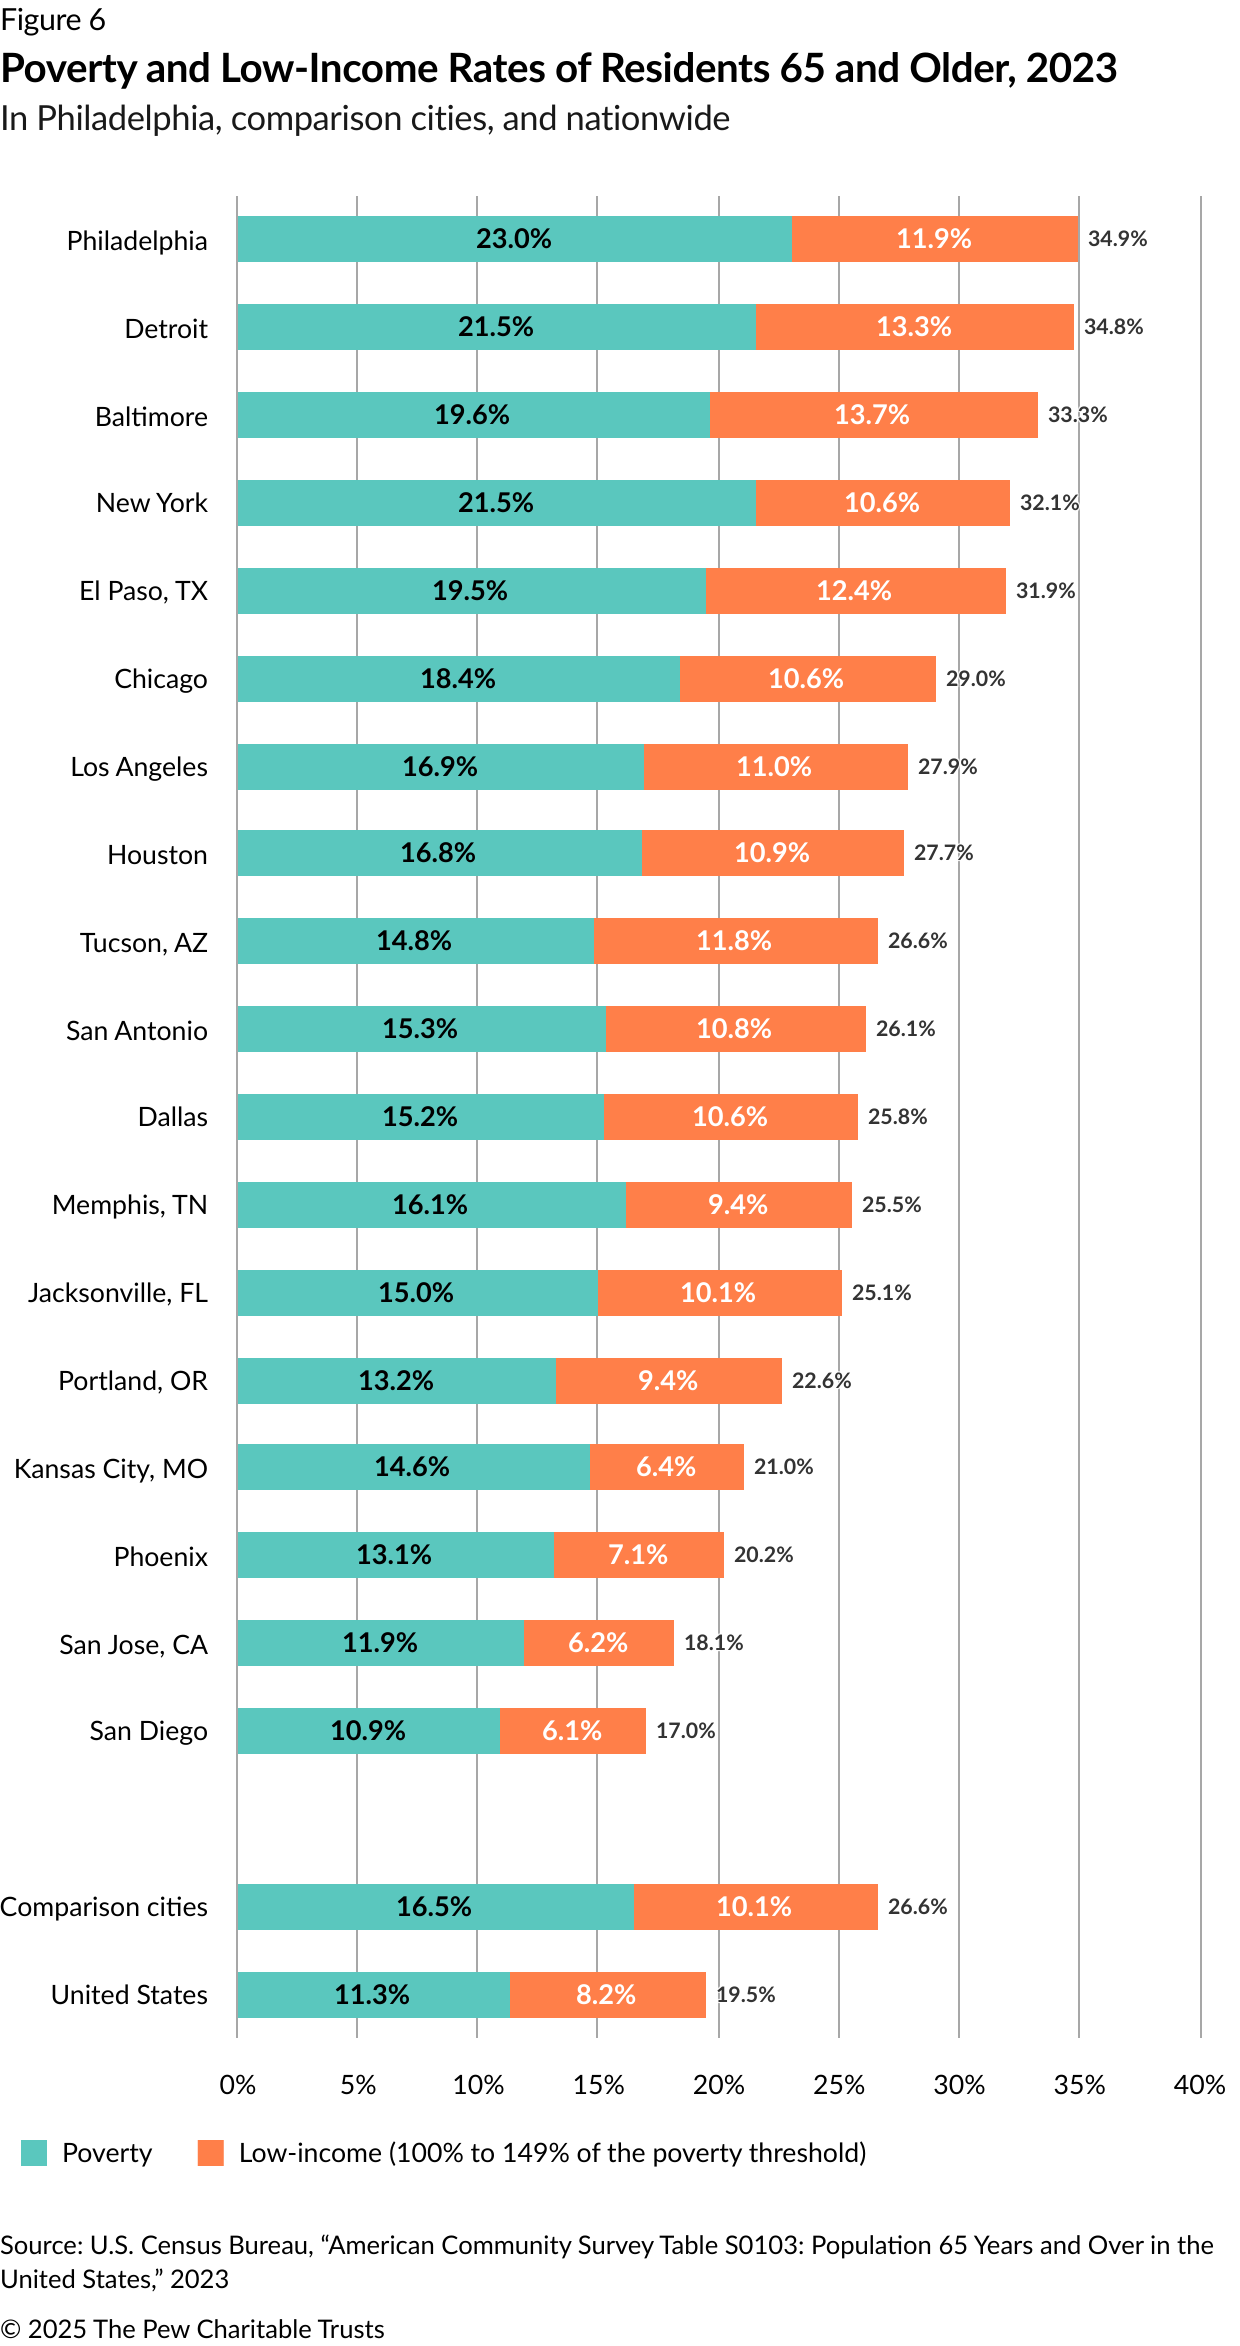
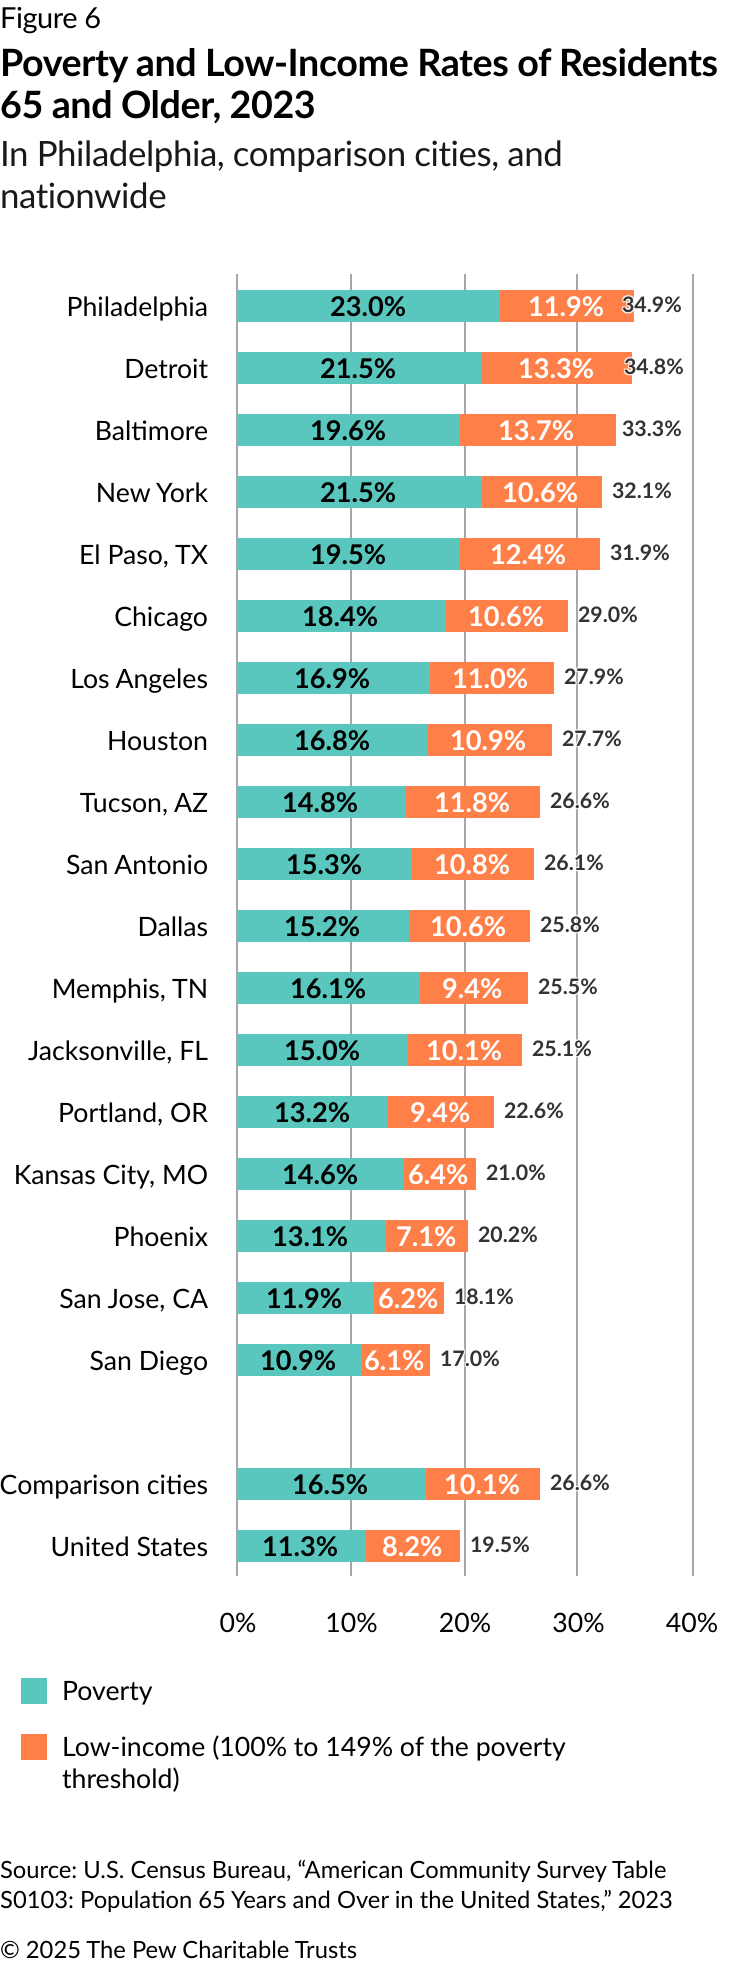
U.S. Census Bureau data from 2023 shows that 23% of older Philadelphians were living in poverty, a higher percentage than in most of the 17 comparison cities studied for this report. Of the 18 cities that Pew examined, Philadelphia was among seven where older residents’ poverty rate was higher than the poverty rate for the overall population. The poverty rate among Philadelphia’s older population (23%) was 2.7 percentage points higher than the rate for the population at large (20.3%). Only two other cities had a greater difference between the overall poverty rate and the poverty rate for older residents: San Jose, California, at 3.4 percentage points, and New York, at 3.3 percentage points.
An additional 11.9% of older Philadelphians, though not technically living in poverty, had incomes ranging from 100% to 149% of the poverty threshold, referred to in this report as “low income.”2 Together, 34.9% of older individuals (nearly 81,000 of 231,000 for whom poverty status could be determined) were living below the poverty threshold or just slightly above it. For this age cohort, the category included single-person households with incomes of $21,490 or less and two-person households with incomes of $27,090 or less.3

Many older residents in other U.S. cities faced similar financial constraints. A third or more of the older residents in Detroit and Baltimore lived below 150% of the poverty threshold. In all cities studied in this report, an average of 16.5% of older residents lived below the poverty level, and an additional 10.1% were in the low-income category—a substantially higher figure than the 11.3% of older Americans living in poverty across the nation and the additional 8.2% with low incomes. This occurred during a time of significant inflation in Philadelphia and throughout the country, and could increase in severity for low-income residents if prices continue to rise.
Among the other key findings of this research:
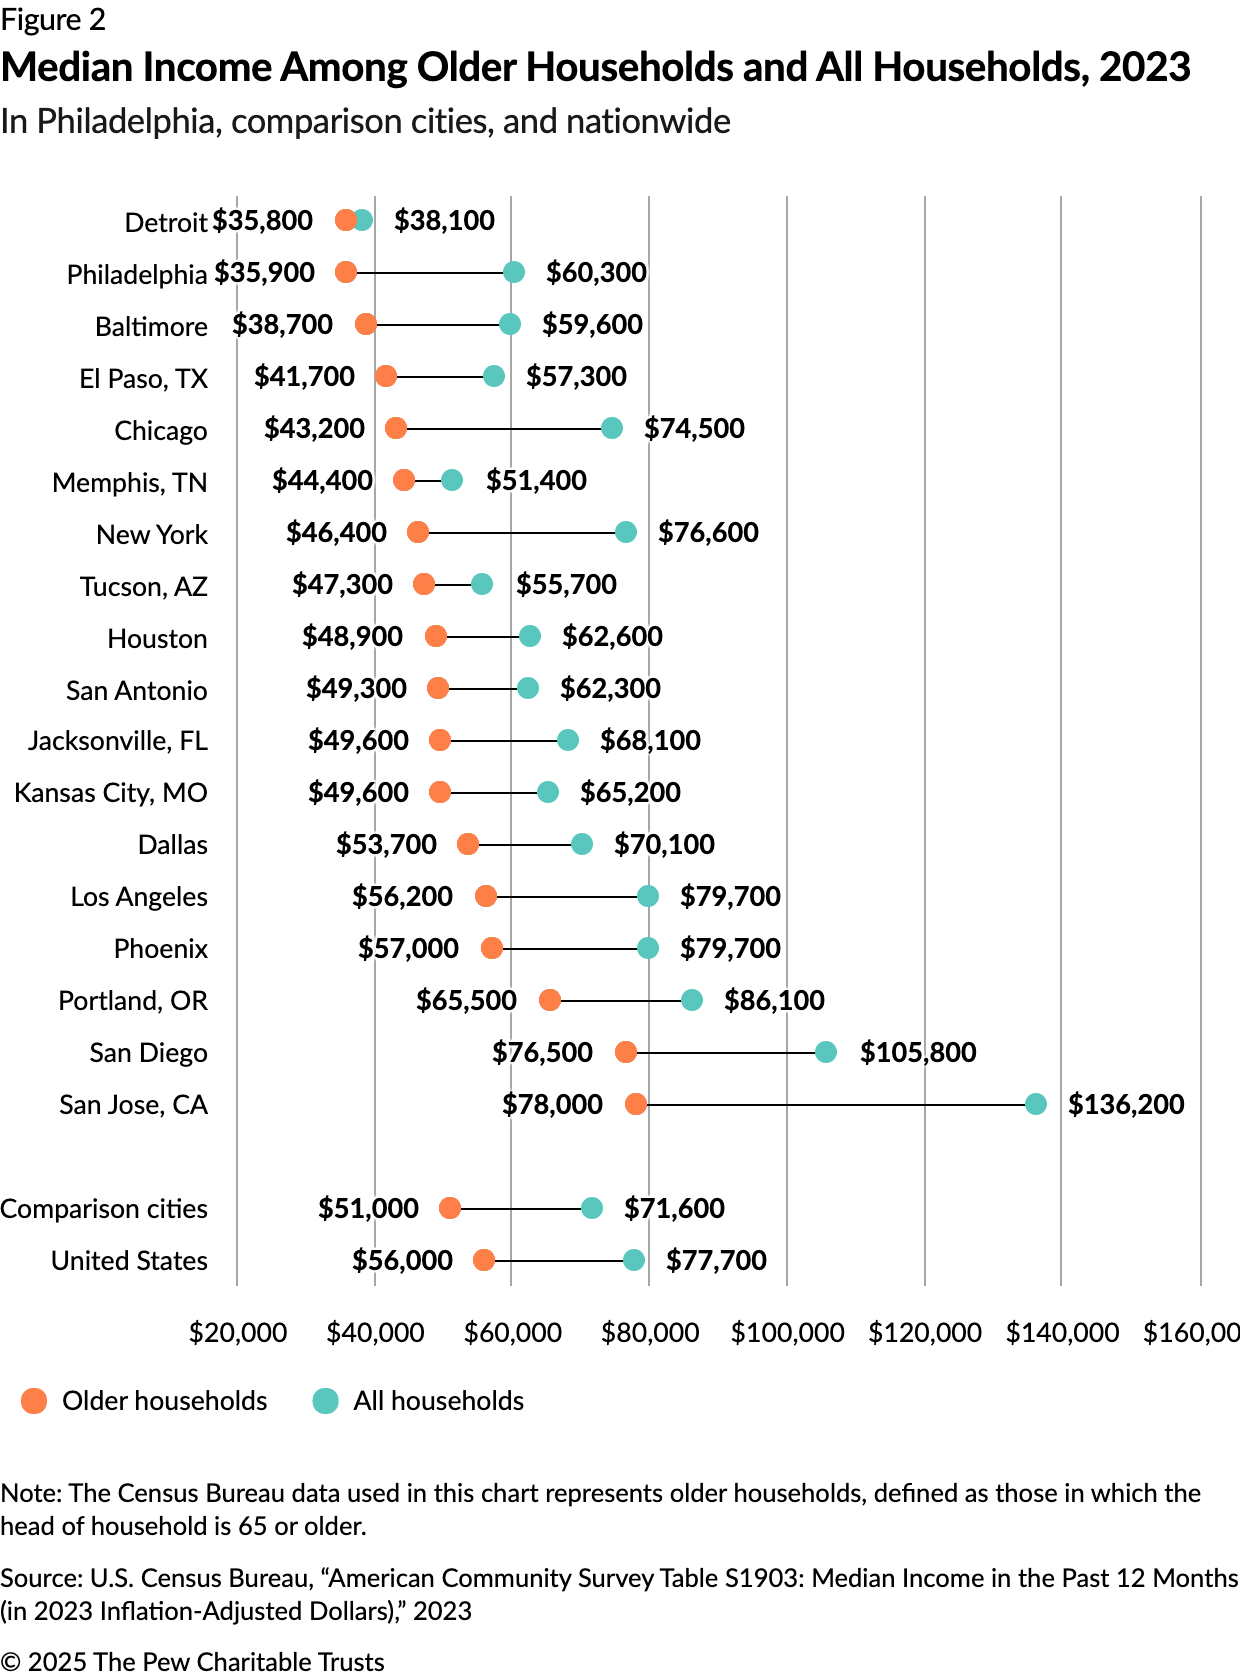
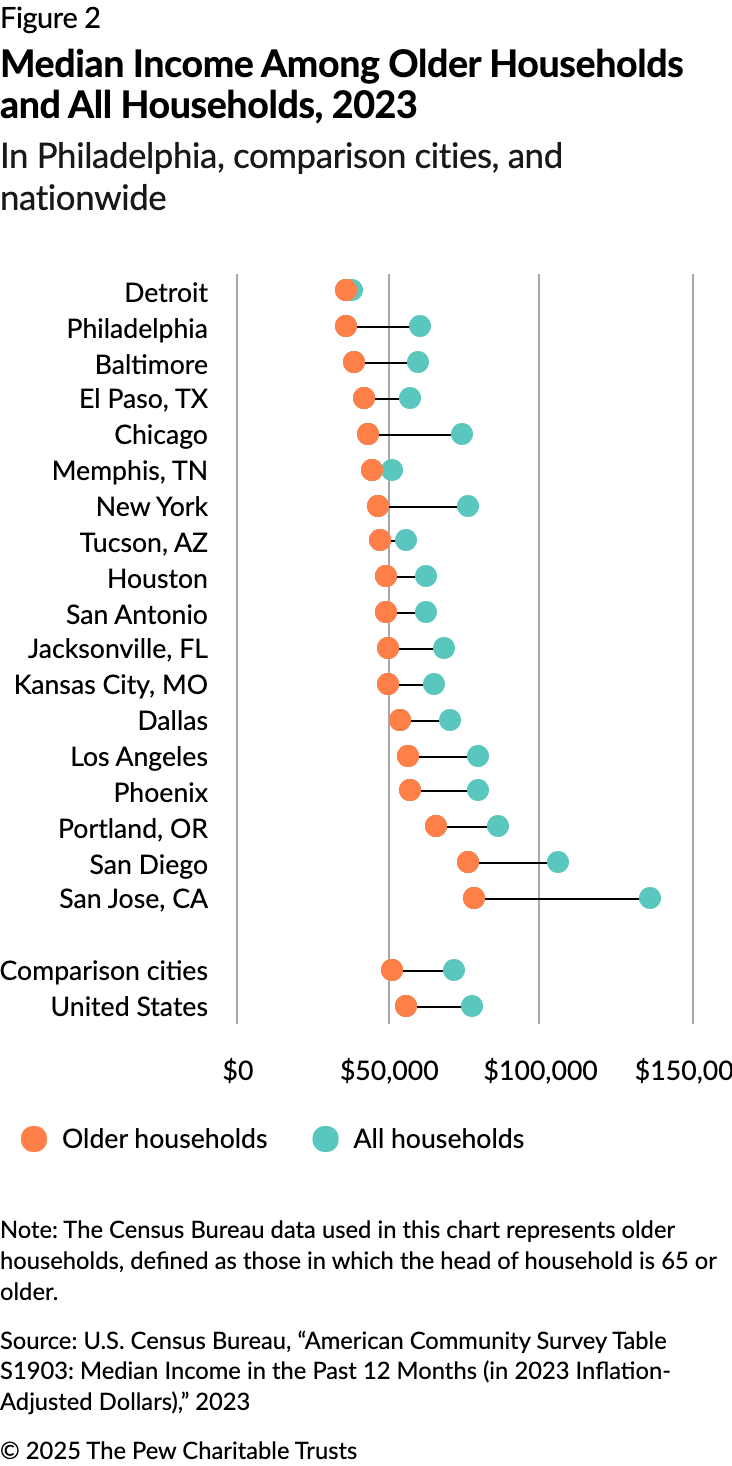
- In Philadelphia, the median income for older households (defined as those with a head of household age 65 or older) was $35,900, one of the lowest among the cities studied. Older households in Detroit had a similar median income of $35,800.4
- Among older households, the three most common sources of income were earnings, Social Security benefits, and retirement funds—including IRAs, 401(k)s, and pensions. Older Philadelphians, on average, had lower income from all three sources than was the case nationally or in the comparison cities.
- Labor force participation among older residents increased nationally, as it did in most comparison cities, from 2013 to 2023. This indicates that more people are working past age 65 or returning to the workforce after retiring. (The labor force participation rate is defined as the percentage of people 16 and older who are either employed or unemployed and actively looking for work.5)
Challenges stemming from poverty, limited income, and the need for older people to continue working beyond the traditional retirement age are coinciding with a demographic shift in the U.S. According to the Census Bureau, 1 in every 5 U.S. residents will reach retirement age by 2030. And by 2034, there will be more people 65 or older (some 77 million) than under the age of 18 (about 76.5 million).6
The Pew Charitable Trusts analyzed 2023 census data in the nation’s 10 most populous cities: New York; Los Angeles; Chicago; Houston; Phoenix; Philadelphia; San Antonio; San Diego; Dallas; and Jacksonville, Florida. In addition, Pew examined eight cities with a population of at least 500,000 and shares of residents ages 65 and older that are similar to Philadelphia’s: Baltimore; Detroit; El Paso, Texas; Kansas City, Missouri; Memphis, Tennessee; Portland, Oregon; San Jose; and Tucson, Arizona.
Change in older populations
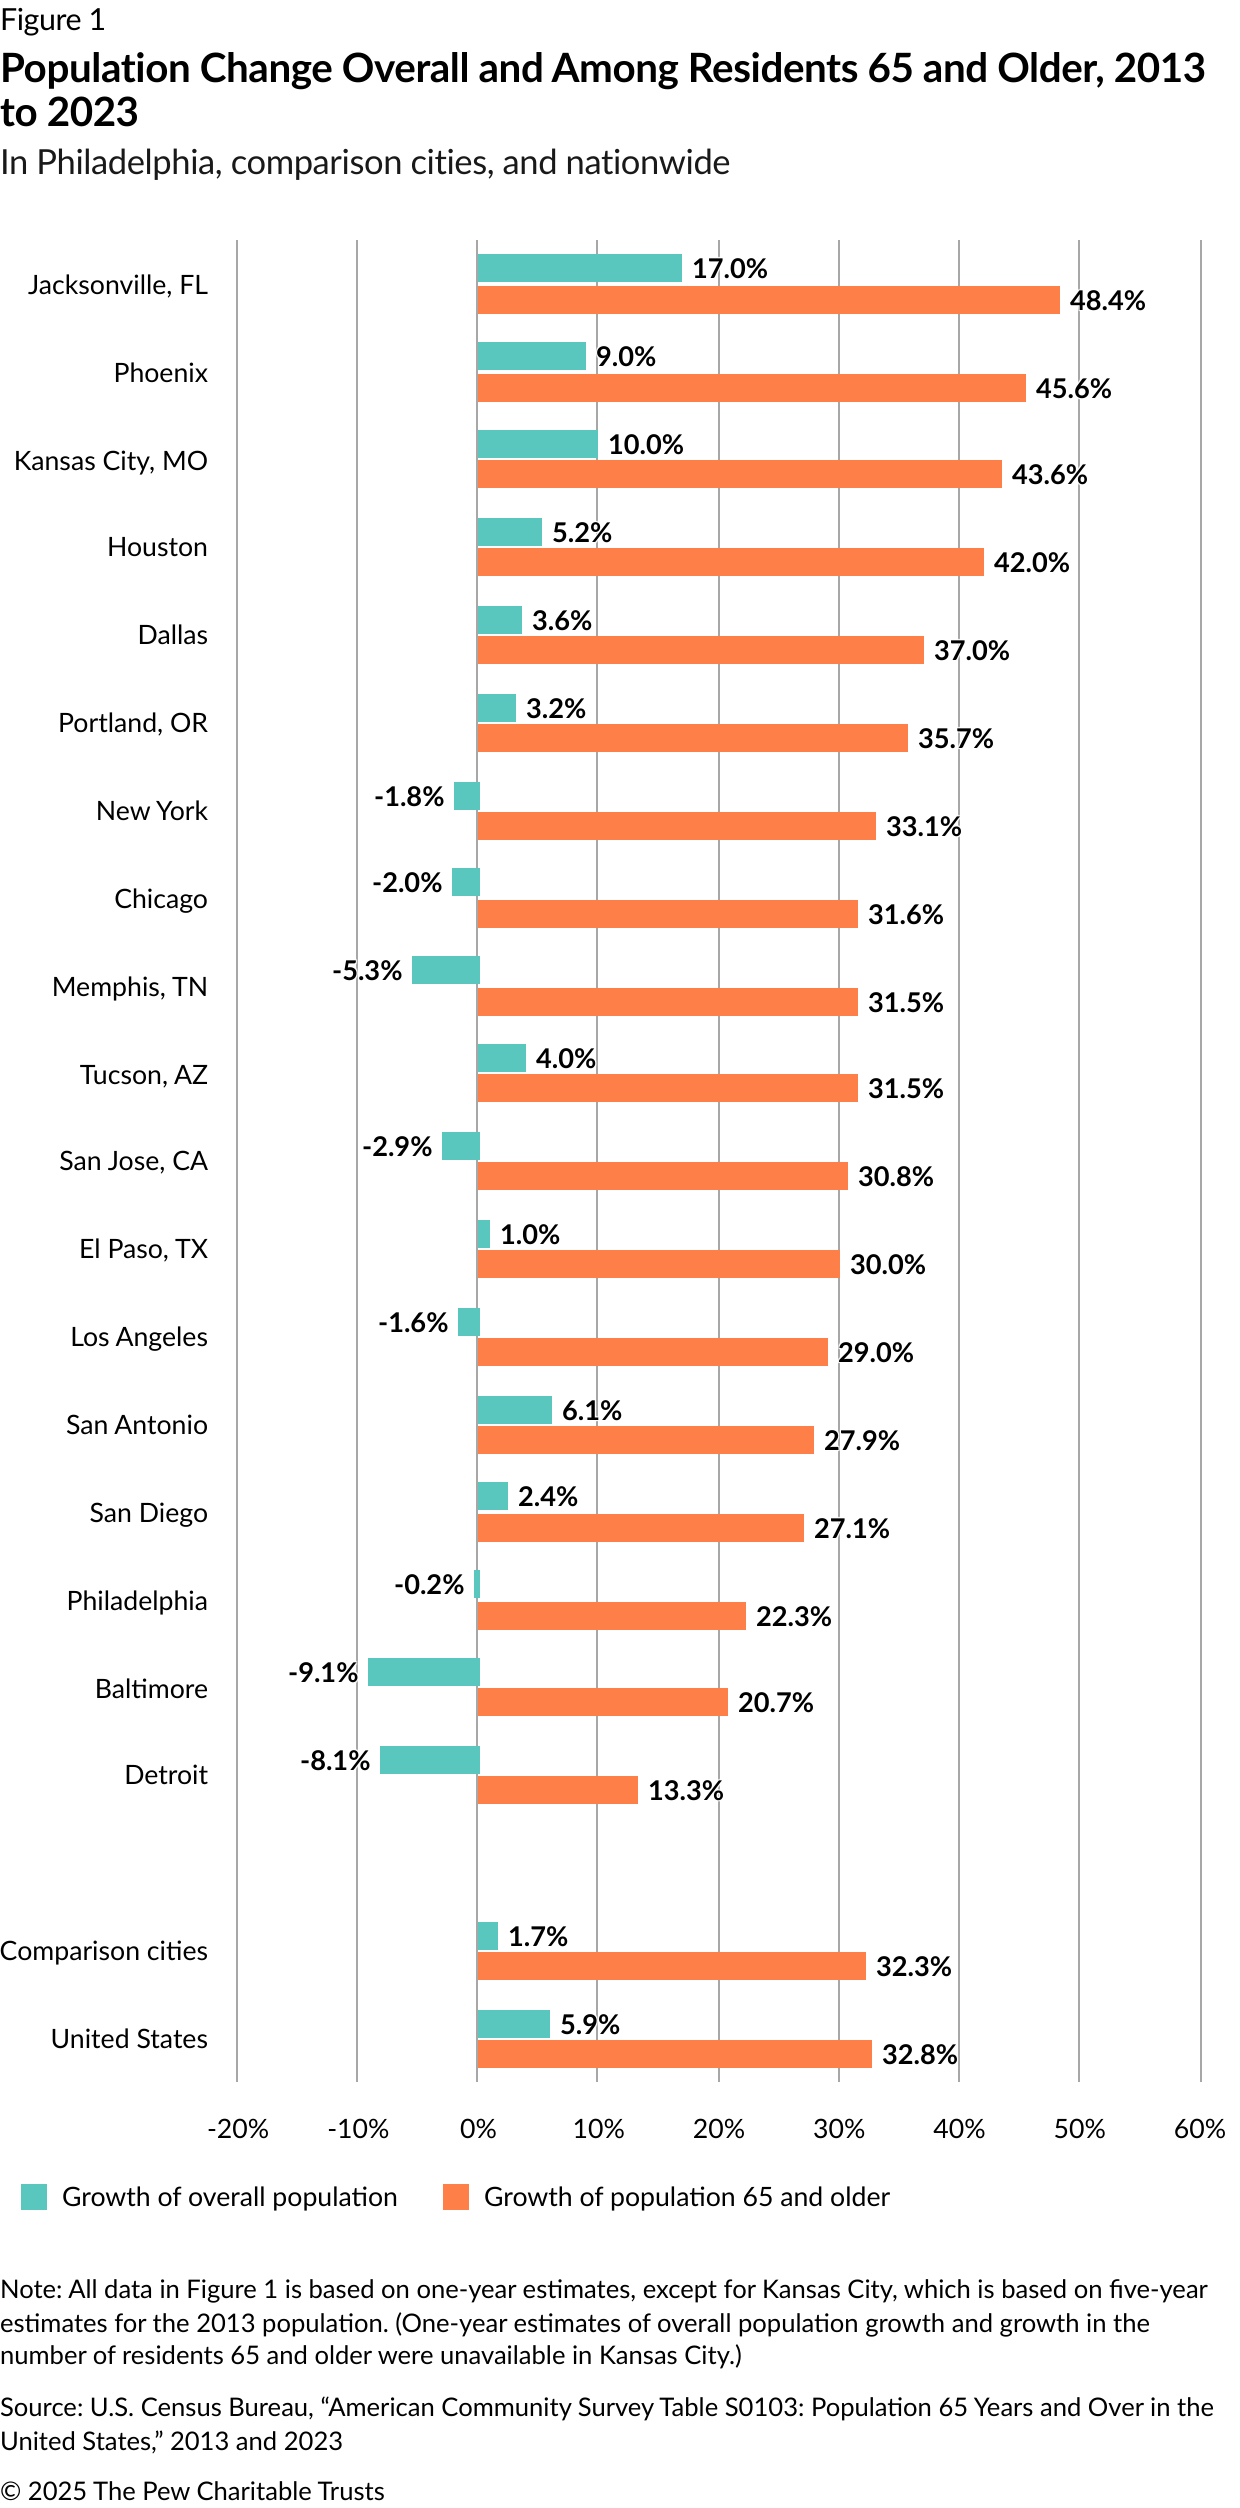
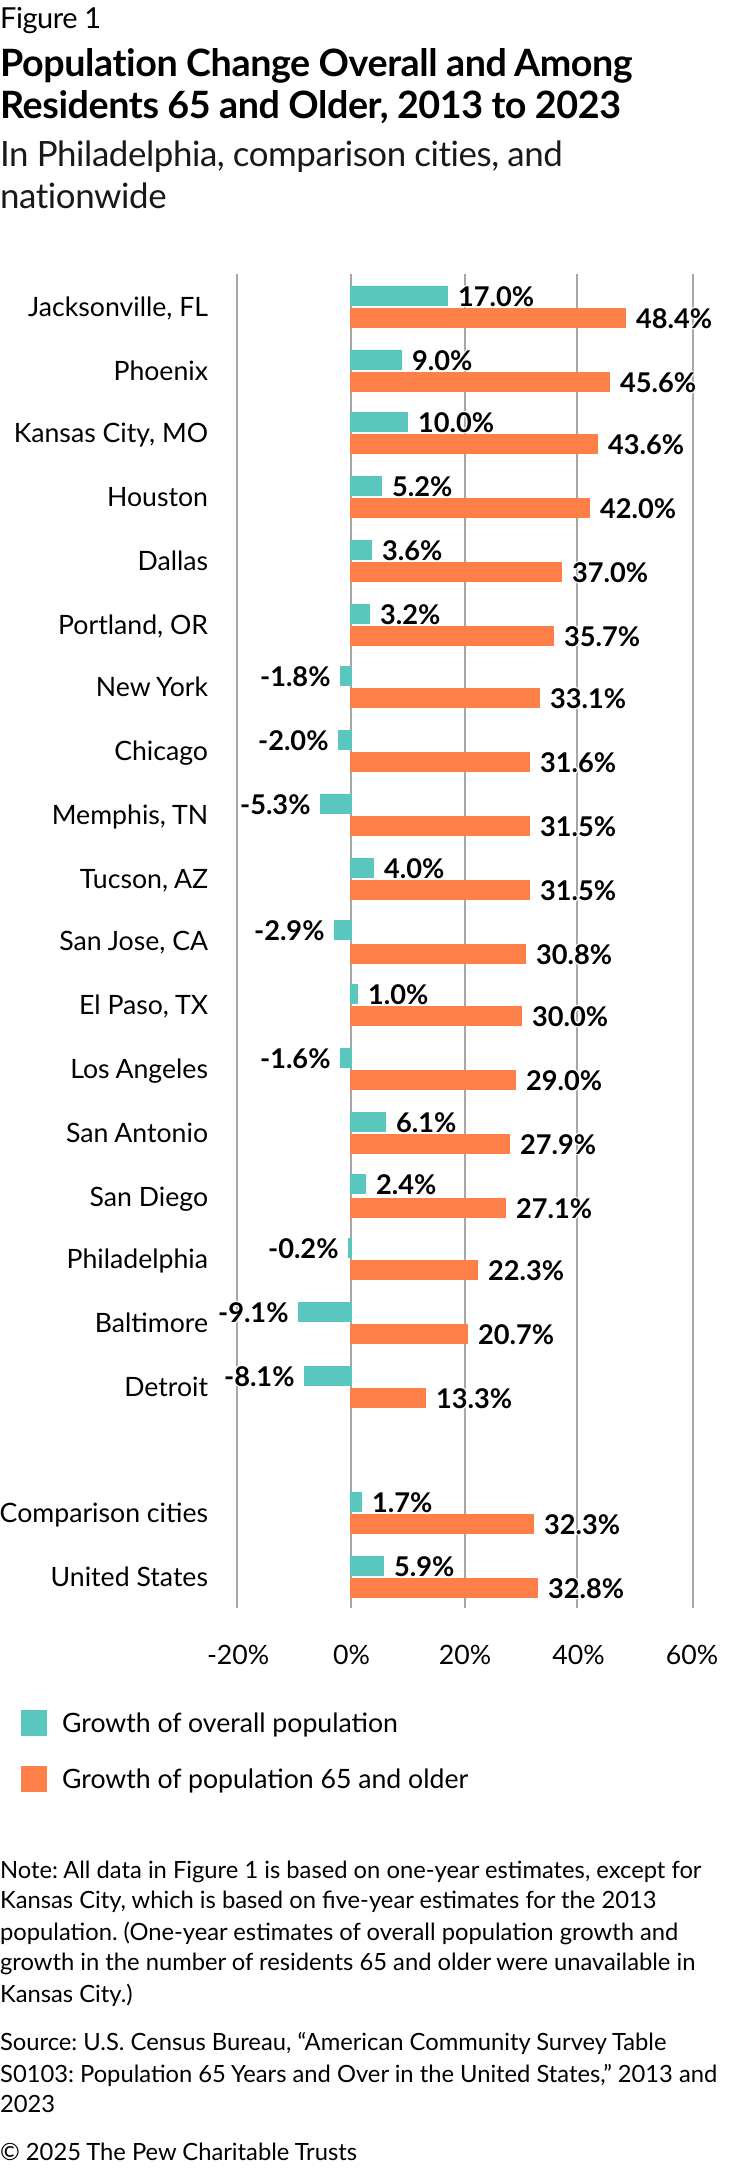
Like many other cities in the United States, Philadelphia has seen a rise in its population of older residents, which increased by 22.3% from 2013 to 2023, according to census data.7 During that period, the population of older residents in the U.S. grew by 32.8%, compared with the overall national growth rate of just 5.9%. These demographic trends—which are projected to continue—present several potential challenges, as discussed below.
Although the cities in Pew’s analysis varied in terms of overall population change, all of them, including Philadelphia, saw their older populations grow. The cities with the largest population increases had higher growth rates among older residents as well. For example, Jacksonville recorded both the highest increase in overall population (17%) and among older residents (48.4%). Cities that experienced more modest increases, or even declines, in their overall population recorded increases in the number of older residents as well.
That was the case in Philadelphia, where the overall population decreased by 0.2%, while the population of residents 65 and older rose by 22.3%. The growth of this age cohort in Philadelphia was one of the smallest among the comparison cities. Only Baltimore and Detroit experienced less growth in the number of residents 65 and older. Both of those cities, however, experienced larger overall population declines. (See Figure 1.)
Median income levels among older households
Older households tend to have lower incomes than younger ones. In Philadelphia, the median income for older households ($35,900) was just 60% of the overall city median ($60,300)—among the lowest average among all comparison cities. The only city with a lower median income for older households was Detroit, at $35,800. (See Figure 2.)
Sources of income for older households
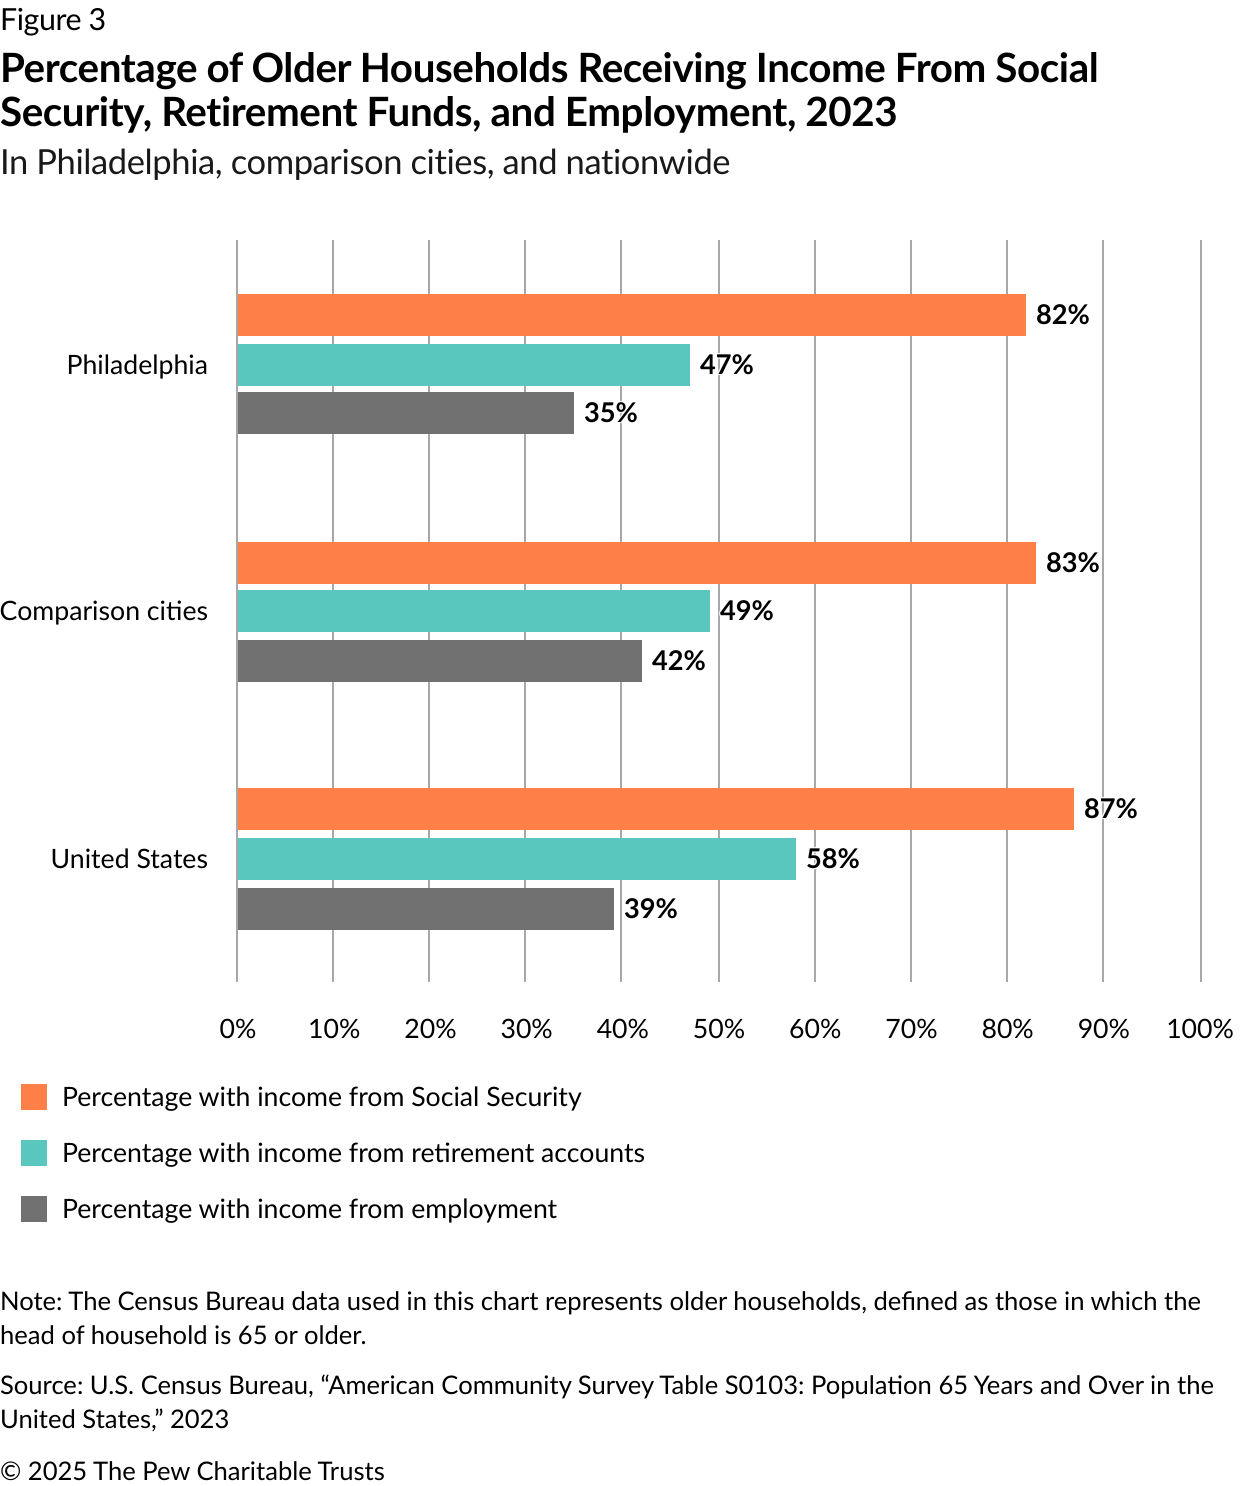
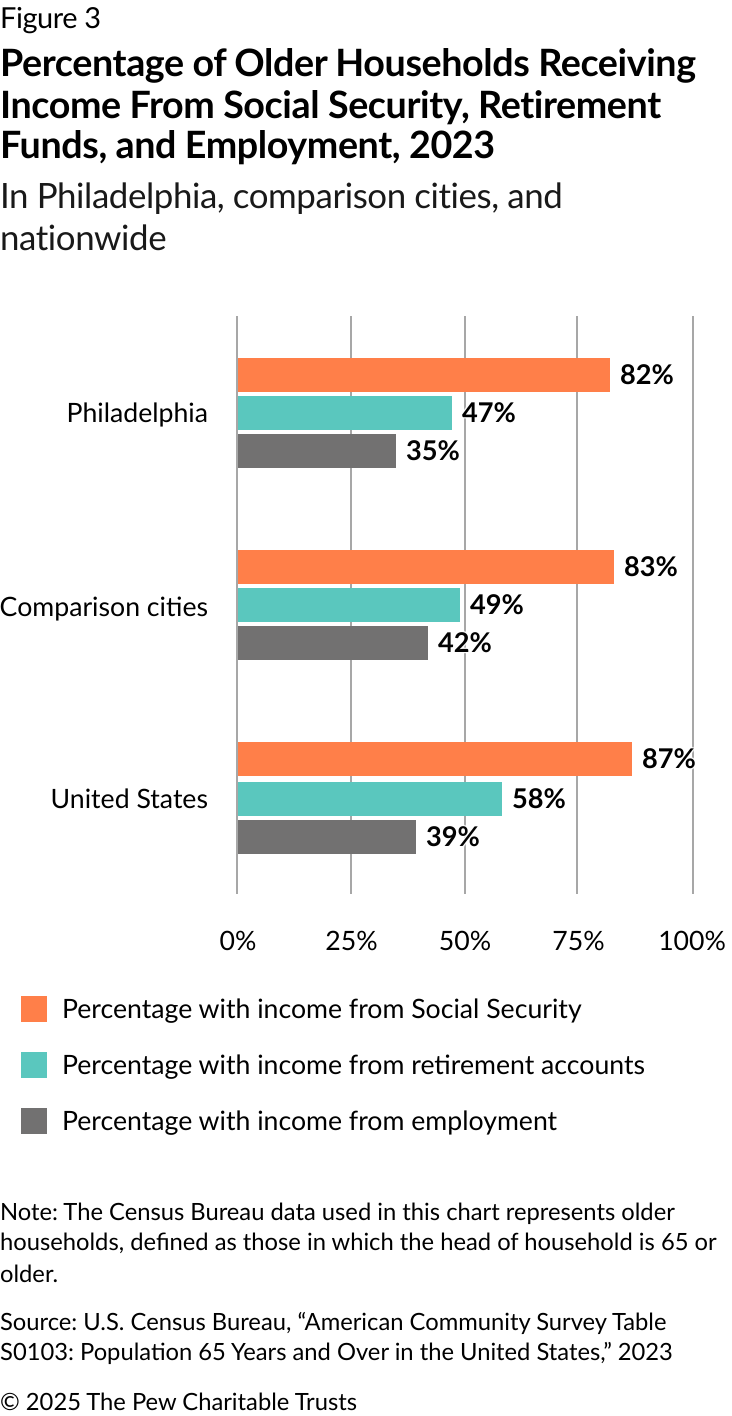
Older households rely heavily on Social Security benefits, which pay a percentage of workers’ pre-retirement income. In the U.S., 87% of older households received Social Security as part of their annual income in 2023. In Philadelphia, however, a lower percentage of older households received these benefits than was the case nationally; that was also true for all comparison cities.
In those 17 other cities, 83% of older households relied on income from Social Security, compared with 82% in Philadelphia. Older households also typically received some form of retirement income, including personal or employer-provided retirement accounts such as IRAs, Roth IRAs, 401(k)s, and 403(b)s, as well as pensions from their places of employment. Nationally, more than half (58%) of older households received such income in 2023. Among the comparison cities, the figure was 49%, while the figure was lower in Philadelphia, at 47%.
The third most common source of income for older households was part-time or full-time employment. Nationally, 39% of older households received income from work, a lower percentage than from Social Security or retirement funds. In comparison cities, 42% of older households drew income from work; in Philadelphia, the figure was 35%.
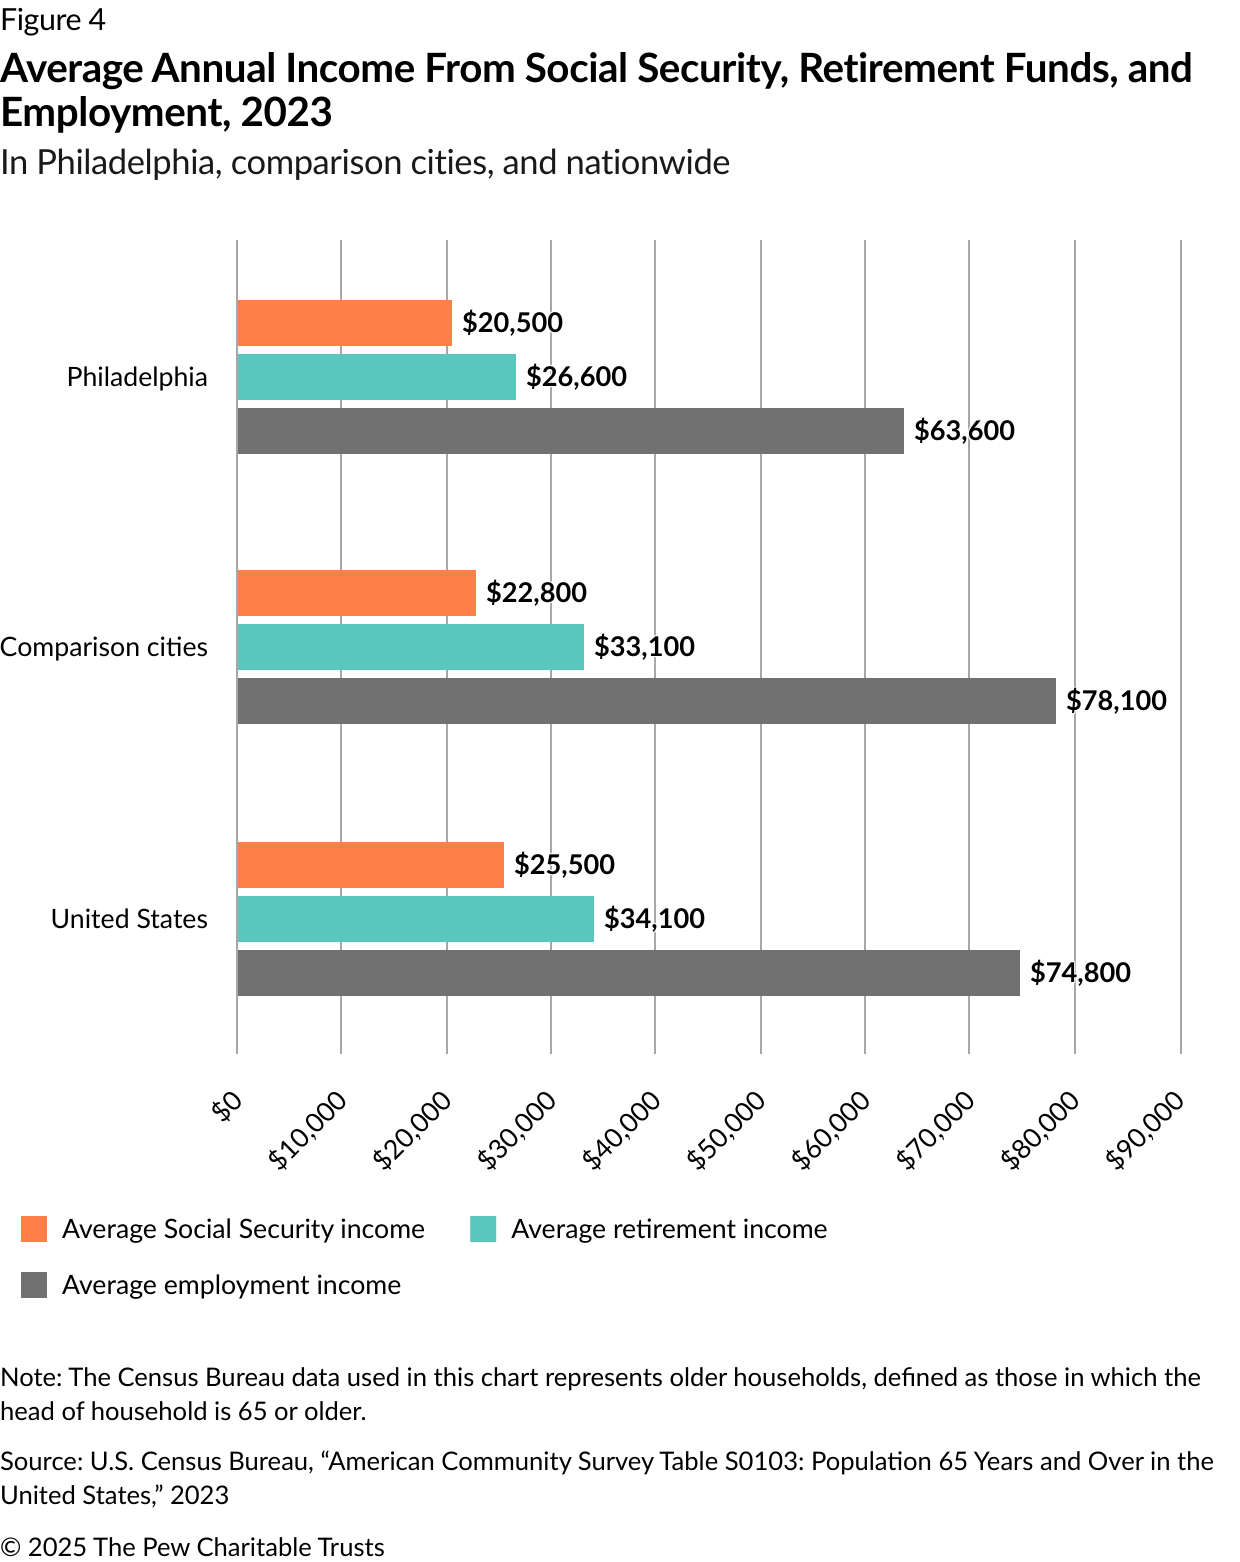
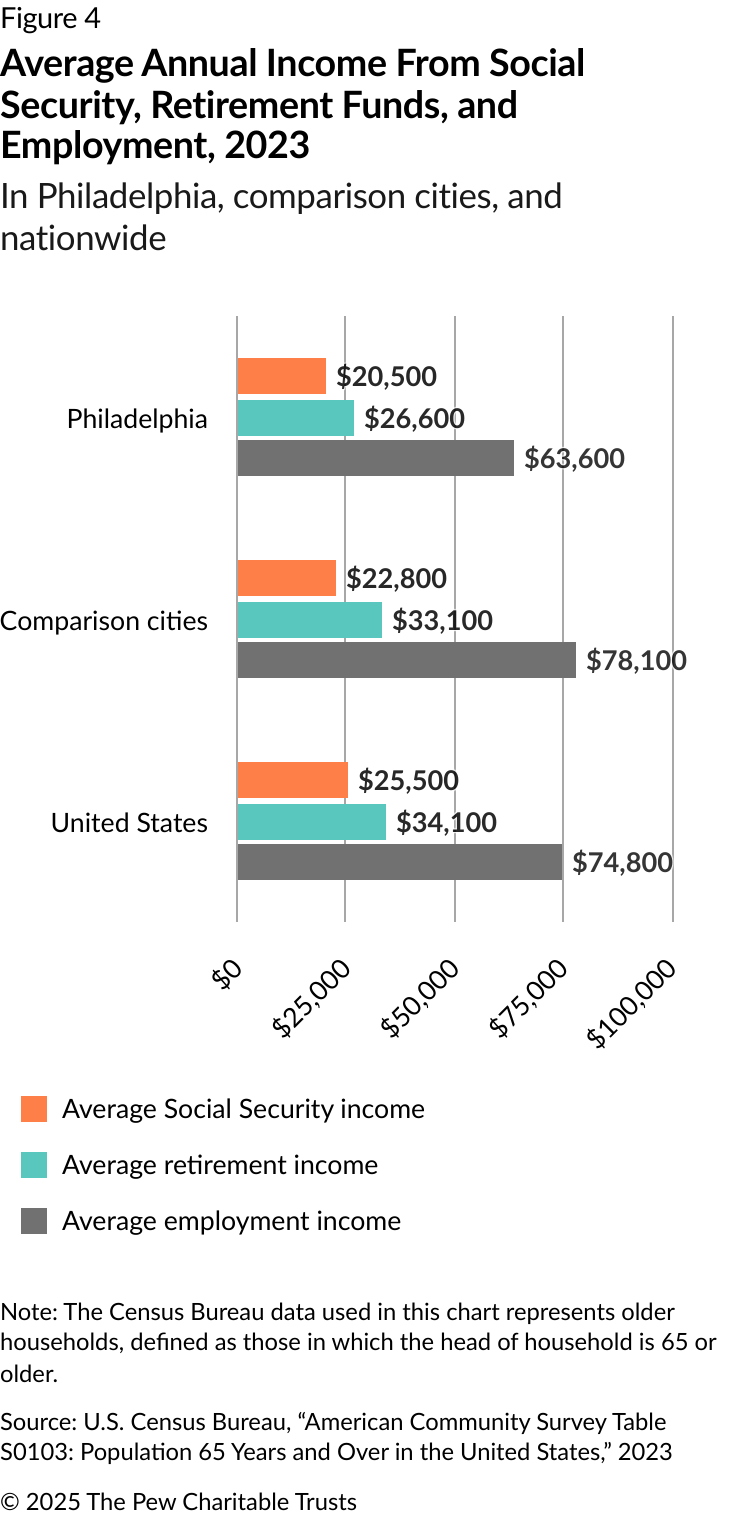
The average income from Social Security among the comparison cities was $22,800, meaning that many households relying solely on Social Security were close to the low-income threshold. Philadelphia’s average was even lower, at $20,500.
Nationwide, the average retirement income was $34,100—higher than the $33,100 average in the comparison cities.
In the U.S. overall, households with older residents who worked earned $74,800, on average—considerably more than those who relied upon either Social Security or retirement funds, or both. In the comparison cities, average earnings for this cohort exceeded the national average, at $78,100, and the group’s earnings averaged $63,600 in Philadelphia.
Philadelphia was near the bottom of the list of comparison cities for each type of income, with households with older residents who worked making about 80% of the national average from earnings, retirement, and Social Security. (See Figure 4.)
In Philadelphia, the average earned income for all households was $95,100, placing the city toward the middle among the cities studied (10th out of 18). However, the average earnings for older households, at $63,600, placed the city 15th out of 18. The average wages for Philadelphia’s older households were just 67% of the average for all households in the city. That’s less than the average wages for older households in comparison cities (76% of the average for all households in these cities).
Labor force participation among older residents
While many older adults retire around age 65, a sizable and growing share of that population continues to work, either out of necessity or personal preference. A 2023 Pew Research Center study shows that factors such as education level, job flexibility, and changes to Social Security policy have contributed to that trend.8
Pew’s analysis of census data showed that the labor force participation rate for older residents increased by 2 percentage points nationwide from 2013 to 2023 (from 17.2% to 19.2%). There were increases in every comparison city except Houston, which remained virtually unchanged over that period. In Philadelphia, the participation rate for older residents during that period increased by 3.3 percentage points, from 14.1% to 17.4%. (See Figure 5.)
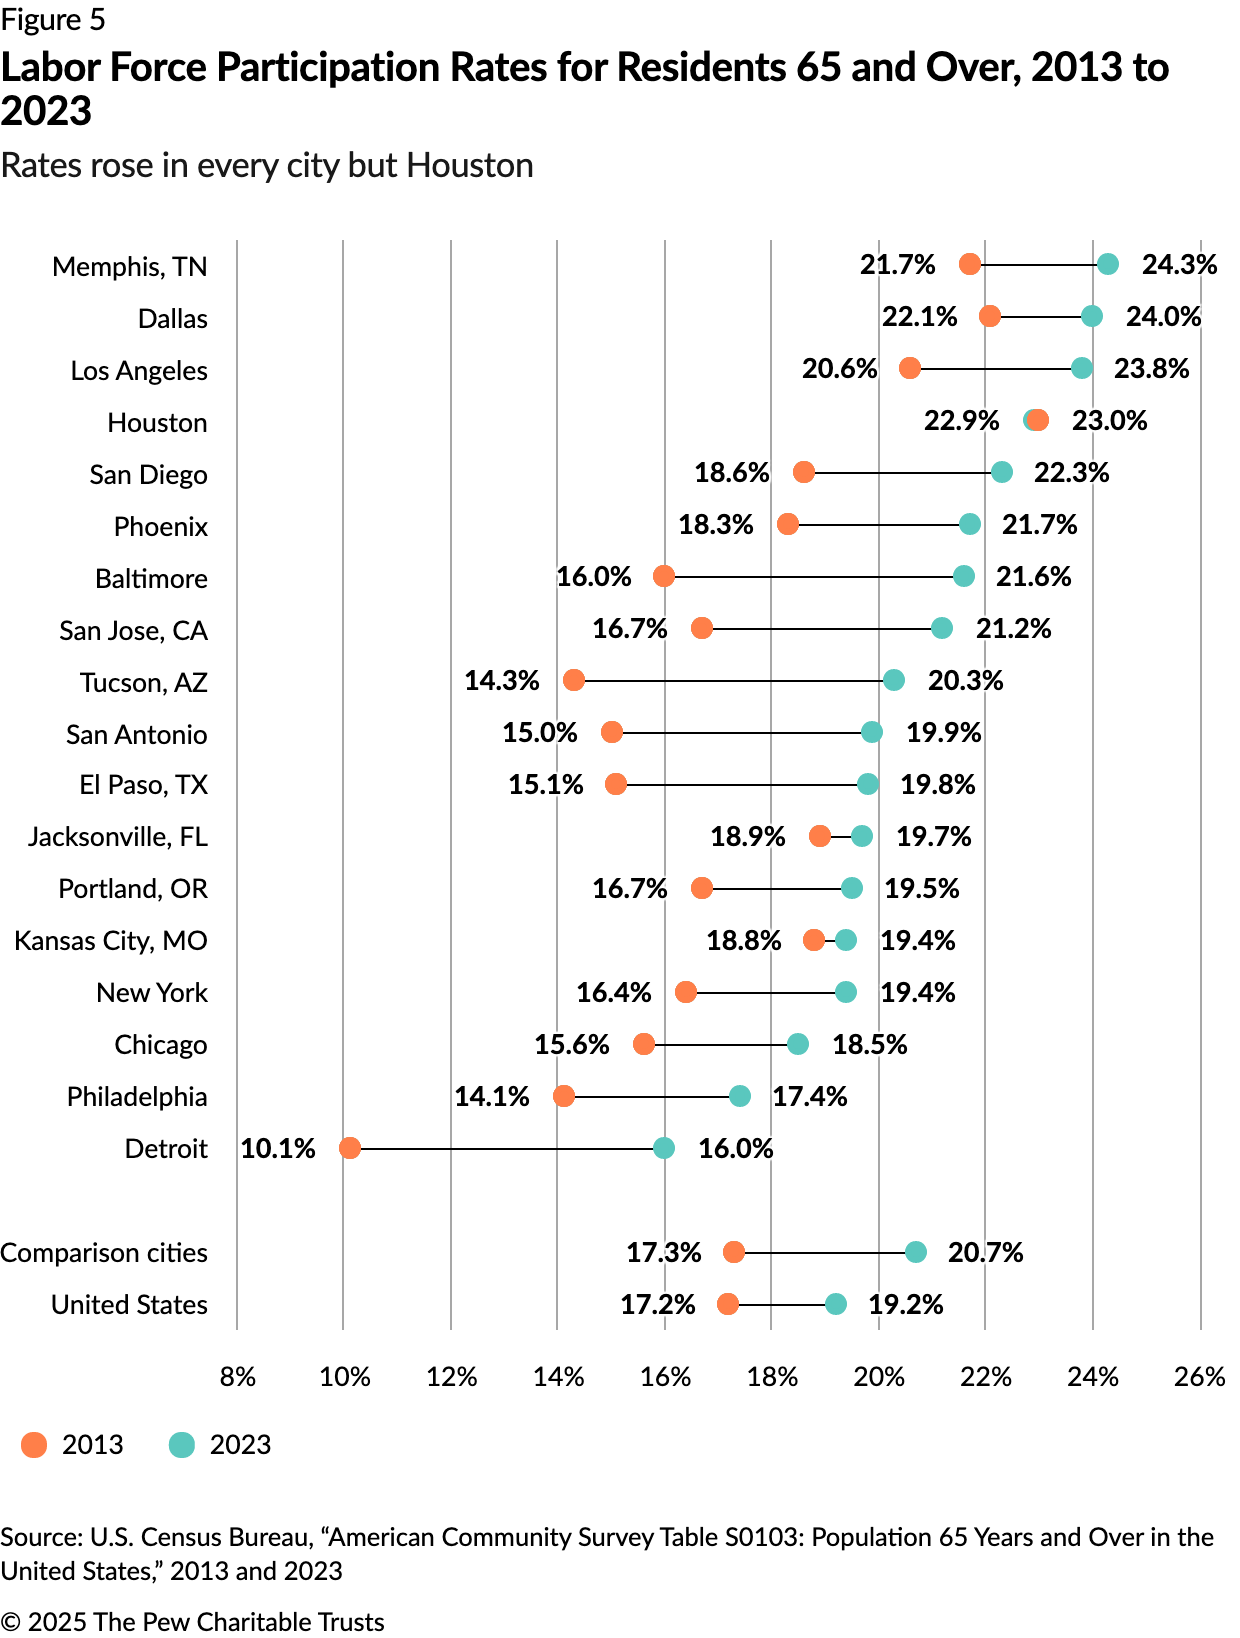
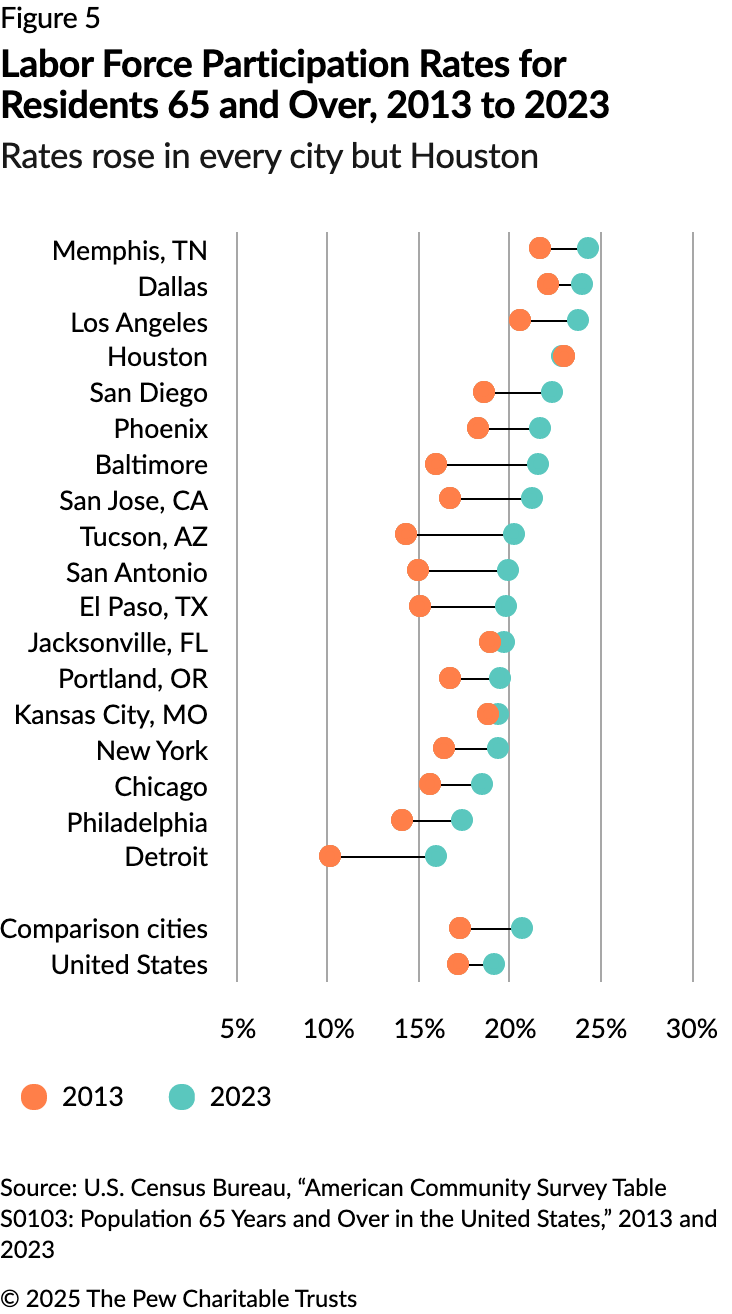
On average, the comparison cities had a labor force participation rate of 20.7% for older adults in 2023; the national rate was 19.2%. Philadelphia was near the bottom of the list, at 17.4%, even though the participation rate for its entire population (64.3%) was similar to the national rate (63.6%).
Prevalence of poverty and low-income status among older residents
Nationwide, 11.3% of older Americans lived below the poverty threshold, which was around $14,330 for individuals ages 65 and older in 2023. An additional 8.2% were considered low income, meaning their incomes were below 150% of the poverty threshold—around $21,490.9 In total, 19.5% of older Americans lived below 150% of the poverty threshold.
In the comparison cities, 16.5% of older residents were living in poverty, while an additional 10.1% of older residents had low incomes—a combined poverty and low-income rate of 26.6%. Philadelphia and Detroit had the highest rates of older residents in the combined poverty and low-income group, at 34.9% and 34.8%, respectively. (See Figure 6.)
Nationwide, the share of older residents living in poverty or with low incomes changed very little from 2013 to 2023 (0.6 percentage points), while the overall poverty rate fell by more than 3 percentage points.
In more than half of the comparison cities, as well as nationwide, the overall population had higher poverty rates than the older population did. This was not the case in seven cities, one of which was Philadelphia, where the poverty rate for older residents was 2.7 percentage points higher than for the overall population (23%, compared with 20.3%). The only cities with similar magnitudes of difference were New York and San Jose, where the poverty rates for older residents were 3.3 and 3.4 percentage points higher, respectively, than those of the general population.
Conclusion
Philadelphia and other U.S. cities are experiencing growth in their populations of residents 65 and older. This group has had a profound impact by stimulating the local economy, volunteering throughout the city, and being civically engaged. Additionally, many of these older residents face significant financial challenges that affect their lives and their communities.
As shown in this report, older Philadelphians—like their counterparts in comparison cities—have average incomes below the national average for people in their age group and experience poverty at a rate higher than the national average. More than a third of older Philadelphians live in poverty or only slightly above the poverty threshold (100% to 149% of the poverty level)—a statistic comparable to only two of the other 17 cities examined, Detroit and Baltimore.
Although some older Philadelphians are working past age 65 to help manage their financial challenges, a variety of factors—including health concerns and a lack of suitable employment opportunities—prevent others in this age group from pursuing that option.
Endnotes
- “American Community Survey and Puerto Rico Community Survey 2023 Subject Definitions,” U.S. Census Bureau, https://www2.census.gov/programs-surveys/acs/tech_docs/subject_definitions/2023_ACSSubjectDefinitions.pdf. According to the Census Bureau’s American Community Survey, residents 65 and older are considered “old age,” as exhibited in the following definition: “[The] old-age dependency ratio is derived by dividing the population 65 years and over by the 18-to-64 population and multiplying by 100.”
- “American Community Survey Table S0103: Population 65 Years and Over in the United States,” U.S. Census Bureau, https://data.census.gov/table/ACSST1Y2023.S0103?q=s0103. This table includes two categories of poverty levels for those whose poverty status could be determined: “Below 100% of the poverty level” and “100% to 149% of the poverty level.” Pew used these data points to gauge what the U.S. Census Bureau considered to be living in poverty, according to the first category, and low-income, according to the second category.
- “American Community Survey and Puerto Rico Community Survey 2023 Subject Definitions,” U.S. Census Bureau. According to the Census Bureau’s American Community Survey, “one person in each household is designated as the householder. In most cases, this is the person or one of the people in whose name the home is owned, being bought, or rented and who is listed on line one of the survey questionnaire. If there is no such person in the household, any adult household member 15 years old and over could be designated as the householder.”
- “American Community Survey and Puerto Rico Community Survey 2023 Subject Definitions,” U.S. Census Bureau. According to the Census Bureau’s American Community Survey, “the 2019 questionnaire revised the retirement income question to reflect the growing popularity of defined contribution retirement plans over defined benefit retirement plans (such as pensions). For the first time, the 2019 questionnaire specifically asked about income from retirement accounts such as IRA, Roth IRA, 401(k), 403(b), and similar accounts specifically designed for retirement.”
- “American Community Survey and Puerto Rico Community Survey 2023 Subject Definitions,” U.S. Census Bureau.
- U.S. Census Bureau, “Older People Projected to Outnumber Children for First Time in U.S. History,” news release, March 13, 2018, https://www.census.gov/newsroom/press-releases/2018/cb18-41-population-projections.html#:~:text=%E2%80%9CBy%202034%20(previously%202035),decade%20for%20the%20U.S.%20population.
- “American Community Survey Table S0103: Population 65 Years and Over in the United States,” U.S. Census Bureau.
- Pew Research Center, “Older Workers Are Growing in Number and Earning Higher Wages,” 2023, https://www.pewresearch.org/social-trends/2023/12/14/older-workers-are-growing-in-number-and-earning-higher-wages/.
- “American Community Survey and Puerto Rico Community Survey 2023 Subject Definitions,” U.S. Census Bureau. The American Community Survey does not use the federal poverty line but instead uses poverty thresholds from the Office of Management and Budget, which is a two-dimensional matrix of 1982 dollar amounts based on household size and, for one- or two-person households, the head of household’s age. Each month in a year has a multiplier for the 1982 dollar amount. For a one-person household in which the head of household is 65 or older, the threshold is $4,626 in 1982 dollars. For a respondent in January 2023, that figure would be multiplied by 3.03239, for a total of $14,028. For a response in December 2023, it would be multiplied by 3.14862, for a total of $14,566. The average of the poverty threshold multiplied by all 12 months’ factors for 2023 is $14,330.
People


