Business Ownership in Philadelphia and Other Major U.S. Cities
Philadelphia narrowed the gap but still lagged by race, ethnicity, and sex

Overview
Business ownership, like homeownership, is a major driver of economic mobility and wealth for many individuals and families, but it varies considerably by race, ethnicity, and sex. Federal data sheds new light on how, in recent years, business ownership has risen sharply throughout the country but at uneven rates for Black, Hispanic, Asian, White, female, and male entrepreneurs in different cities and counties, reflecting varying local economic environments.
In 2022, the latest year for which data was available, Philadelphia’s business density—the number of businesses per capita, a useful way to compare ownership across groups, localities, and periods—remained below that of other localities and the nation. That gap narrowed slightly, however, after the historic spike in entrepreneurship in many places following the COVID-19 outbreak. Broken down by race and ethnicity, the density of the city’s Asian, Hispanic, and White businesses rose slightly compared with those of peer localities, while the density of Black/African American businesses remained well below that of comparison localities. In other words, business ownership rose for some groups more than others; and even within a given group, the degree of business density varied by location.

Rising business density has been shown to indicate the expansion of economic well-being and the narrowing of wealth gaps, while falling density may signal the opposite.1 Low density means there is a comparatively sparse ecosystem of businesses for residents to patronize and find jobs with, for entrepreneurs to partner with and compete against, for lenders and investors to help grow, and for city agencies and schools to rely on for tax revenue. Throughout this analysis, business density is defined as the number of firms per 1,000 residents 16 and older.2 The analysis captures firms with employees (employer firms) and those without employees (nonemployer firms, such as individual contractors, freelancers, or gig workers). The federal data used for this analysis omits a few categories of businesses, including very low-grossing businesses, nonprofit service providers, government-owned firms, and corporations with many shareholders.3 (See the methodology for details.)
This analysis uses data on ownership characteristics from the Annual Business Survey, which is conducted jointly by the U.S. Census Bureau and the National Science Foundation and released at the county level every five years. The latest data, covering 2022, was released in December 2024. For comparisons to Philadelphia, which is both a city and a county, The Pew Charitable Trusts identified 12 other counties or county equivalents with at least 250,000 residents whose central city represented most of that population: the city of Baltimore; Davidson County, Tennessee (Nashville); Denver County, Colorado (Denver); Washington, D.C.; Duval County, Florida (Jacksonville); Fayette County, Kentucky (Lexington); Marion County, Indiana (Indianapolis); New York City; Orleans Parish, Louisiana (New Orleans); San Francisco County, California (San Francisco); Suffolk County, Massachusetts (Boston); and the city of St. Louis.
Business growth during pandemic
From 2012 to 2022, the number of businesses rose significantly in all the comparison areas after decades of marginal change, with most of the increase occurring in the final years of the decade-long period, during the COVID-19 pandemic. The number of employer firms in Philadelphia grew 15%, to around 23,980, according to the federal data covering most, but not all, businesses. Nonemployer firms in the city grew 46%, to around 122,000.
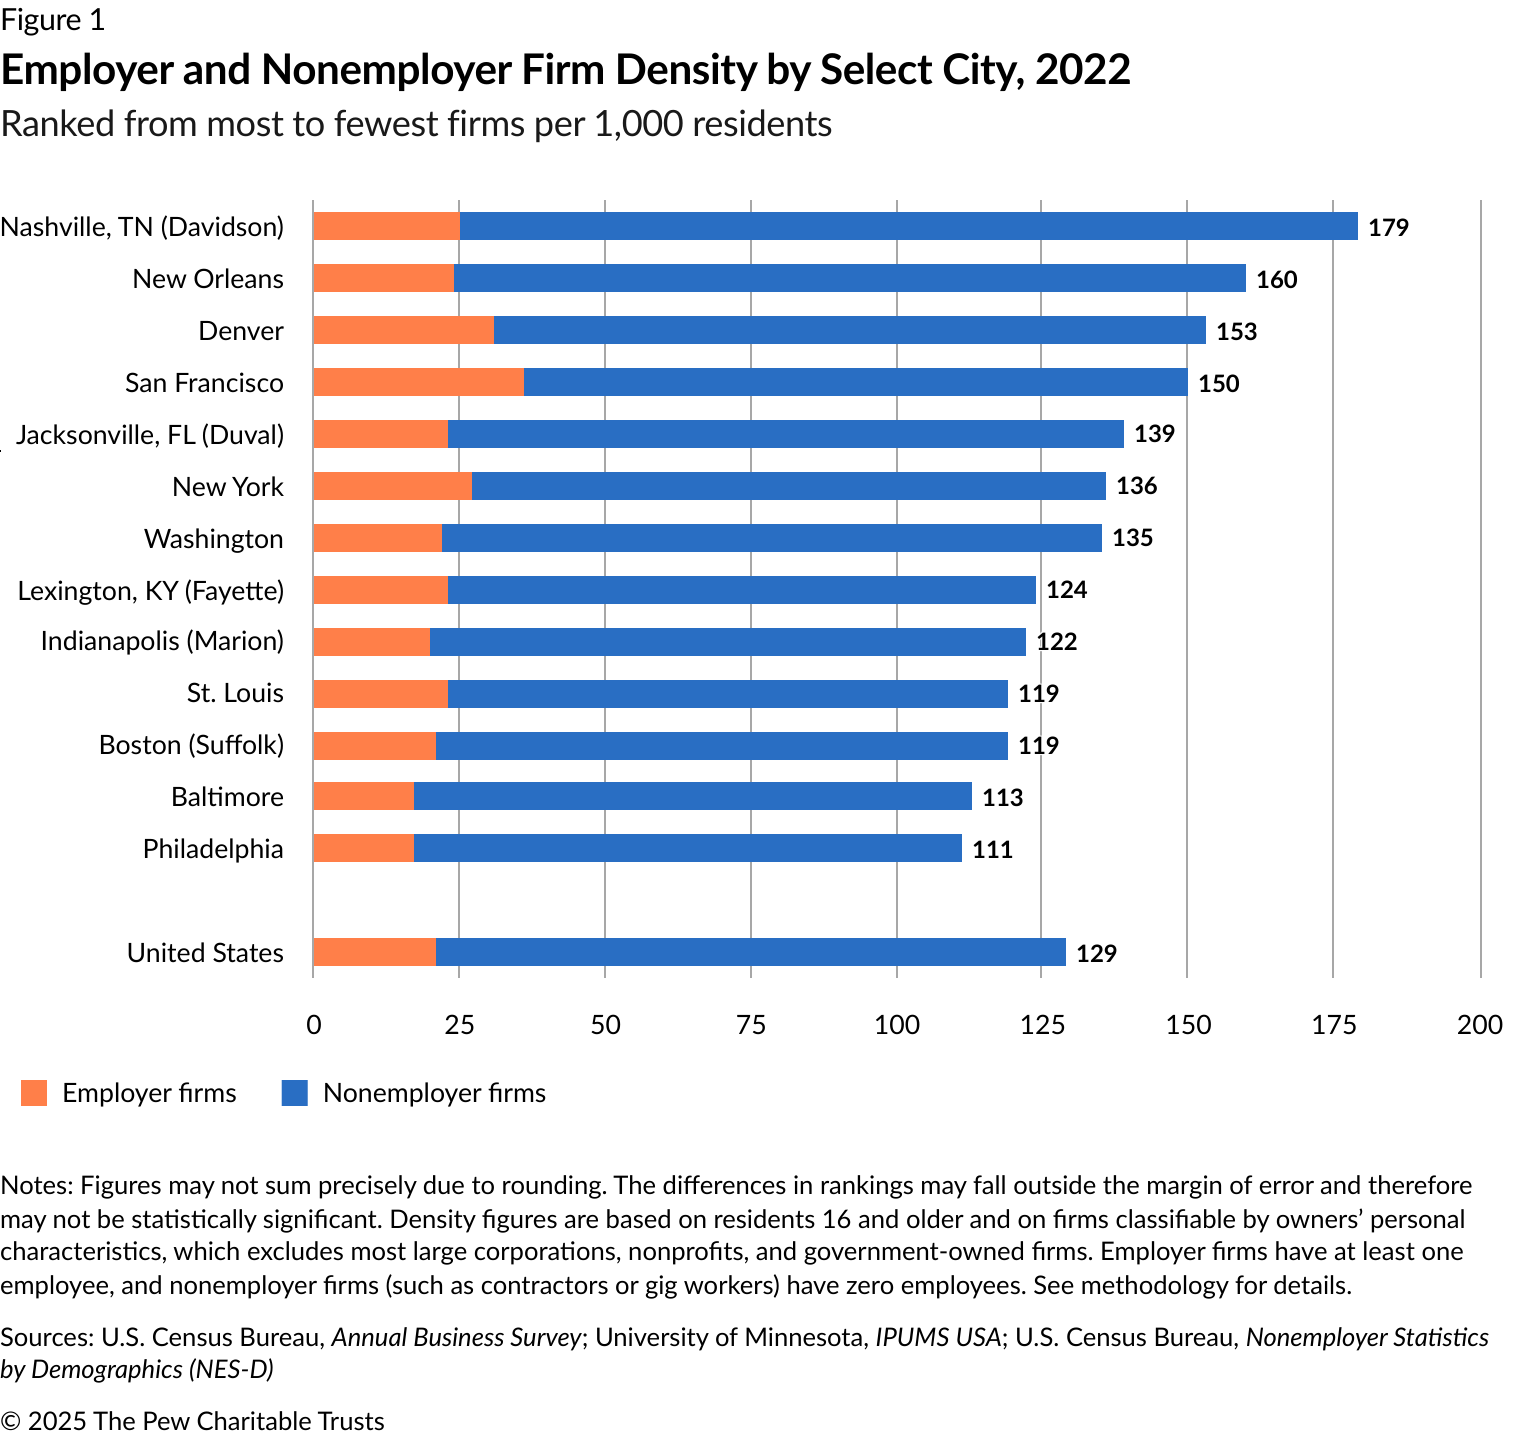
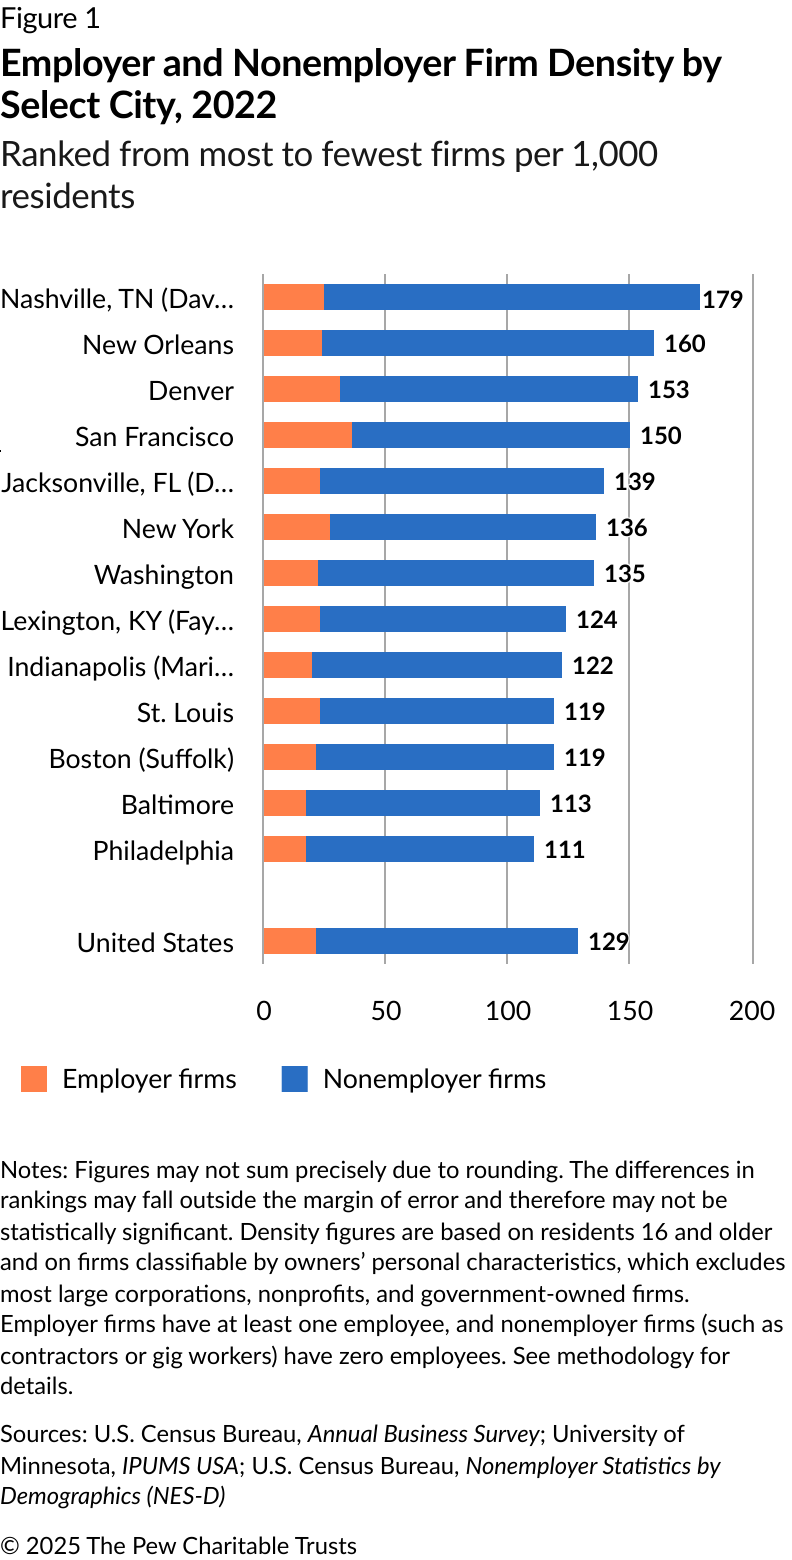
Powered by those increases, Philadelphia in 2022 attained its highest business density since at least 2007: 17 employer firms and 94 nonemployer firms per 1,000 residents, or a total of 111 firms per 1,000 residents in 2022. That was an increase from 82 total firms in 2012 and 75 total firms in 2007.4
While Philadelphia’s growth in business density over the latest decade slightly exceeded the median increase elsewhere, it was not enough to change the city’s long-standing low rank. For example, in Suffolk County, Massachusetts, home to Boston, overall business density grew from 100 to 118 per 1,000 Suffolk County residents. In Denver County, it rose from 142 to 153 per 1,000 Denverites. Nationwide, business density increased from 109 to 129 per 1,000 U.S. residents. (See Figure 1.)
Most of the increase in business density happened between 2017 and 2022, a period that included the early COVID-19 pandemic.5 The pandemic caused sharp spikes in unemployment and business shutdowns, followed by a surge in new businesses.6 The pandemic-related economic shock also prompted a massive infusion of dollars from public agencies and private funders to new and existing businesses—some of it targeted toward minority-owned and female-owned businesses following the 2020 murder of George Floyd.7 Those populations, however, experienced varied business ownership trends across the comparison localities.
Black-owned businesses
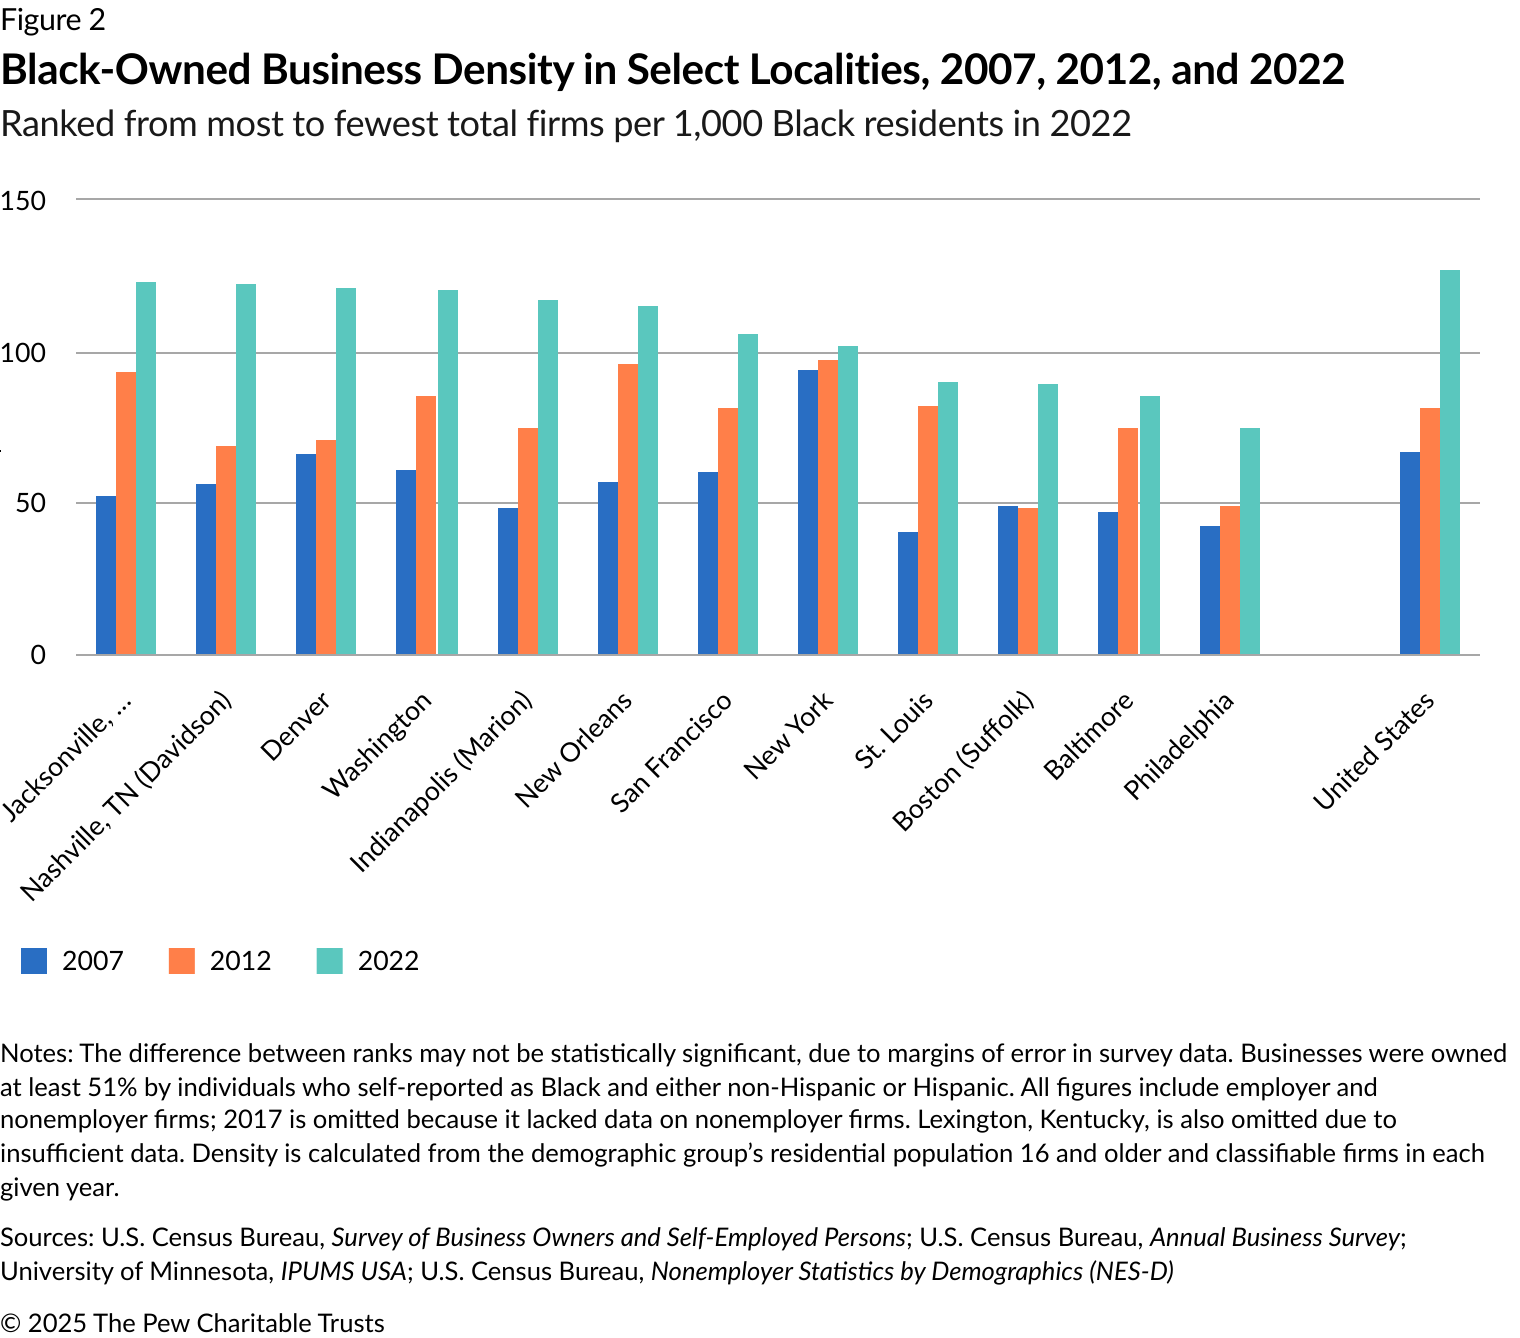
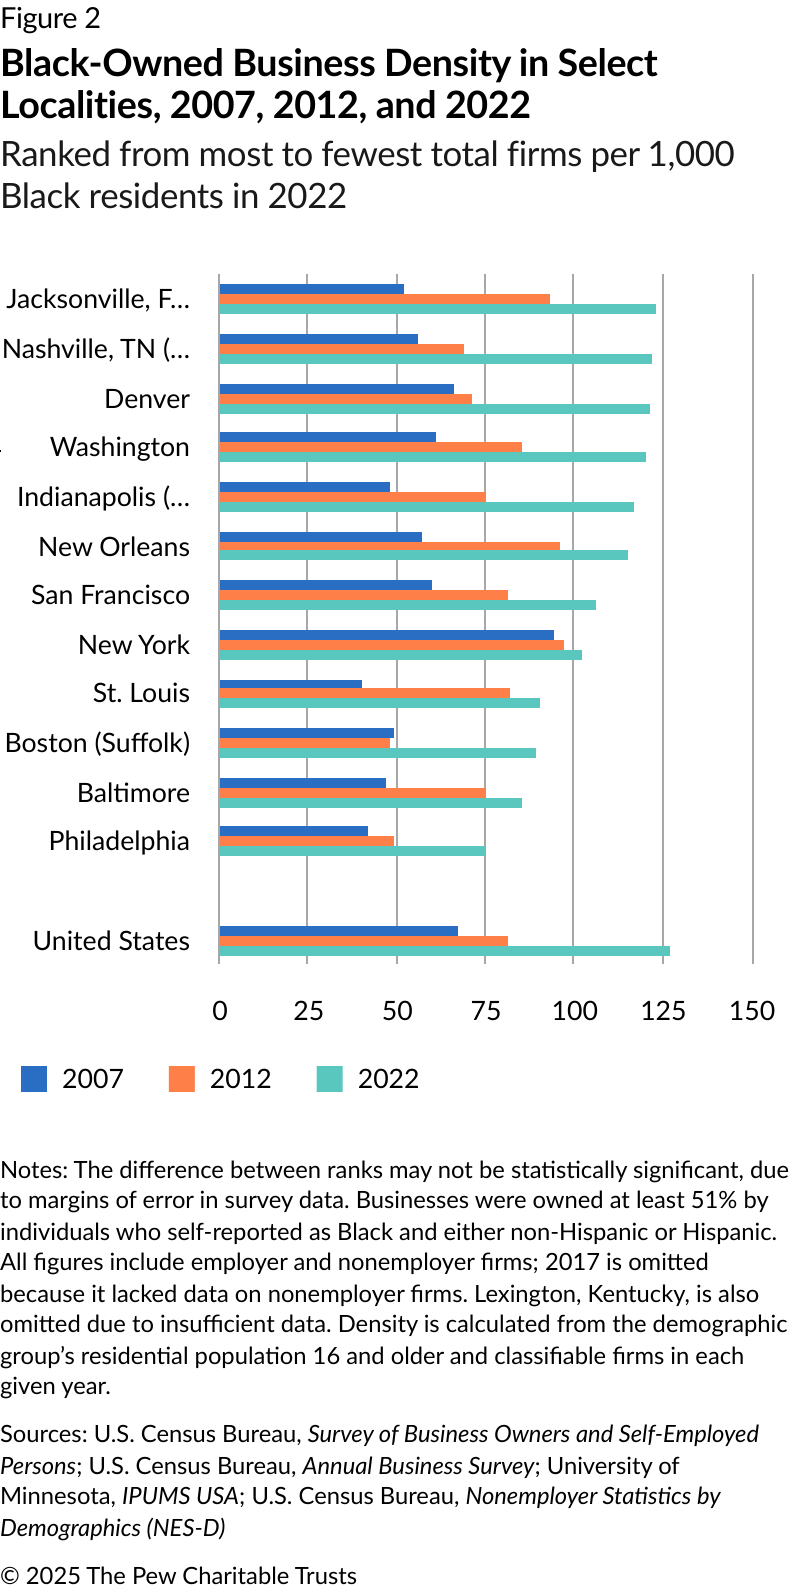
From 2012 to 2022, the number of Black-owned employer firms in Philadelphia grew 73%, from around 1,150 to 1,990, according to the data on ownership classifiable by race, ethnicity, or sex.8 In 2022, these firms equaled 9.2% of all employer businesses, a notable increase from 6.3% a decade earlier. Combined with nonemployer firms, Black-owned businesses made up around 27% of all city firms classifiable by race in 2022. That was slightly higher than a decade earlier but still below Black Philadelphians’ share of the city’s population: They represented 41% of all residents 16 and older in 2022.9 (Importantly, the measure of race in this report includes individuals who identified as multiracial, as well as residents who could be either Hispanic or non-Hispanic. See methodology for details.)
The increase helped lift Philadelphia’s Black business density—counting both employer and nonemployer firms—to its highest total in decades, 75 per 1,000 Black Philadelphians. That was up from 49 in 2012 and 42 in 2007. However, Black business ownership increased even more nationally and in the comparison localities. As a result, Philadelphia’s total Black business density fell further behind the national level and remained last among the comparison localities. (See Figure 2.)
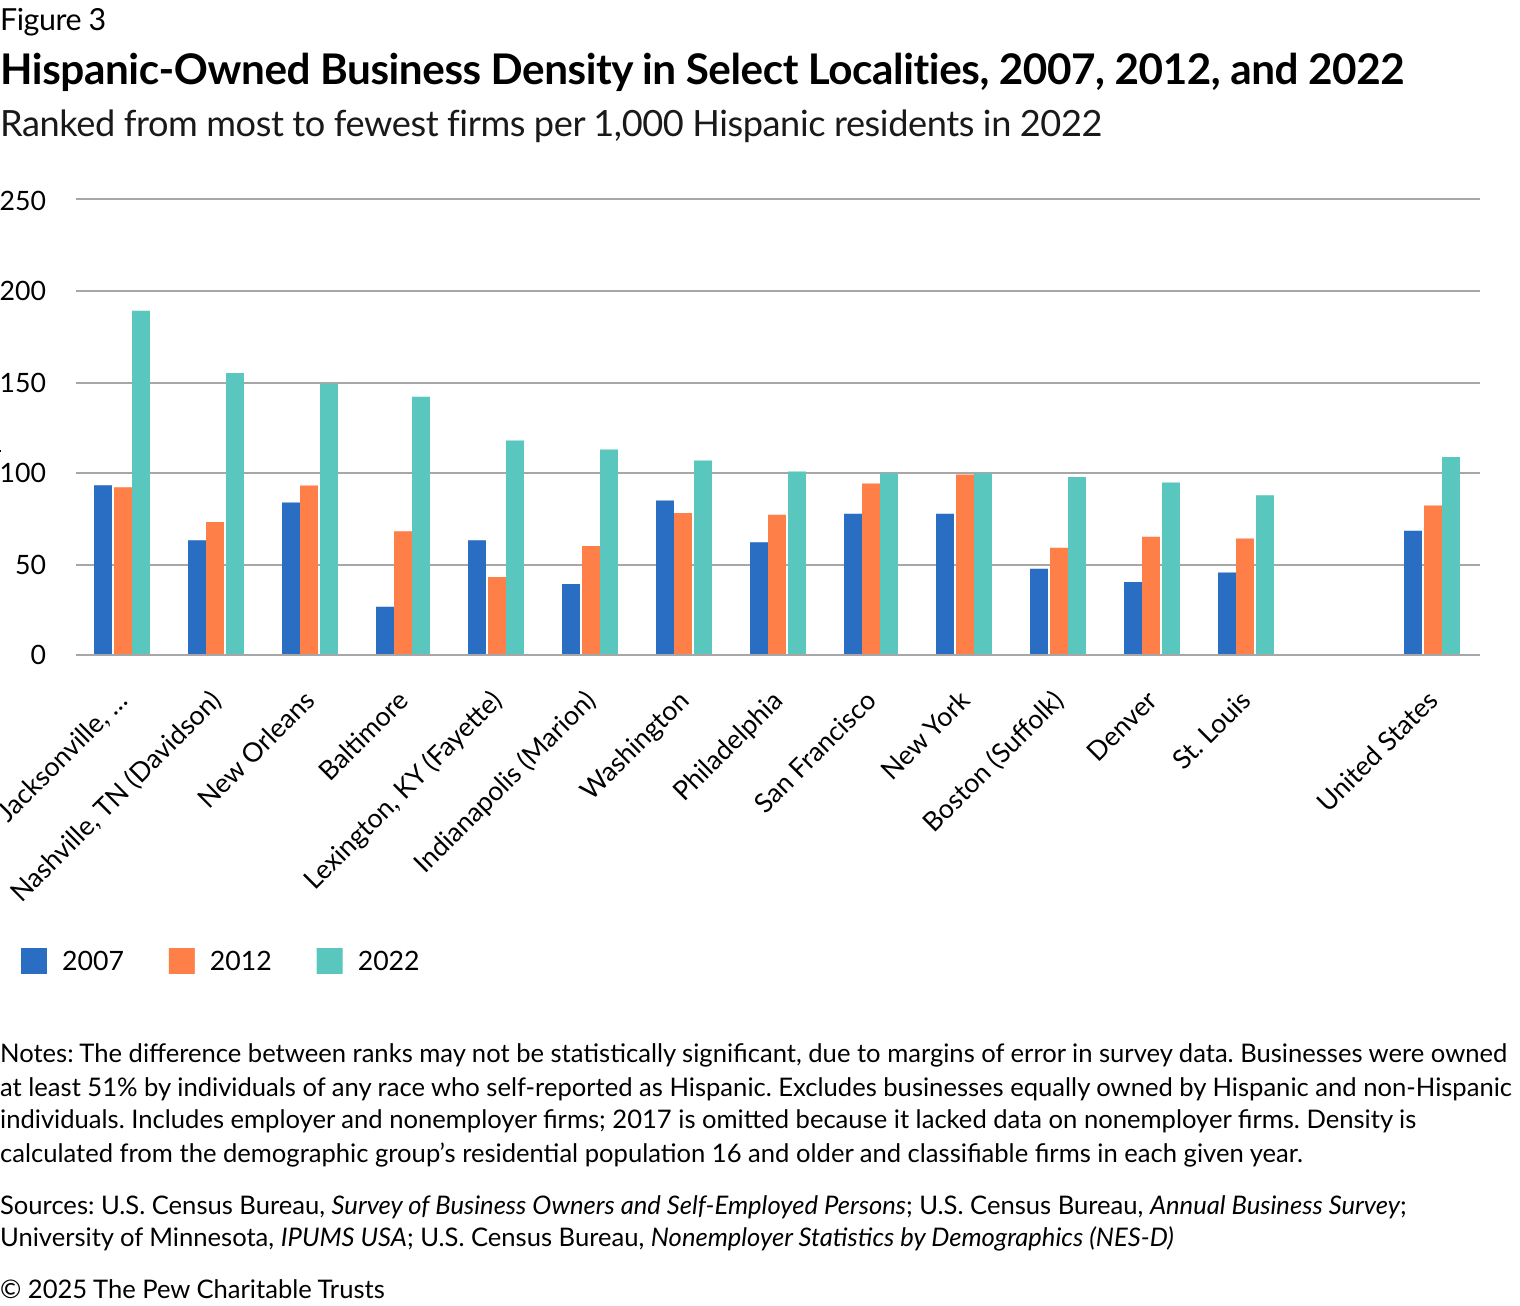
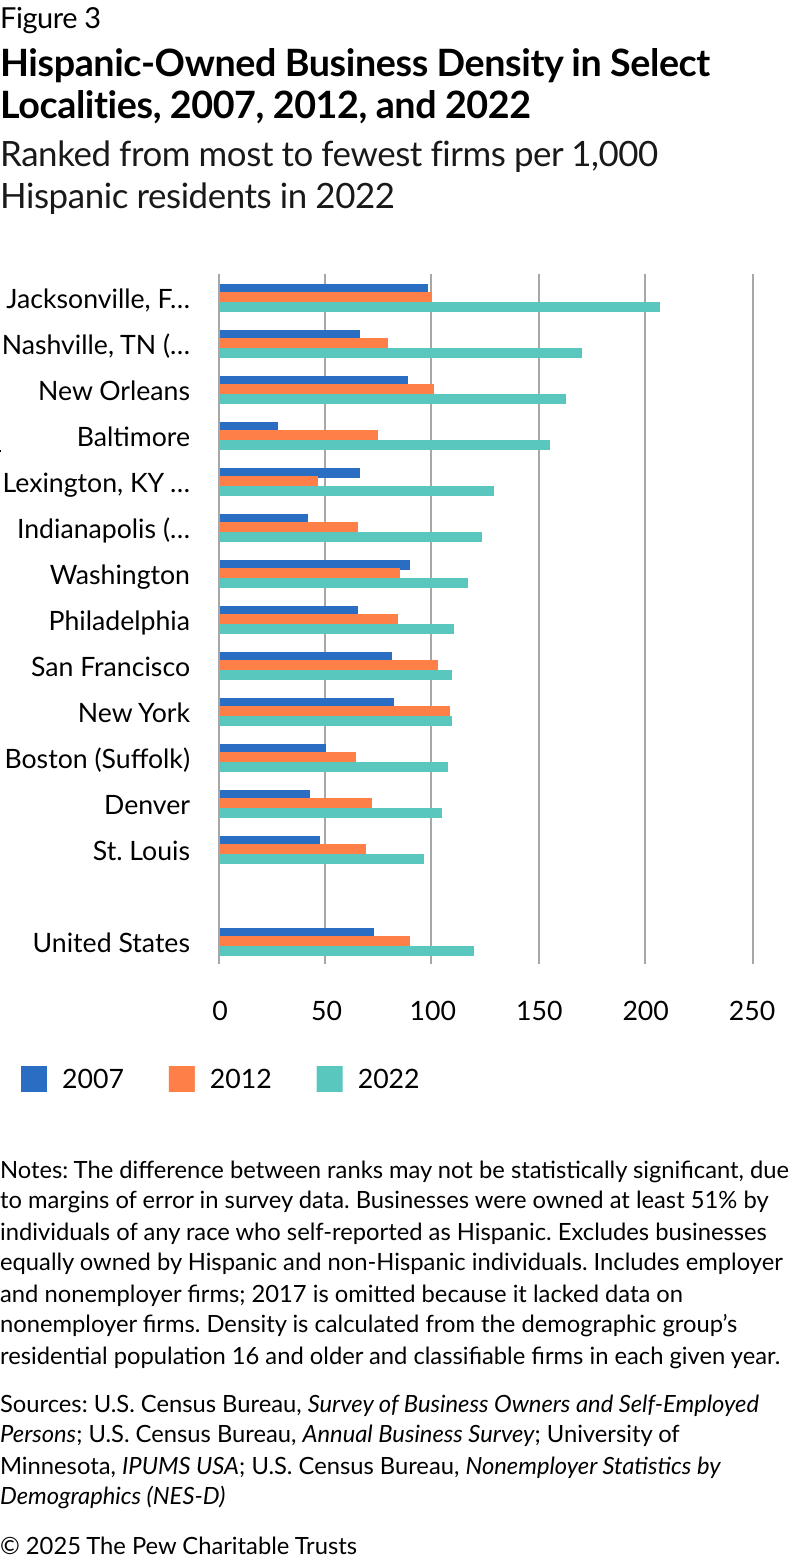
Hispanic-owned businesses
From 2012 to 2022, Hispanic-owned employer firms in Philadelphia rose from around 750 to 1,000, and nonemployer firms from 10,900 to 18,500. Those increases brought Hispanic-owned businesses to 14% of all Philadelphia businesses by ethnicity, which matched their 14% share of the city’s 16-and-older population in 2022. (Importantly, this measure of Hispanic ethnicity includes individuals of any race. See methodology for details.)
The increases also raised the Hispanic community’s business density—counting both employer and nonemployer firms—from 84 to 110 firms per 1,000 Hispanic Philadelphians. That increase roughly mirrored the gain in other localities and kept Philadelphia’s Hispanic business density around midpoint among them, although still slightly below the national level. (See Figure 3.)
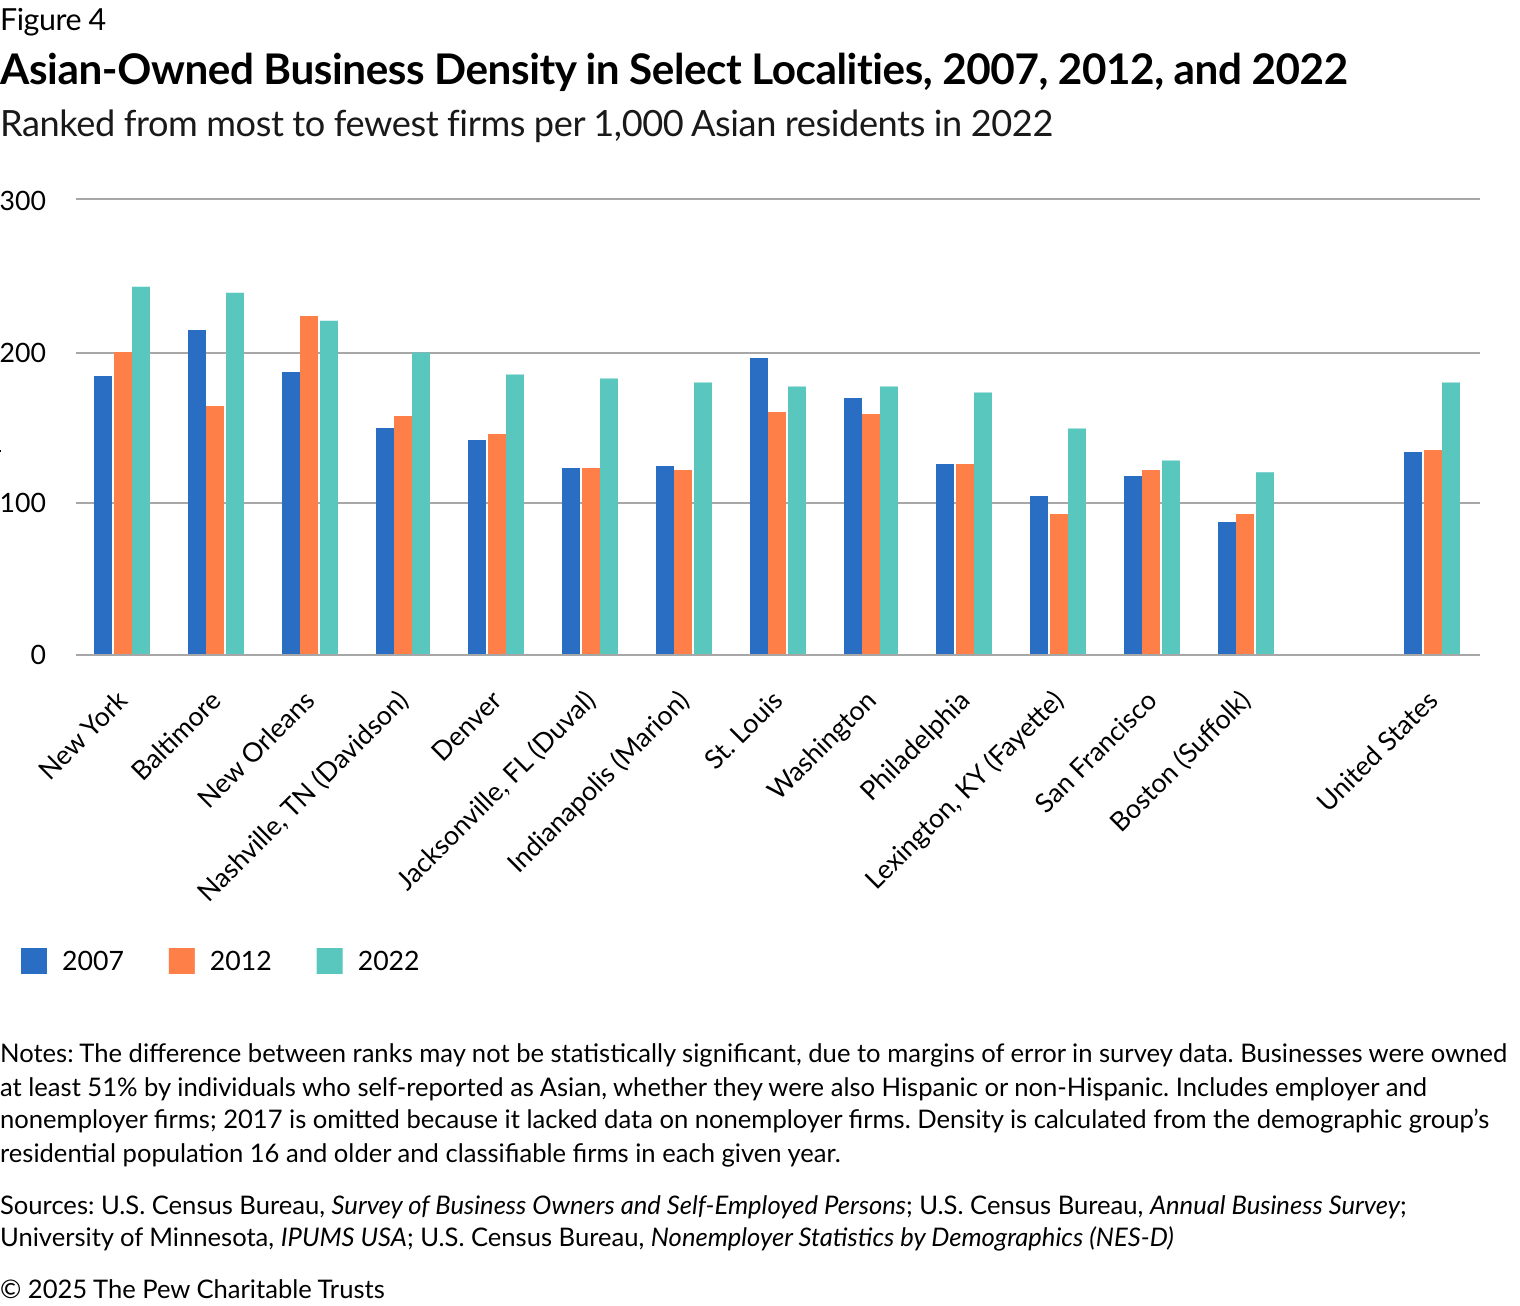
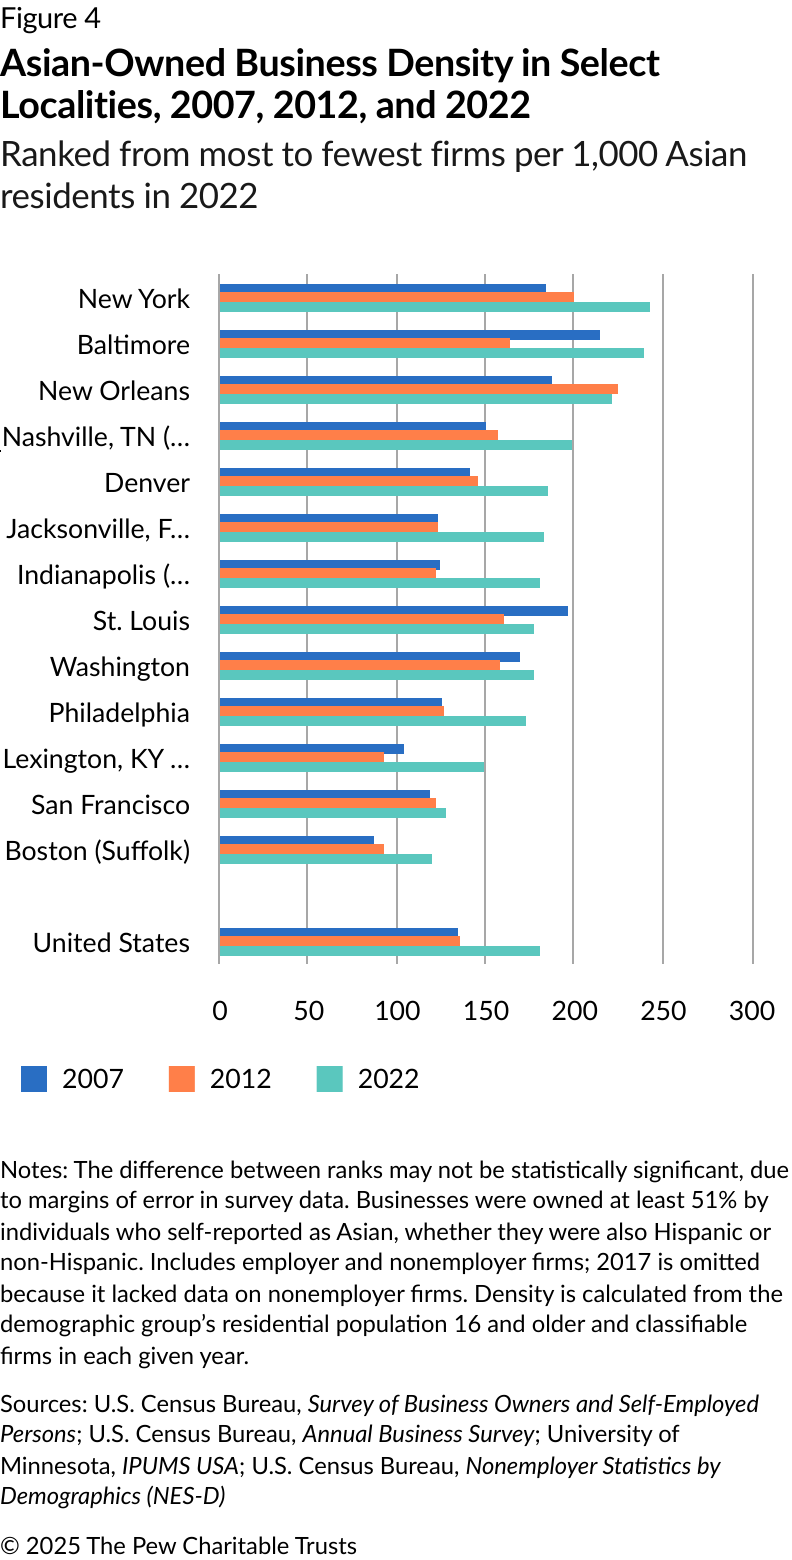
Asian-owned businesses
In a similar pattern to that seen with other demographic groups, from 2012 to 2022, the number of Asian-owned employer firms in Philadelphia rose from around 3,460 to 4,640, and nonemployer firms from around 8,070 to 15,500, for a total of 14% of all city businesses by race in 2022. That was well above Asian Philadelphians’ 9% share of the city’s 16-and-older population.
Counting both firm types, Asian business density rose over the decade from 126 to 173 per 1,000 Asian Philadelphians. That essentially mirrored the national increase and left Asian Philadelphians in the bottom half of comparison localities. (See Figure 4.)
White-owned businesses
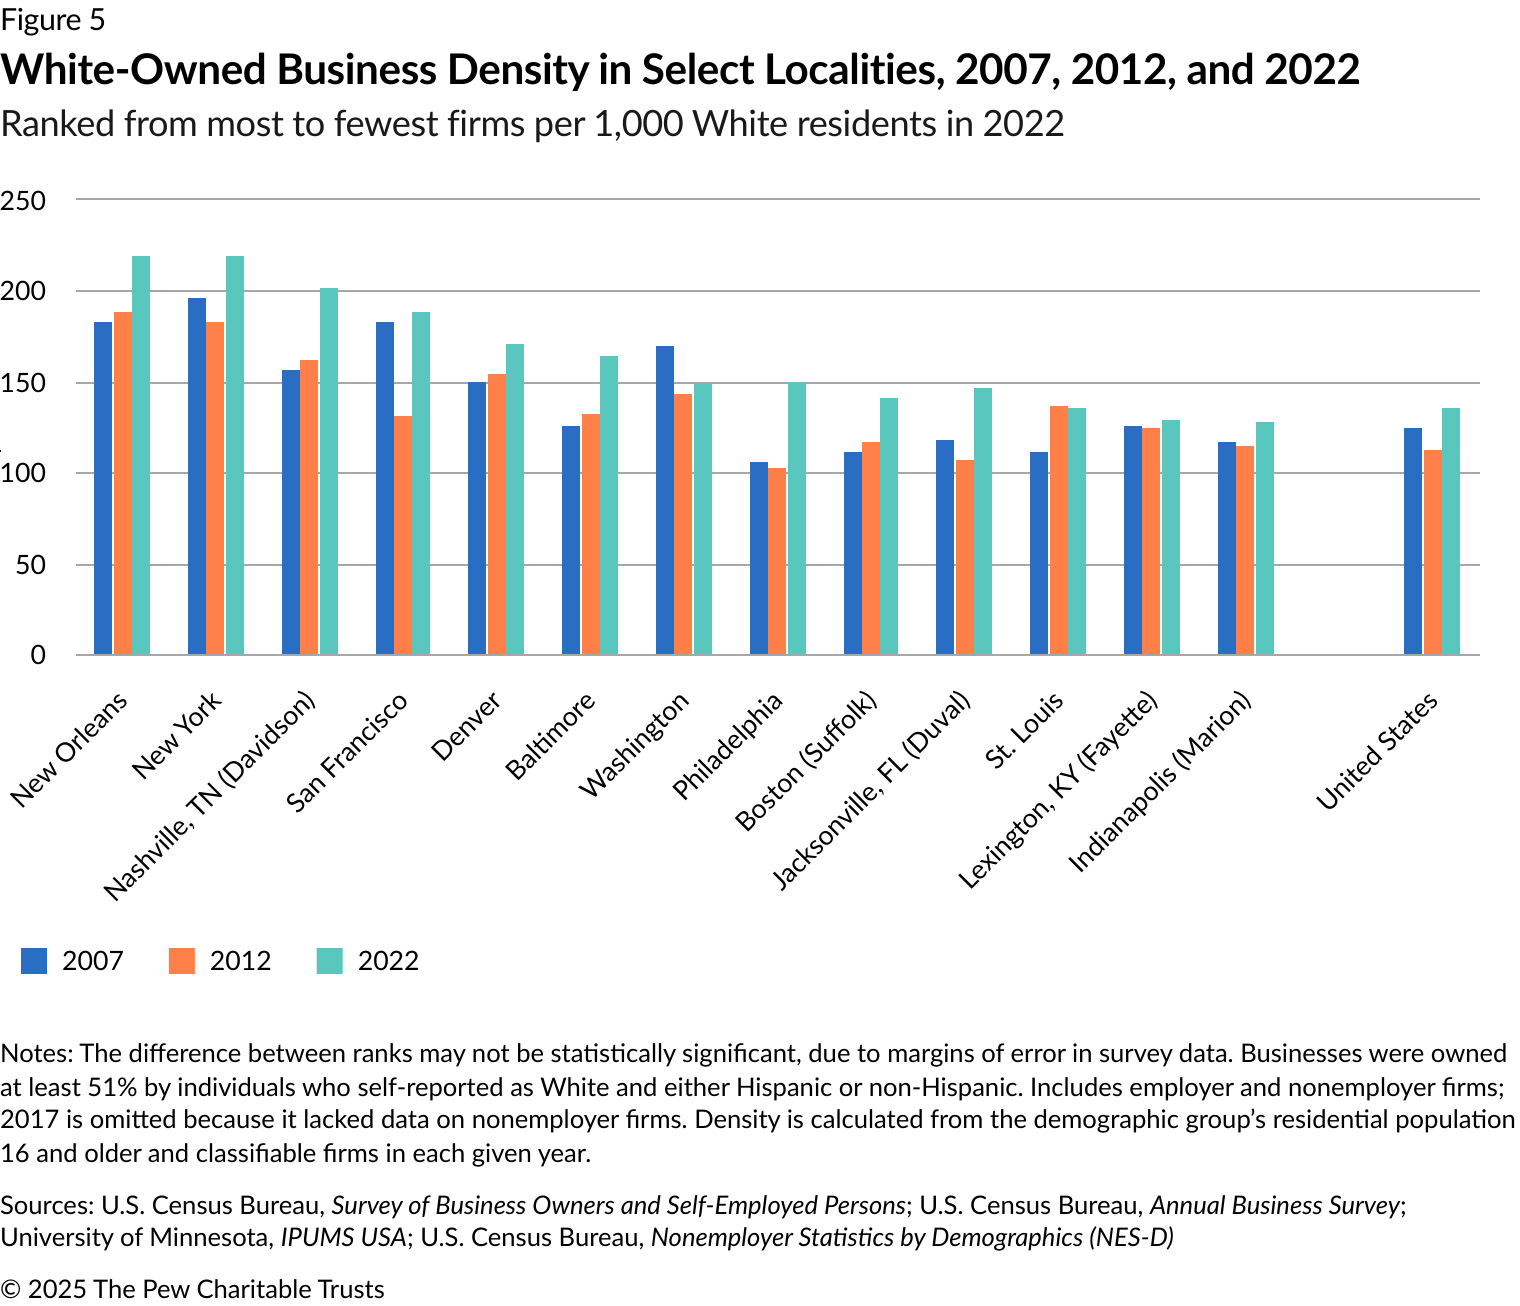
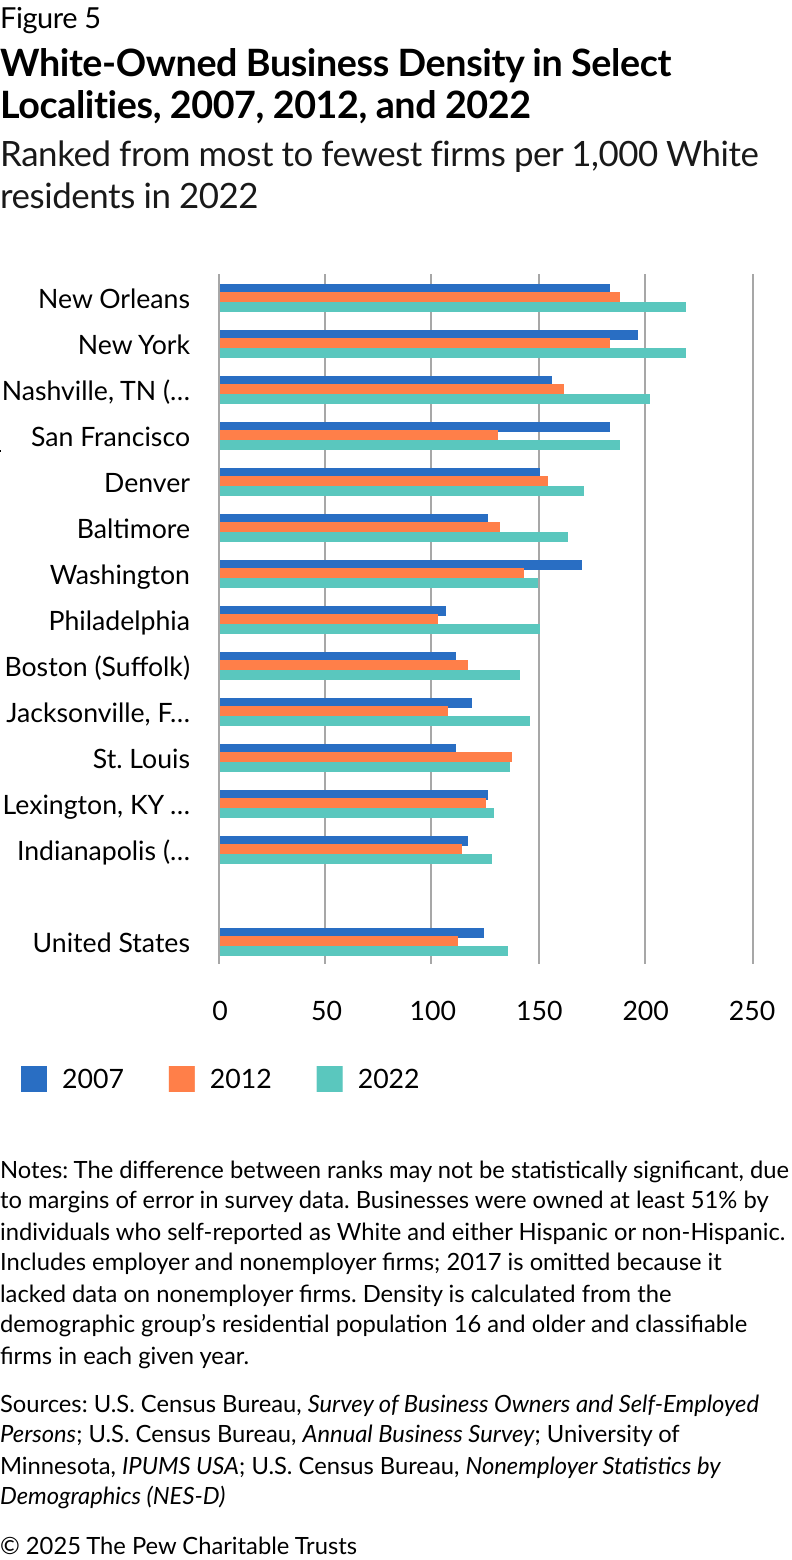
Growth in the density of Philadelphia’s White-owned businesses exceeded that of many other places.
In 2022, there were around 14,880 White-owned employer firms and 67,500 nonemployer firms, equaling 58% of all Philadelphia businesses by race, exceeding their 46% of the total 16-and-older population. Counting both types of firms, White business density rose from 102 in 2012 to 150 in 2022. That moved White Philadelphians from below to above the national average in business density and from bottom to midpoint among the localities. (See Figure 5.)
Female-owned businesses
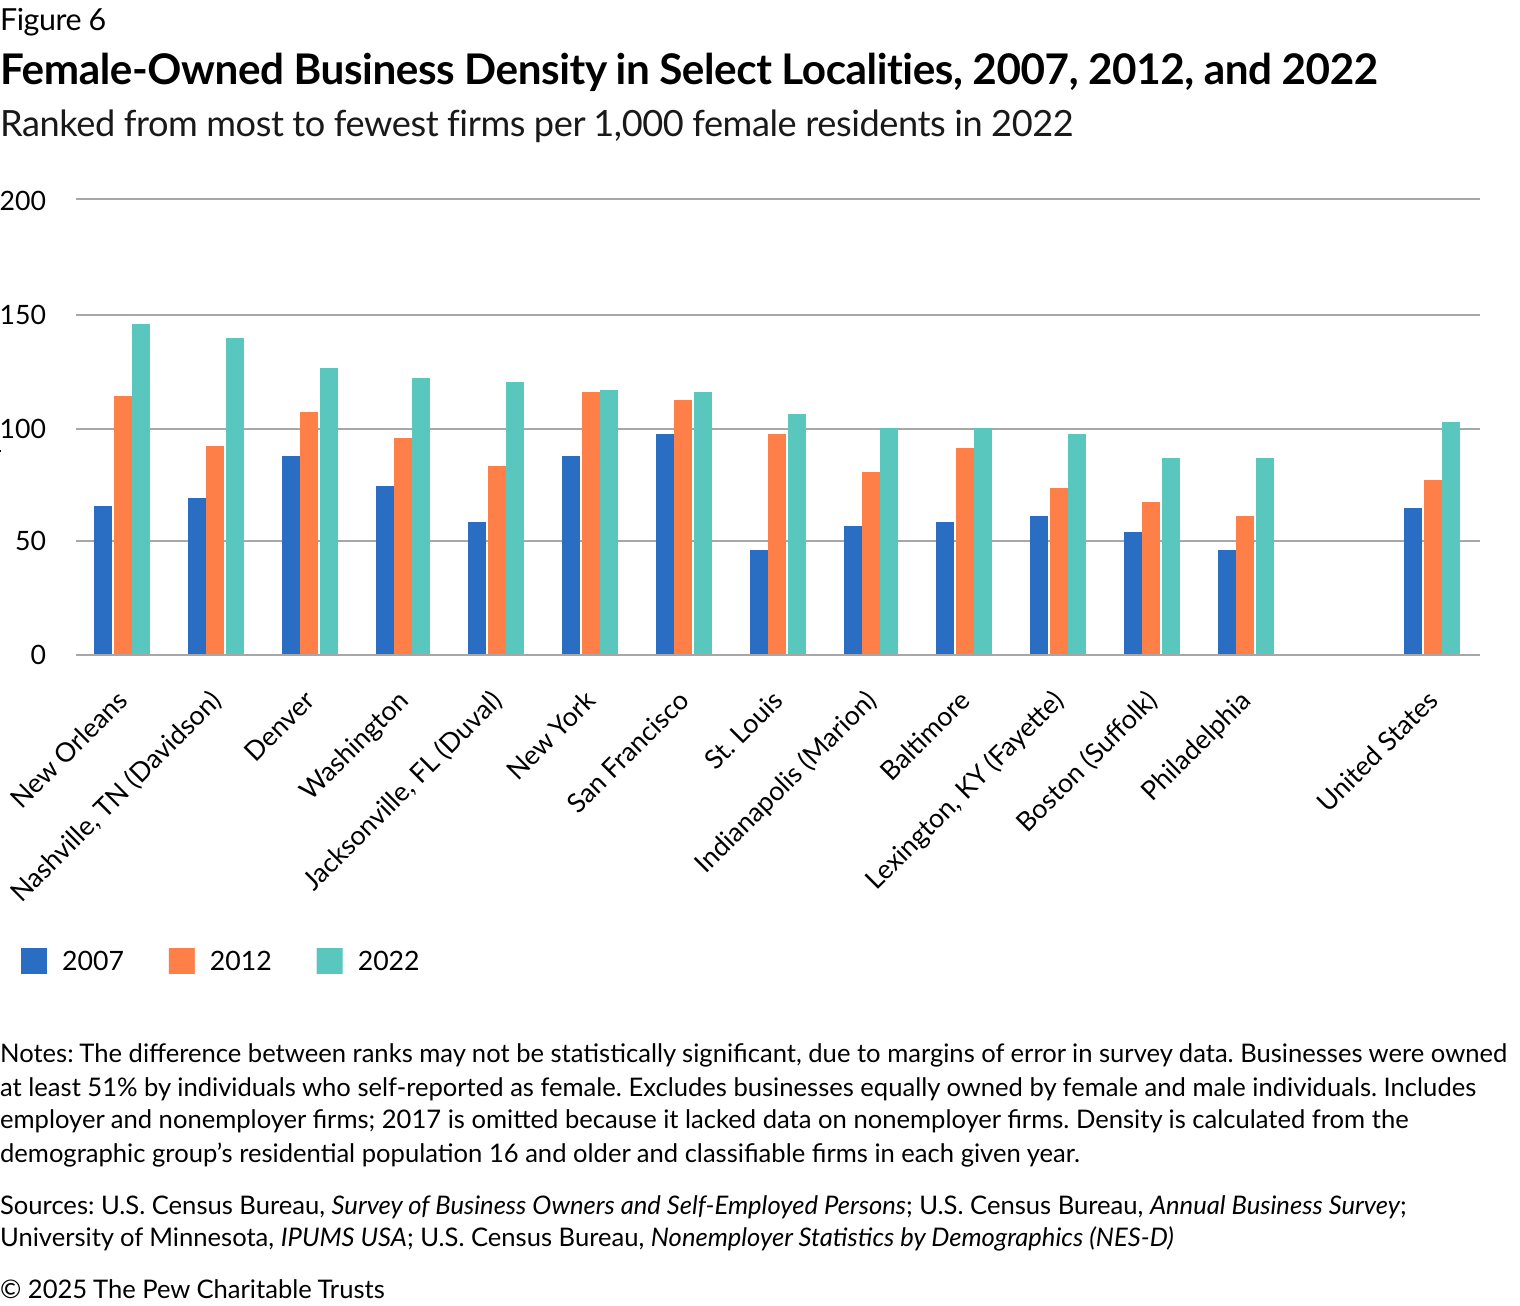
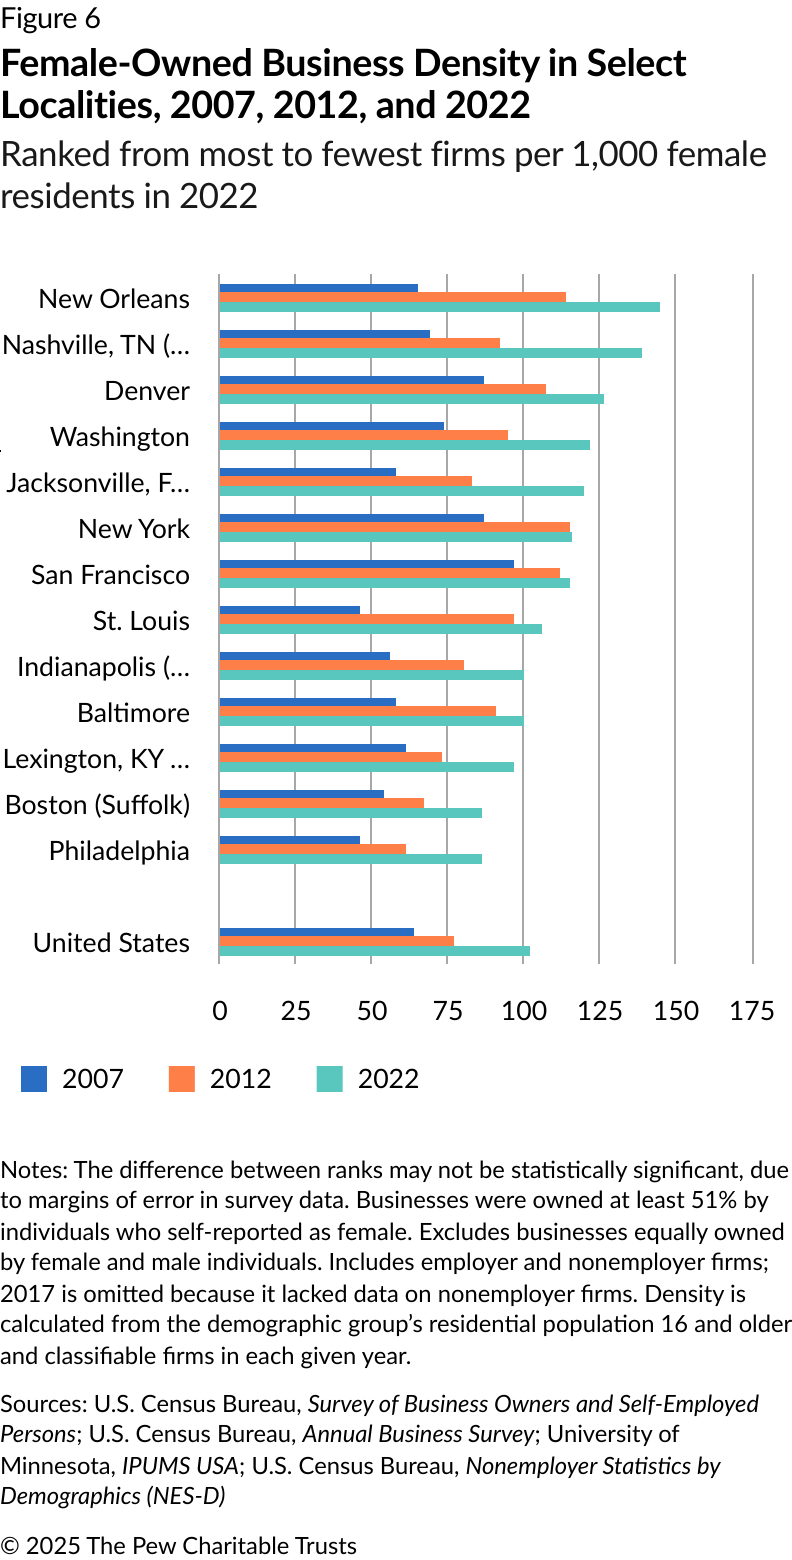
The number of female-owned businesses in Philadelphia grew slightly faster than their peers elsewhere, but not enough to change their statistical ranking by 2022. They numbered around 5,340 employer firms and 53,000 nonemployer firms in 2022, totaling 42% of all businesses by biological sex.10 That was lower than the 54% of the 16-and-older population that women represented. Counting both employers and nonemployers, female-owned business density went from 61 to 86 firms over the decade. But their peers also grew over the period, leaving Philadelphia ranked at the bottom in density in 2022. (See Figure 6.)
Male-owned businesses
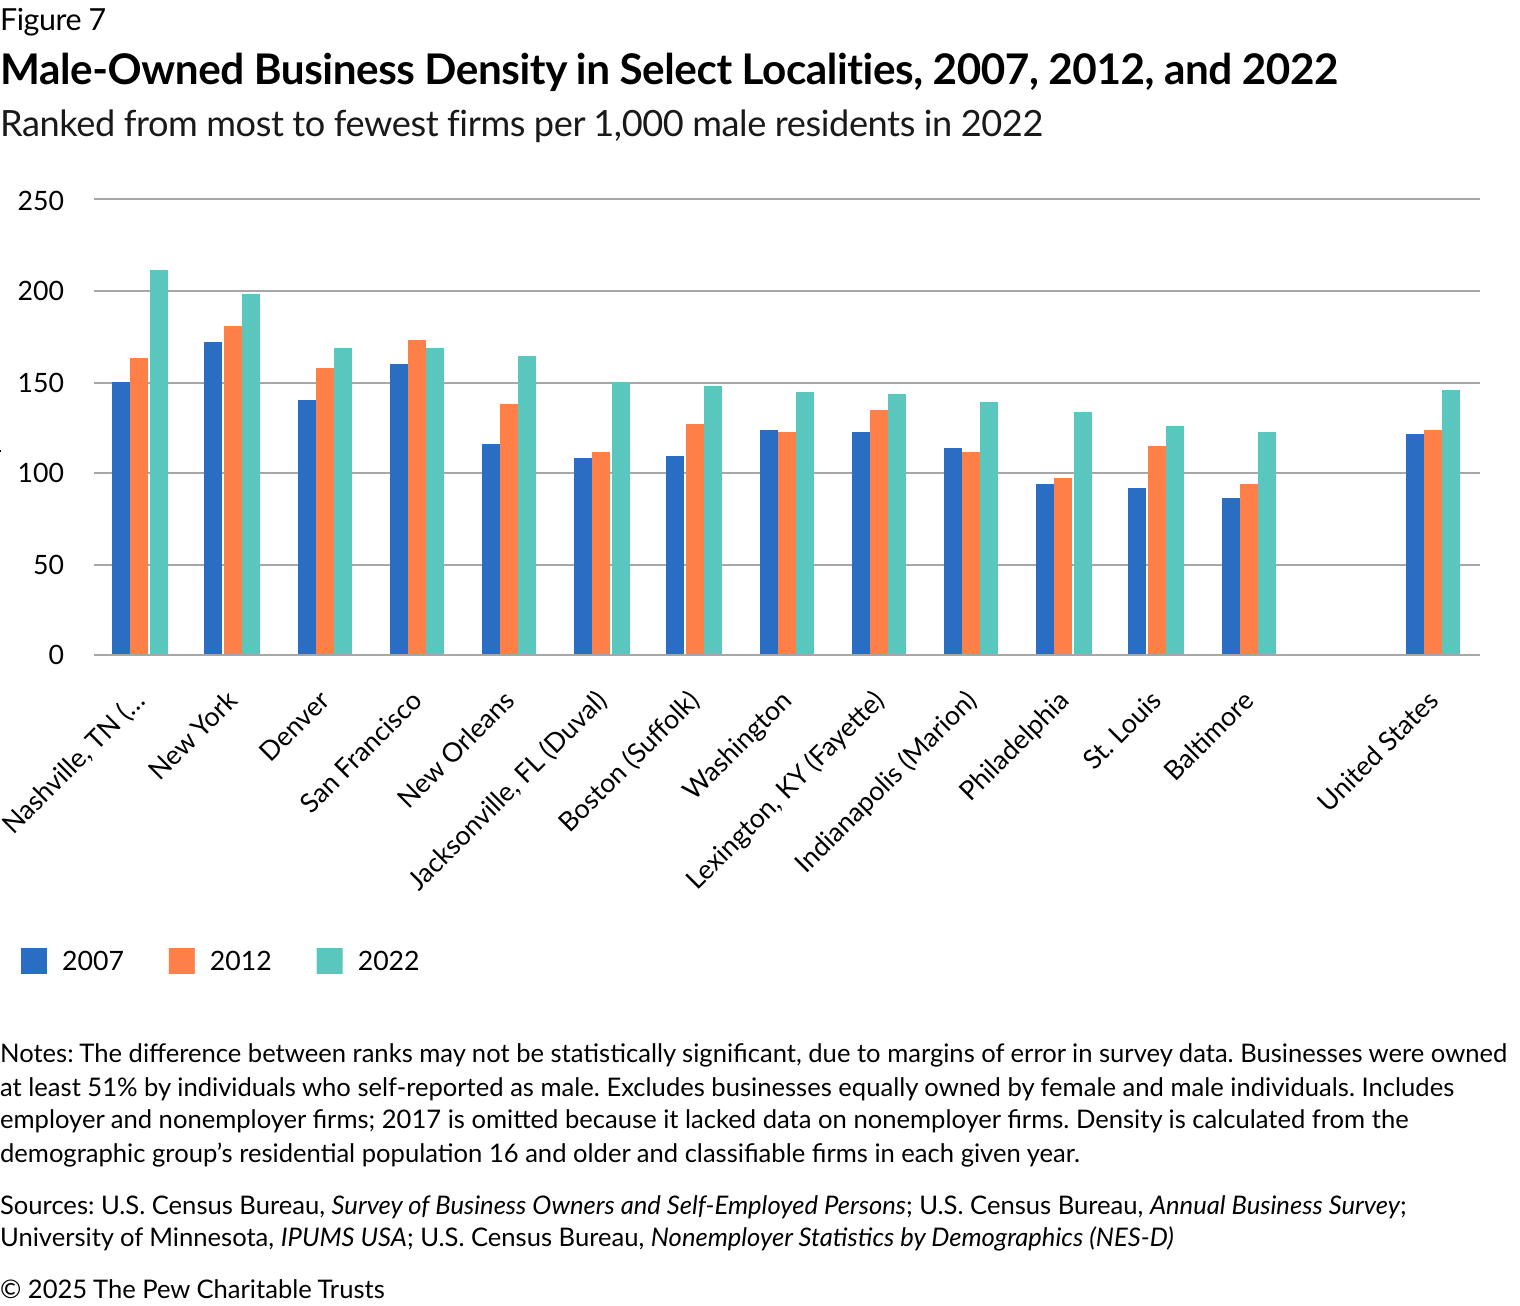
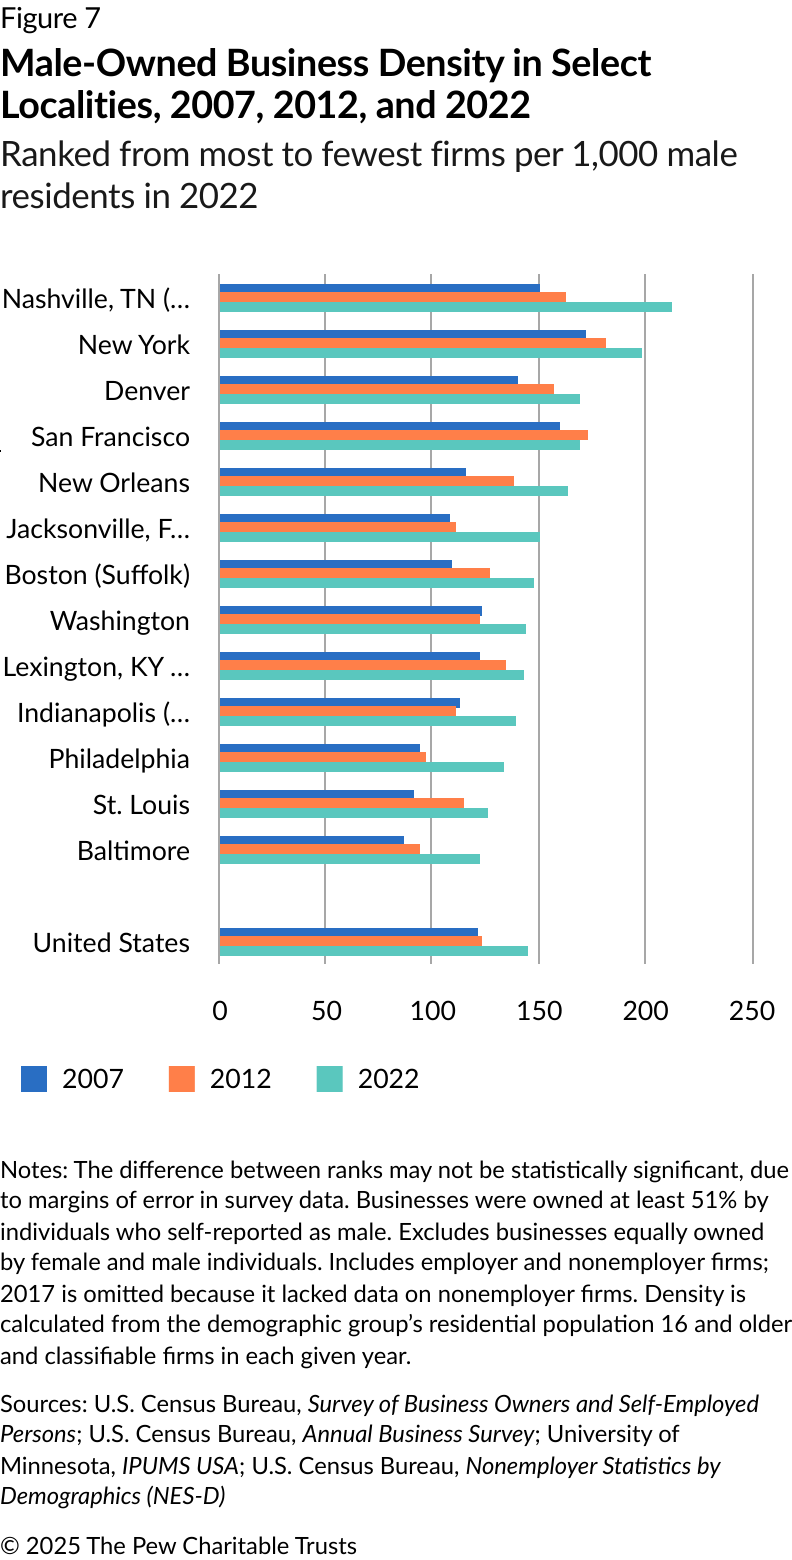
Male-owned businesses also grew slightly faster in Philadelphia than elsewhere from 2012 to 2022, but not enough to change their ranking. They reached nearly 14,440 employer businesses and 64,000 nonemployer firms in 2022. That was 56% of all businesses by biological sex, above the 46% of the 16-and-older population that men represented in Philadelphia. That gain over the decade raised business density to 133 firms per 1,000 male Philadelphians, which only slightly narrowed the gap with other localities and with the national average. (See Figure 7.)
Nonemployer businesses
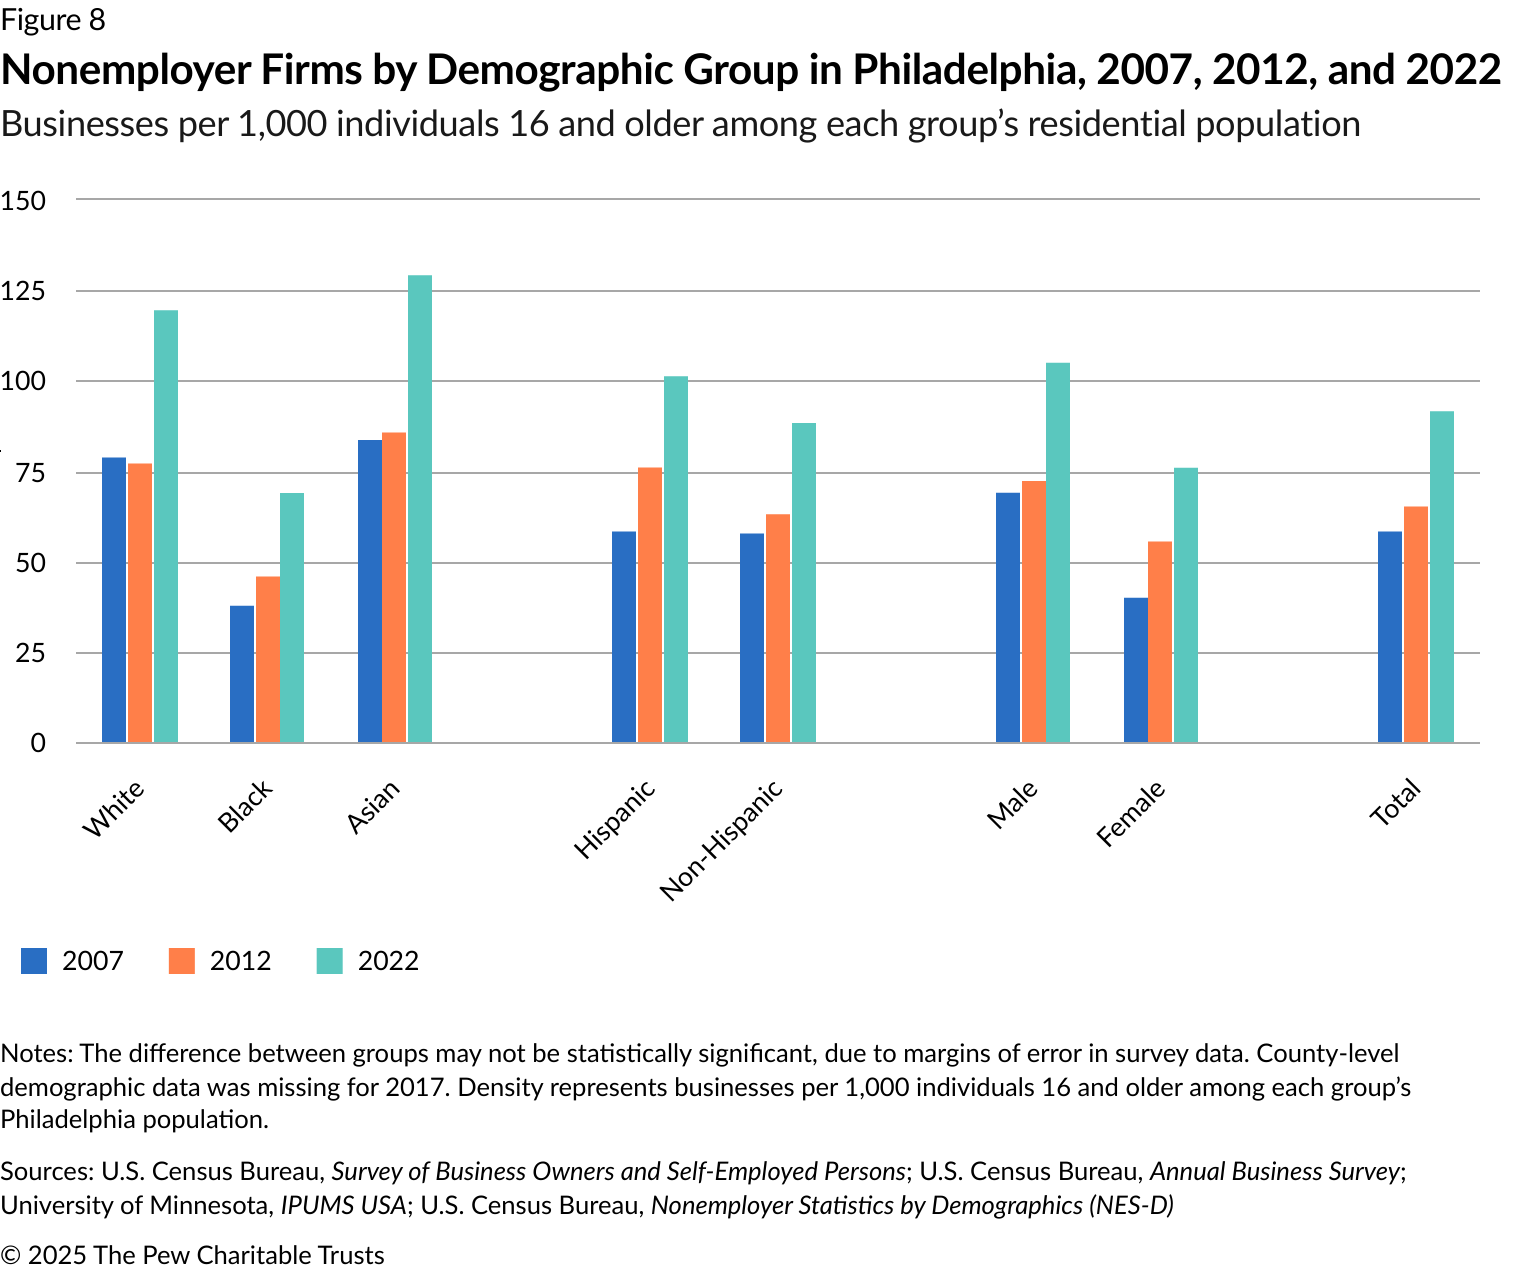
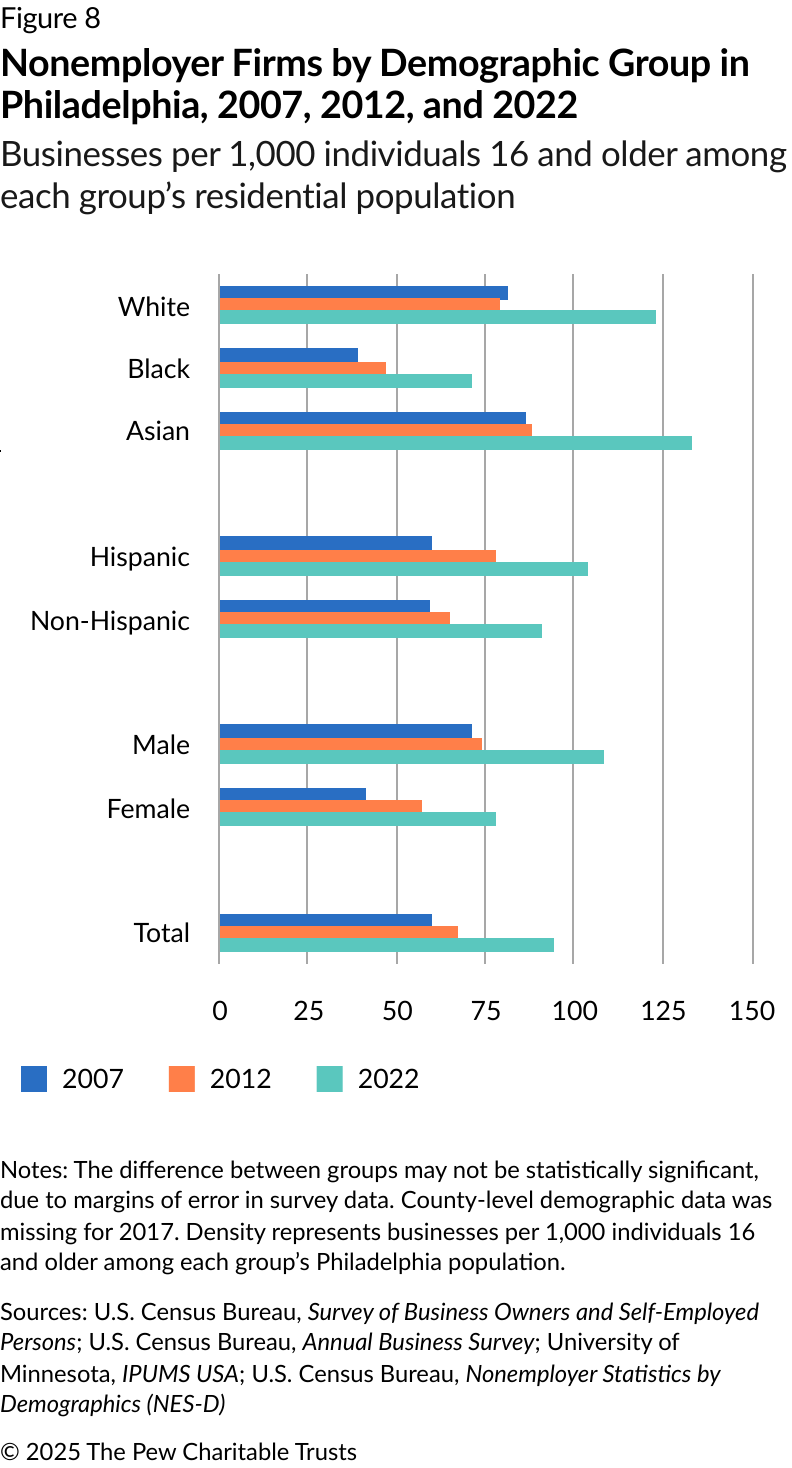
Businesses in Philadelphia without any employees—such as individual entrepreneurs, contractors, freelancers, gig workers, and various types of holding companies—drove most of the growth in business ownership by each demographic group from 2012 to 2022. (See Figure 8.) Job-creating firms with workers, meanwhile, grew just slightly over the period.
The pandemic-related surge in nonemployer businesses was noteworthy in a decades-long nationwide shift away from traditional employment.11 Economists, policymakers, labor leaders, and business leaders have studied the trend and its implications for labor supply and economic growth beyond the individual business owners.12
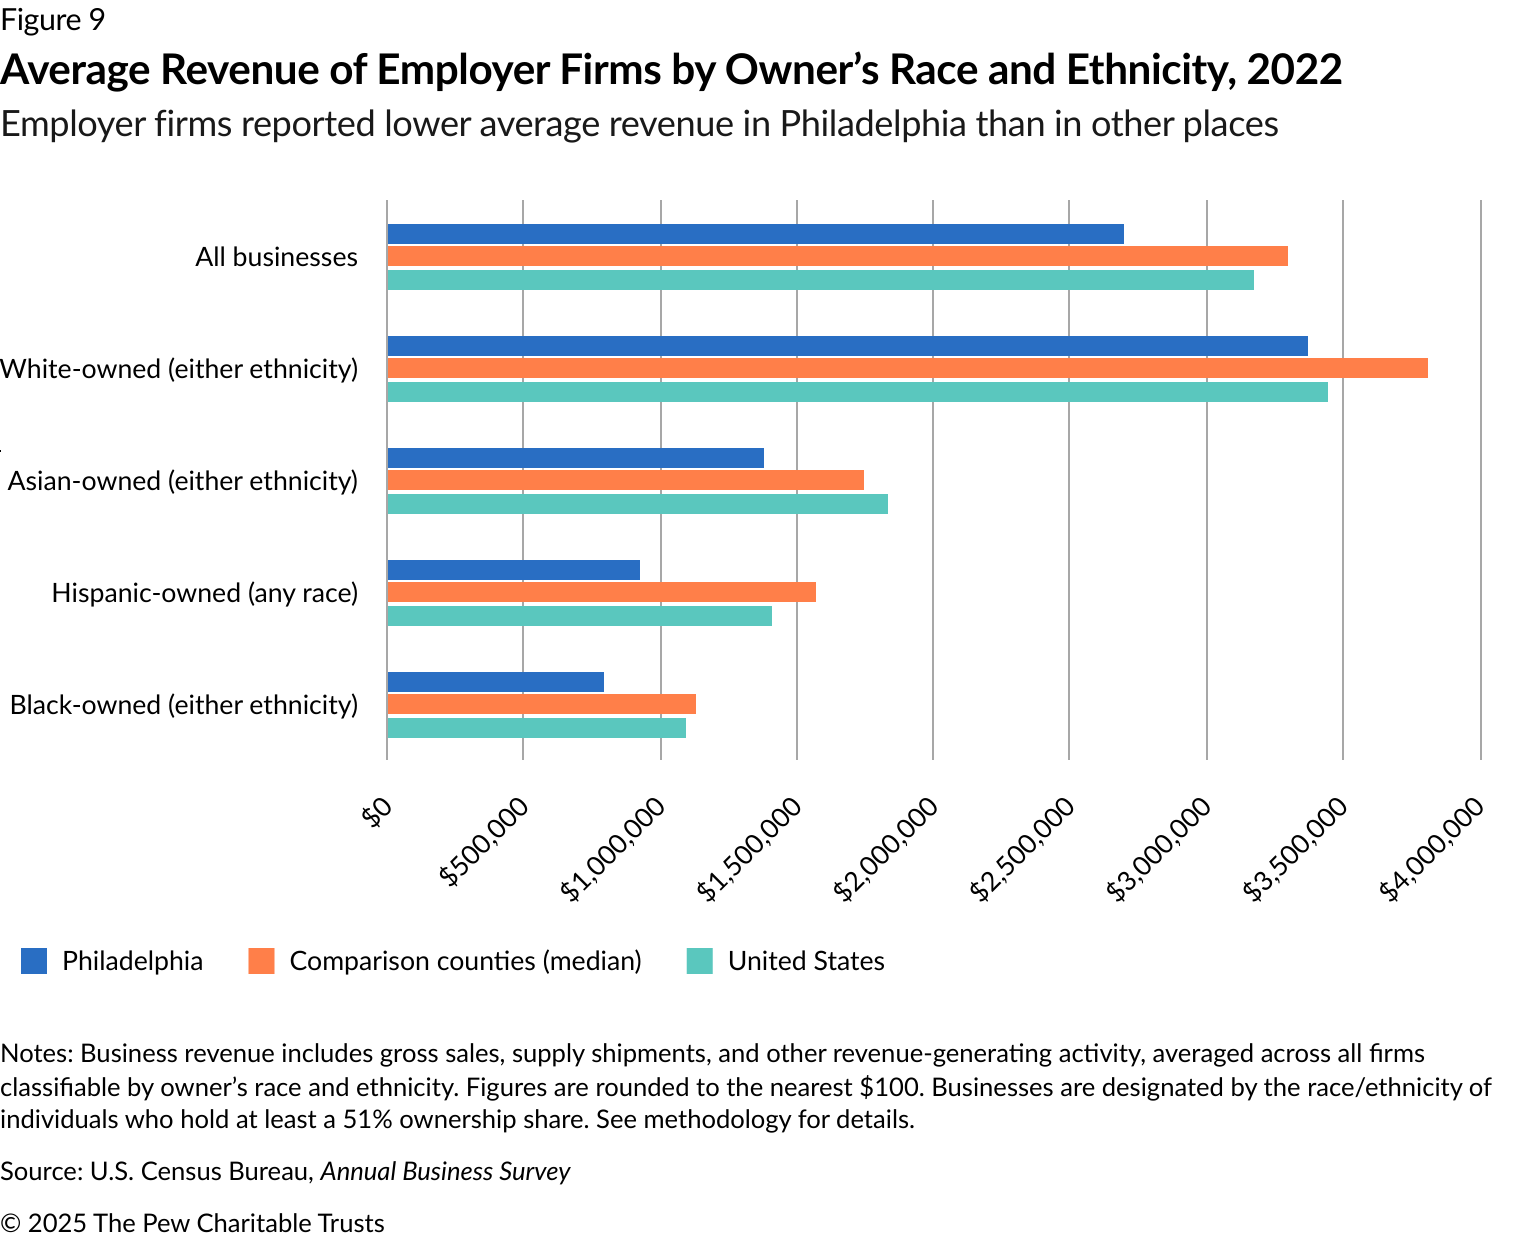
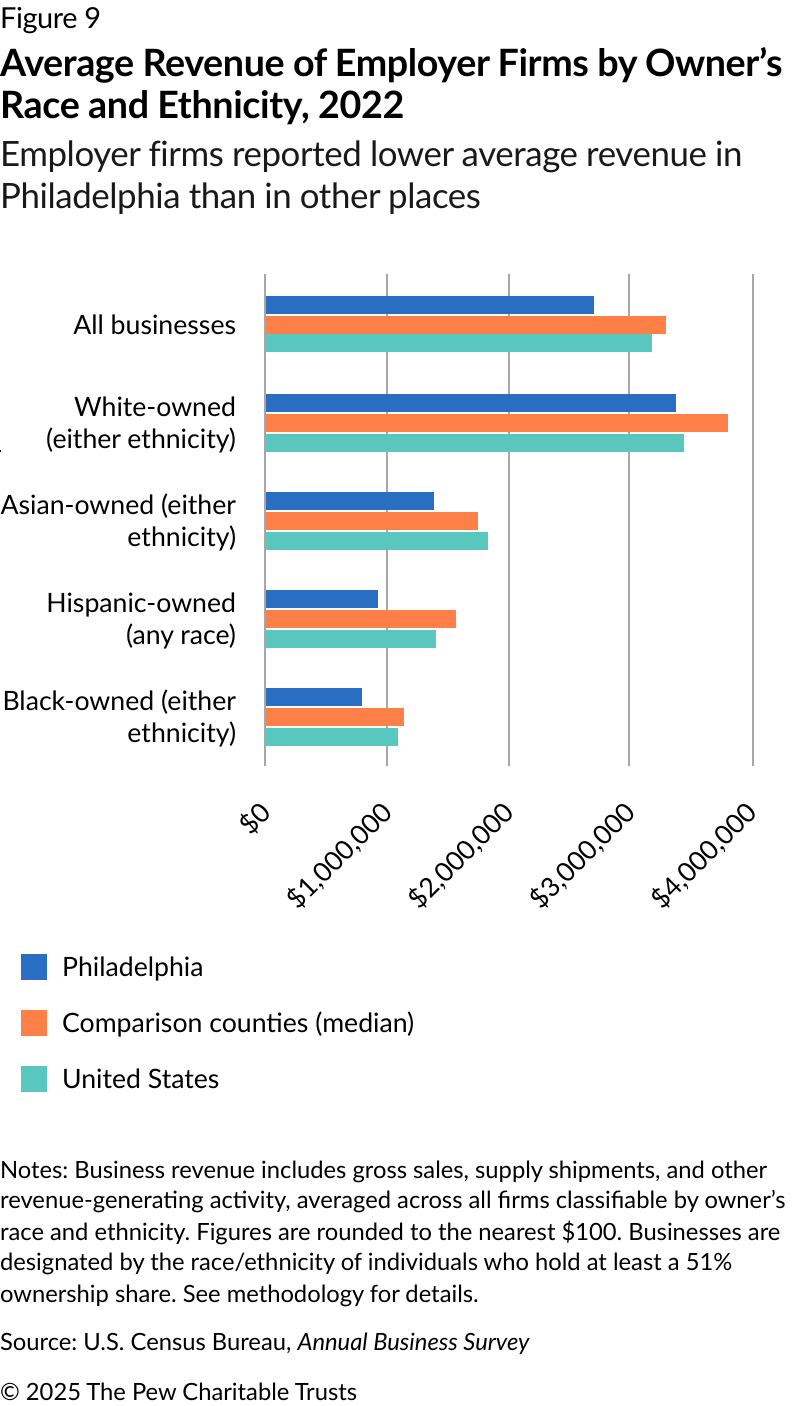
Business revenue by owner race and ethnicity
The revenue that businesses generated for their owners also differed starkly between groups and from one locality to another. For instance, in 2022, Philadelphia’s 1,990 Black-owned employer businesses reported an average of $792,500 in gross revenue from sales and other activities, 30% below the median of their peers in the comparison localities. The city’s 1,000 Hispanic-owned employer businesses reported an average $921,100 in gross revenue, which was 41% below the median of their peers. Philadelphia’s Asian-owned businesses reported 21% less revenue and White-owned businesses 12% less, on average, than their peers elsewhere. (See Figure 9.)
Observations

There are many possible reasons why localities’ business density would differ, although it was beyond the scope of this report to pinpoint the role of each factor statistically. More research is needed into the reasons, which could include differences in the industry mix between localities or because some sectors—such as food or retail—tend to spawn more classifiable firms than, say, health care and education. Or the difference in business density may result from different concentrations of small for-profit firms versus large corporations and nonprofit institutions, since the latter don’t have individual owners classifiable by race or sex. Those industry mixes and business structures, in turn, could be affected by business taxation, regulations, and commercial zoning environments in each place.
Even more complex are the differences in Black, White, Asian, Hispanic, male, and female ownership among localities. For example, Philadelphia’s female-owned business density was far below male-owned business density in the city, but it was also far below female-owned density in New Orleans, Nashville, and Denver. Census data shows that female residents of those localities had higher levels of attributes often linked to business ownership, such as educational attainment and median earnings, than women in Philadelphia did.13
Conclusion
The decade from 2012 to 2022—particularly the last five years of that period, during the early COVID-19 pandemic—saw a striking increase in business density nationwide and in select localities, including Philadelphia. Ownership by Black, Hispanic, Asian, White, female, and male individuals rose along with the national average, but gains varied from locality to locality. Nonemployer firms drove most of the increase for all groups.

The density of Black-owned businesses—both employer and nonemployer—grew in Philadelphia, but at a slower pace than elsewhere, widening the gap with comparison localities and the nation overall. The density of the city’s Hispanic-, White-, and Asian-owned businesses, on the other hand, slightly exceeded the growth elsewhere, narrowing the gap with other places, although they mostly remained low in density. Philadelphia’s female- and male-owned firms mostly matched the increases seen elsewhere and remained at the same relatively low density.
The findings beg the question of how a city’s business density may reflect its distinct demographic makeup, economic conditions, and level of business ownership, which is a major contributor to economic mobility for many individuals and families.
Endnotes
- Ying Lowrey, “Business Density, Entrepreneurship, and Economic Well-Being,” Office of Advocacy, U.S. Small Business Administration, 2005, https://papers.ssrn.com/sol3/papers.cfm?abstract_id=744804.
- This report uses “firm”—which the U.S. Census Bureau defines as a business organization consisting of one or more domestic establishments under common ownership or control—as the unit of measurement. A firm differs from an establishment, which is a single physical location owned or operated by a firm. Most figures in this report are based on firms whose individual owners were identifiable and classifiable by race, ethnicity, or sex, which typically excludes large corporations, nonprofits, companies, and government-owned companies.
- The U.S. Census Bureau’s Annual Business Survey seeks to measure all businesses except those with gross receipts under $1,000 per year and those operating in public administration, nonprofit religious and civic services, rail transportation, and certain other sectors. See “Annual Business Survey Methodology,” U.S. Census Bureau, https://www.census.gov/programs-surveys/abs/technical-documentation/methodology.html.
- “Survey of Business Owners and Self-Employed Persons,” U.S. Census Bureau, https://www.census.gov/programs-surveys/sbo.html. The federal government merged this survey and others into the Annual Business Survey as of 2017.
- The Census Bureau publishes data on racial, ethnic, and sex characteristics of employer and nonemployer firms at the county level only on years ending in 2 and 7. One exception was the 2017 census data, which did not include nonemployer firms.
- Ryan A. Decker and John Haltiwanger, “Surging Business Formation in the Pandemic: A Brief Update,” University of Maryland, 2024, https://rdeckernet.github.io/website/DH_businessformation_update.pdf.
- Andre M. Perry, Hannah Stephens, and Manann Donoghoe, “Driving Prosperity: How Black-Owned Businesses Fueled Recent Economic Growth,” Brookings Institution, Feb. 19, 2025, https://www.brookings.edu/articles/driving-prosperity-how-black-owned-businesses-fueled-recent-economic-growth/.
- This report uses the U.S. Census Bureau’s definition of ownership characteristics, which is based on the race, ethnicity, or sex of individuals who hold at least 51% of the ownership stake. That makes them the majority owners, although this report uses just the terms “owned” or “ownership.” The Census Bureau allows owners to identify their biological or anatomical sex—female or male—and not their gender. The bureau provides data on firms equally owned by male and female individuals, and by Hispanic and non-Hispanic individuals, but those figures have been excluded to simplify this analysis.
- The Pew Charitable Trusts’ analysis of 2022 one-year estimates from “IPUMS USA,” University of Minnesota, https://usa.ipums.org/usa/.
- The U.S. Census Bureau, in its surveys and decennial headcounts, asks respondents only about their sex based on biological attributes such as chromosomes and anatomy, not about their gender. “Glossary: Sex,” U.S. Census Bureau, https://www.census.gov/glossary/?term=Sex.
- Travis Shoemaker, “Number of U.S. Nonemployers Grew Faster Than Employer Businesses Nearly Every Year From 2012 to 2023,” U.S. Census Bureau, 2025, https://www.census.gov/library/stories/2025/07/nonemployer-business-growth.html. Adam Grundy and Lucie Alleyne, “Nonemployer Businesses Are Key Contributors to Gig Activities and Economic Growth Nationally,” U.S. Census Bureau, 2025, https://www.census.gov/library/stories/2025/07/nes-gig-economy.html.
- Pedro Bento and Diego Restuccia, “The Role of Nonemployers in Business Dynamism and Aggregate Productivity,” Journal of Political Economy Macroeconomics 3, no. 2 (June 2025): https://www.journals.uchicago.edu/doi/full/10.1086/735032.
- “IPUMS USA,” University of Minnesota.
People


