Port State Measures Agreement Implementation Improves, Reducing Opportunities for Illegally Caught Fish to Enter Market
Bad actors still target ports with lax controls even as progress against illegal, unreported and unregulated fishing continues

Overview
Throughout the global ocean, marine life faces significant threats, with many species endangered and some on the brink of extinction. Two major factors in the decline of ocean biodiversity – overfishing and illegal, unreported and unregulated (IUU) fishing – also jeopardize the food and economic security of countries that rely on healthy fisheries. In fact, experts estimate that at least 1 in 5 wild-caught ocean fish are landed illegally, and because many of these fish are taken from developing States’ waters and processed and sold elsewhere, this illicit activity costs coastal communities billions of dollars annually.1
Fortunately, governments are starting to make progress in the fight against IUU fishing, thanks to the United Nations Food and Agriculture Organization’s (FAO’s) Agreement on Port State Measures (PSMA), the only legally binding international agreement designed to prevent, deter and eliminate IUU fishing by denying port access to vessels engaged in these practices. In force since 2016, the PSMA helps to ensure that fish populations and the communities that depend on them are healthy.
Parties to the PSMA must implement controls to minimize the risk of foreign fishing vessels landing or transshipping – transferring between a fishing vessel and a carrier vessel – IUU-caught fish. The agreement also requires that Parties adopt similar controls for domestic fleets. Today, the PSMA covers more than 100 countries, including the European Union’s 27 member States and China.
Beginning in 2019, The Pew Charitable Trusts commissioned a fisheries consultancy, Poseidon Aquatic Resource Management, and the nonprofits OceanMind and Global Fishing Watch to conduct a series of studies on port usage – including identifying ports that are most at risk of accepting IUU-caught fish – and those where more effective PSMA implementation would have the greatest impact. For the initial study, which analysed data from 2017, researchers used positional data from fishing and carrier vessels’ automatic identification systems (AIS) and other publicly available information, such as foreign and domestic vessel visits, to rank ports by various measures and assign risk levels. Poseidon Aquatic Resource Management and Global Fishing Watch repeated the study in 2020 and 2023 with updated data.
AIS mainly helps to ensure that marine traffic doesn’t jeopardize the safety of workers at sea, but authorities also use it for vessel tracking to inform risk assessments at port, and today the global fishing fleet represents up to 16 per cent of all AIS traffic. The latest research, published in 2025 in the journal Ocean & Coastal Management, is based on approximately 2 million identified port calls, up from 800,000 in the initial study.2 Improvements in tracking technology and increased usage of AIS since 2017 enabled researchers to map about 75 per cent of fishing vessel voyages, up from 50 per cent just six years earlier. In part because of improvements in AIS technology and research methods, identifiable AIS usage has increased the number of fishing vessels in the study almost twofold since 2017.
Key findings of the research include the following:
- Significantly, the 2023 data shows that port usage returned to its pre-COVID-19 levels. For example, the port of Majuro in the Republic of the Marshall Islands, where traffic fell off dramatically during the pandemic, is once again one of the world’s busiest fishing ports, processing significant tuna catches from the Western and Central Pacific Ocean.
- Risk has decreased for PSMA parties consistently since 2017, demonstrating that being a Party to the treaty alone may be a deterrent to IUU fishing. And although the 2023 data shows that risk for non-Parties is higher, that too has gone down. This might be because many regional fisheries management organizations (RFMOs) – which manage high seas fisheries – have adopted more port State measures (PSMs), although many of those PSMs could be further aligned with the agreement. That in turn further discourages IUU fishing and probably lowers the risk of IUU-caught fish reaching port for Parties and non-Parties alike.
- Less than 3 per cent of total port visits are by foreign or third party-flagged vessels.3 Therefore, strong controls over domestic landings, in line with the guidance of the PSMA, are essential to combat IUU fishing.
- There is a discernible trend of high-risk vessels visiting port States with weak rules or enforcement, with ports in Asia and the Near East regions remaining most at risk.
- Since 2017, the ability to identify and track vessels using AIS technology has improved significantly, while fishing vessels’ use of AIS has increased. As a result, researchers have a better overall picture of fishing effort and vessel movement than they did even a few years ago.
- The researchers were unable to verify data on some vessels that did not have their AIS transceivers on. This is partly because public registers, including the FAO Global Record of Fishing Vessels, Refrigerated Transport Vessels and Supply Vessels, are incomplete – something that could be greatly improved if all flag States provided the required information for all of their vessels.
This brief presents an overview of the researchers’ findings and includes recommendations to improve PSMA implementation.
Port rankings based on vessel visits and hold size
From 2017 to 2023, the number of port visits by fishing and carrier vessels that researchers identified more than doubled, from 147,373 to 300,874. This probably doesn’t reflect an actual jump in visits; instead, researchers said, it’s almost certainly due to a combination of increased vessel usage of AIS and better tracking technologies. Regardless, taken in sequence, the studies paint an ever-clearer picture of vessel movements and port visits around the world.
For all three studies, China has been home to the world’s 10 busiest ports, based on the total number of fishing and carrier vessel visits (domestic and foreign) (Table 1). In 2023, over 99 per cent of these visits were by Chinese-flagged ships; the foreign visits were primarily by carrier vessels flagged to Russia and Panama.
Table 1
China Has World’s 10 Busiest Ports
Top 10 global ports by number of vessel visits, 2017, 2020 and 2023
|
2017 |
2020 |
2023 |
|||||||
|---|---|---|---|---|---|---|---|---|---|
|
Rank |
Port |
Country |
Visits |
Port |
Country |
Visits |
Port |
Country |
Visits |
|
1 |
Zhoushan |
CHN |
59,830 |
Quanzhou |
CHN |
37,816 |
Shanghai |
CHN |
43,535 |
|
2 |
Wenzhou |
CHN |
20,874 |
Shipu |
CHN |
30,160 |
Taizhou |
CHN |
39,498 |
|
3 |
Lanshan |
CHN |
11,579 |
Dongshan |
CHN |
26,804 |
Dalian |
CHN |
37,791 |
|
4 |
Rizhao |
CHN |
9,501 |
Taizhou |
CHN |
21,965 |
Zhoushan |
CHN |
37,294 |
|
5 |
Dongshan |
CHN |
9,406 |
Dongping |
CHN |
19,463 |
Wenzhou |
CHN |
31,255 |
|
6 |
Quanzhou |
CHN |
8,826 |
Zhoushan |
CHN |
19,261 |
Quanzhou |
CHN |
25,193 |
|
7 |
Xiamen |
CHN |
7,649 |
Lanshan |
CHN |
17,884 |
Lanshan |
CHN |
24,444 |
|
8 |
Qingdao |
CHN |
6,842 |
Shidao |
CHN |
17,820 |
Rizhao |
CHN |
21,605 |
|
9 |
Shanghai |
CHN |
6,834 |
Beihai |
CHN |
16,925 |
Ningbo |
CHN |
20,577 |
|
10 |
Shantou |
CHN |
6,032 |
Rushan |
CHN |
16,580 |
Shidao |
CHN |
19,682 |
|
Total |
147,373 |
224,678 |
300,874 |
In 2023, Nouadhibou, Mauritania, retained the top spot for foreign vessel visits (Table 2), with a 30 per cent increase in visits since 2020. As in 2020, the majority of these were by Turkish-flagged vessels (1,522), followed by China (546), Spain (345) and Cameroon (157). Busan, South Korea, saw a slight increase (4.5 per cent) in vessel visits but a 39 per cent increase in total hold size (Table 3), indicating increased carrier vessel traffic there.
The port of Dubai, United Arab Emirates, illustrates a challenge of remote data assessment. One vessel was logged visiting the port 677 times in a year – which is very unlikely, particularly if it was engaged in fishing operations. But the analysts lacked any data that could conclusively dispute that number, so it has been left in with the strong caveat that it may well be erroneous. Overall, the Near East region has seen an increase in foreign vessel visits from 0.3 per cent in 2017 to 2.8 per cent in 2023, which is the biggest regional increase across the study years.
For foreign-flagged vessel visits, the top 10 ports consistently include Nouadhibou, Mauritania; Busan, South Korea; Majuro, Republic of Marshall Islands; Dakar, Senegal; and Castletown Bearhaven, Ireland (Table 2), except in 2020, when Majuro wound down operations because of COVID-19. These five countries are PSMA Parties and, because they account for so many foreign vessel visits, the sound implementation of the treaty in these ports is critical in the fight against IUU fishing.
Table 2
Visits to Most Popular Ports Stabilize After 2020 COVID Disruptions
Top destinations for foreign vessels catch in 2017, 2020 and 2023
|
2017 |
2020 |
2023 |
|||||||
|---|---|---|---|---|---|---|---|---|---|
|
Rank |
Port |
Country |
Visits |
Port |
Country |
Visits |
Port |
Country |
Visits |
|
1 |
Busan |
KOR |
1,528 |
Nouadhibou |
MRT |
2,226 |
Nouadhibou |
MRT |
2,887 |
|
2 |
Majuro |
MHL |
1,168 |
Busan |
KOR |
1,353 |
Busan |
KOR |
1,414 |
|
3 |
Kirkenes |
NOR |
1,148 |
Castletown Bearhaven |
IRL |
1,214 |
Majuro |
MHL |
906 |
|
4 |
Nouadhibou |
MRT |
1,078 |
Vila Real de Santo Antonio |
PRT |
1,107 |
Isla Cristina |
ESP |
880 |
|
5 |
Suva |
FJI |
983 |
Antwerp |
BEL |
978 |
Castletown Bearhaven |
IRL |
804 |
|
6 |
Port Louis |
MUS |
957 |
Quanzhou |
CHN |
892 |
Hanstholm |
DNK |
725 |
|
7 |
Manta |
ECU |
634 |
Dakar |
SEN |
847 |
Dubai |
ARE |
694 |
|
8 |
Dakar |
SEN |
614 |
Hanstholm |
DNK |
799 |
Dakar |
SEN |
688 |
|
9 |
Las Palmas |
ESP |
601 |
Isla Cristina |
ESP |
788 |
BoulogneSur-Mer |
FRA |
682 |
|
10 |
Castletown Bearhaven |
IRL |
594 |
Borkum |
DEU |
685 |
Vlissingen |
NLD |
675 |
|
Total |
9,305 |
10,889 |
10,355 |
Notes: ARE = United Arab Emirates; BEL = Belgium; CHN = China; DEU = Germany; DNK = Denmark; ECU = Ecuador; ESP = Spain; FJI = Fiji; FRA = France; IRL = Ireland; KOR = Republic of South Korea; MHL = Marshall Islands; MRT = Mauritania; MUS = Mauritius; NLD = The Netherlands; NOR = Norway; PRT = Portugal; SEN = Senegal.
Hold size is an important metric because it provides insight into how much fish a vessel can land or load. Yehliu, Taiwan, appears for the first time and takes the top spot with a recorded hold size of 1,857,359 cubic metres. Again, however, this could be an anomaly. In this instance, a vessel registered to China visits the port 79 times, which seems excessive for a fishing vessel. And there is limited vessel information that could be corroborated from publicly accessible data: For example, several sources indicate that it is 1,022 metres long, which researchers feel is incorrect because of the typical sizes of carrier vessels. So, the researchers instead presumed this vessel was 200 metres in length for the purposes of this study. This highlights the need for more accurate, publicly available systems to verify vessel details to help enable research. Tools such as the Global Record should help resolve issues like this, but many of its data sets are incomplete.
The newly operational PSMA Global Information Exchange System (GIES) should allow States to share intelligence, upload inspection reports and validate vessel details to inform decisions on entry into port. Because information-sharing is a fundamental requirement of the PSMA, upload of information to the GIES is required if a State does not have a national electronic PSM system or is not using a regional system to share its real-time data.
The study also shows that six of the top 10 ports for vessel hold volume are in Asia, and for the first time, Taiwan has two ports in the top five (albeit with the potential discrepancy in port visits tracked), highlighting the increased importance of effective port State measures in this region.
Many of the top ports in terms of hold volume are tuna fishing hubs, which in all studies accounted for a significant proportion of foreign port usage (Table 3). Port Victoria, Seychelles (ranked sixth), and Majuro, Republic of Marshall Islands (ranked tenth), are all frequented by foreign vessels, although hold size for these important ports has declined significantly between studies.
Table 3
Capacity of Foreign Fishing Vessels Jumped From 2017 to 2023
Hold size could equate to more IUU fish entering market
|
2017 |
2020 |
2023 |
|||||||
|---|---|---|---|---|---|---|---|---|---|
|
Rank |
Port |
Country |
Hold size (m3) |
Port |
Country |
Hold size (m3) |
Port |
Country |
Hold size (m3) |
|
1 |
Majuro |
MHL |
943,000 |
Nouadhibou |
MRT |
1,512,053 |
Yehliu |
TWN |
1,857,359 |
|
2 |
Manta |
ECU |
761,748 |
Busan |
KOR |
574,078 |
Nouadhibou |
MRT |
1,176,828 |
|
3 |
Dakar |
SEN |
561,418 |
Port Victoria |
SYC |
486,738 |
Busan |
KOR |
799,813 |
|
4 |
Busan |
KOR |
545,080 |
Rabaul |
PNG |
439,473 |
Pengerang |
MYS |
728,700 |
|
5 |
Nouadhibou |
MRT |
468,553 |
Toftir |
DNK |
376,373 |
Keelung |
TWN |
436,859 |
|
6 |
Kirkenes |
NOR |
381,074 |
Dakar |
SEN |
339,713 |
Port Victoria |
SYC |
422,076 |
|
7 |
Walvis Bay |
NAM |
375,292 |
Abidjan |
CIV |
336,678 |
Wenzhou |
CHN |
402,111 |
|
8 |
Abidjan |
CIV |
335,405 |
Tarawa |
KIR |
328,033 |
Shanghai |
CHN |
394,452 |
|
9 |
Pohnpei |
FSM |
331,692 |
Las Palmas |
ESP |
320,370 |
Dakar |
SEN |
340,126 |
|
10 |
Port Louis |
MUS |
319,985 |
Leirvik |
DNK |
294,453 |
Majuro |
RMI |
331,538 |
|
Total |
5,023,247 |
5,007,962 |
6,889,862 |
||||||
Notes: CHN = China; CIV = Ivory Coast; DNK = Denmark; ECU = Ecuador; ESP = Spain; FSM = Federated States of Micronesia; KIR = Kiribati; KOR = Republic of South Korea; MHL = Marshall Islands; MRT = Mauritania; MUS = Mauritius; MYS = Malaysia; NAM = Namibia; NOR = Norway; PNG = Papua New Guinea; SEN = Senegal; SYC = Seychelles; TWN = Taiwan.
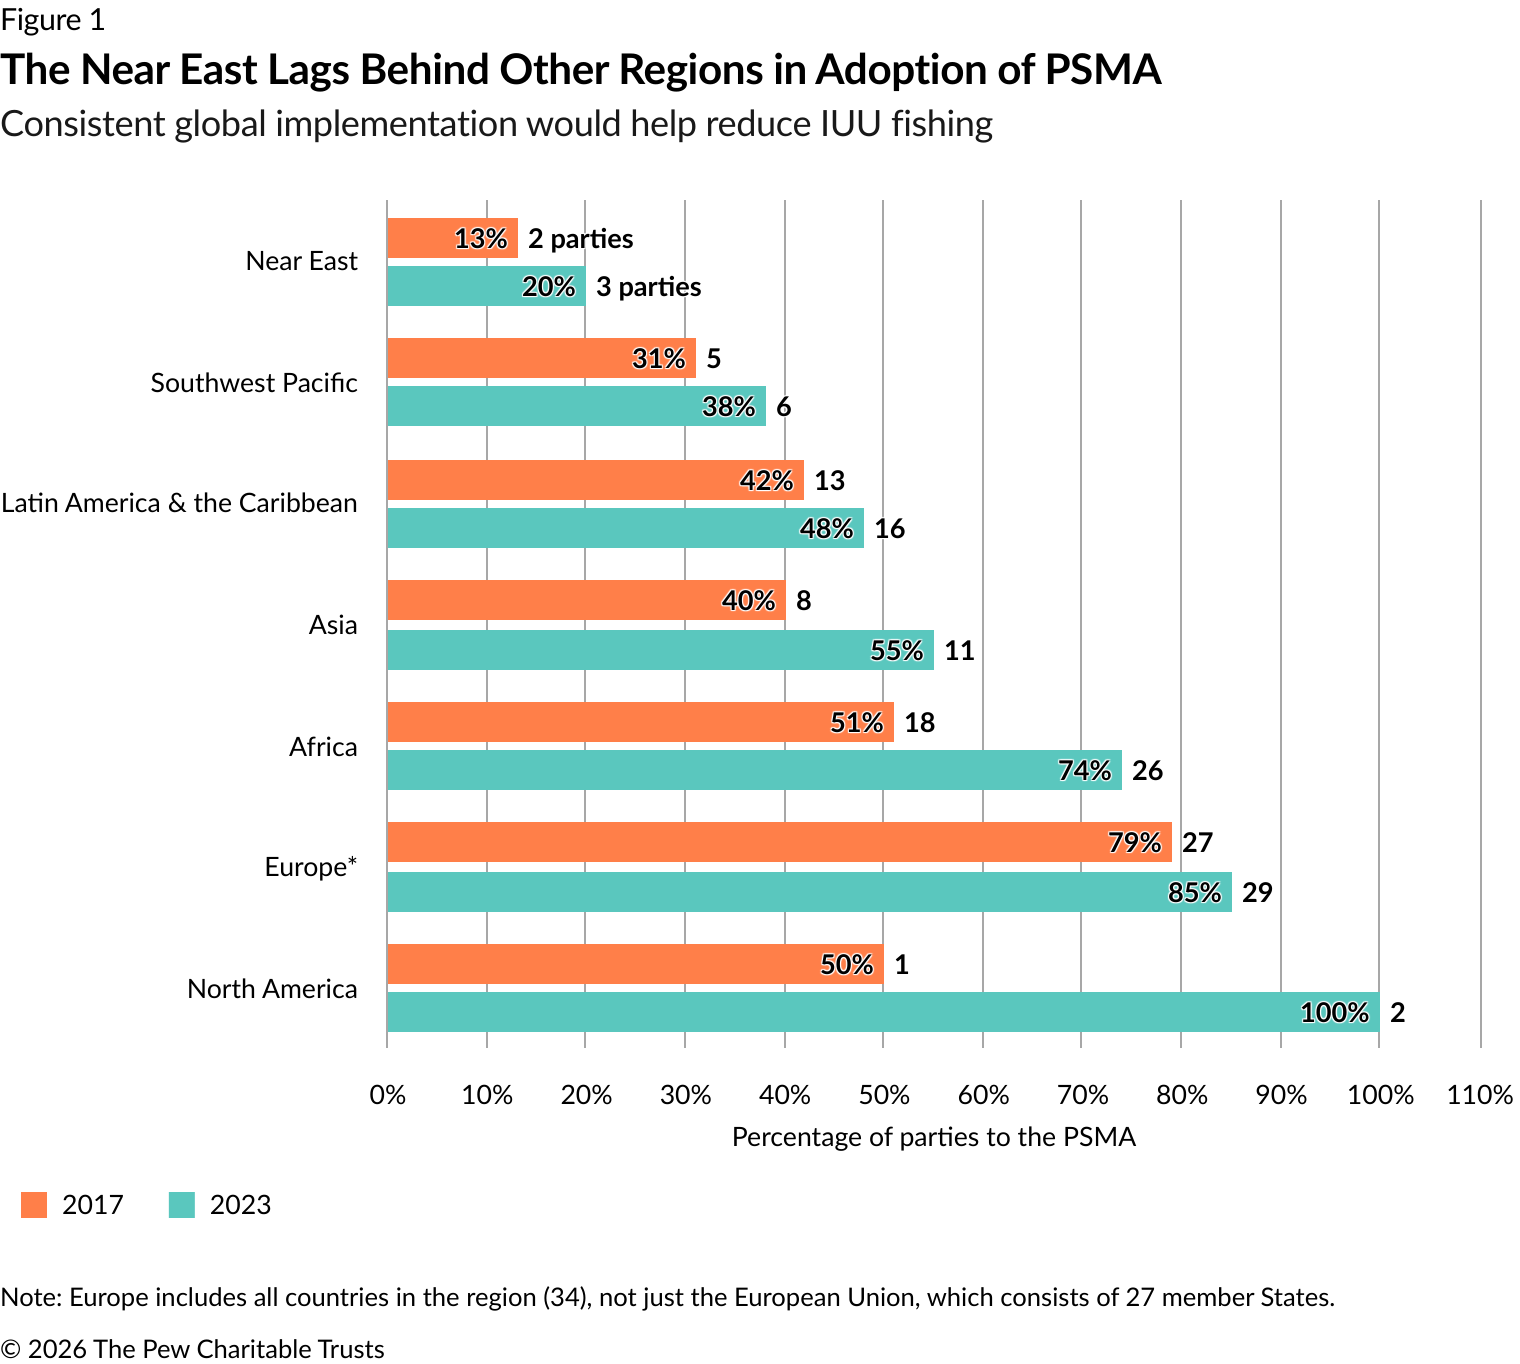
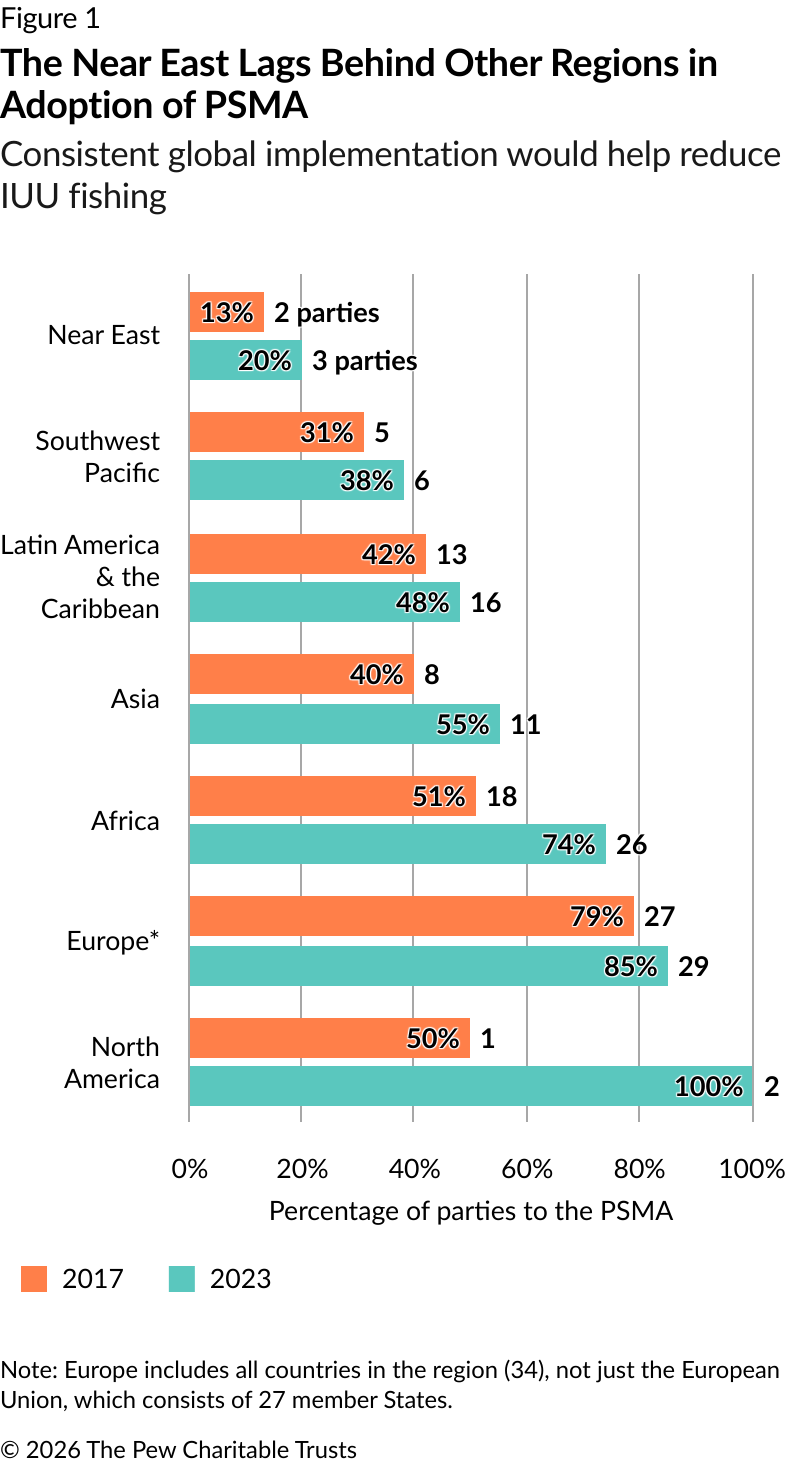
Changes in PSMA adoption over time
Although adoption of the PSMA has steadily increased since it entered into force in 2016 with 70 per cent of coastal States having ratified or acceded to the agreement by 2023, regional representation remains very uneven (Figure 1).
Index of port State risk
To assess risk, researchers looked at a range of internal and external indicators (Table 4). For example, perceived levels of corruption are an internal risk, while visits by vessels likely to be engaged in IUU fishing are an external risk. Each indicator is scored from 1 (low risk) to 5 (high risk). Researchers averaged the indicators to achieve a single risk score for each port State. Those scores were further averaged to produce regional and global scores.
The quality of governance is determined through Transparency International’s Corruption Perceptions Index (CPI), and both CPI and per capita gross national income have been assessed as indicators of (proxies for) risk. All three studies highlight that CPI scores are a significant factor of overall State risk. CPI scores for States have improved since 2017, driven by improvement in their governance because of increased AIS use on vessels.
And while country income is also an important factor, overall quality of governance is the more potent of the two in minimizing risk and deterring IUU vessels from visiting ports. The Near East was the only region where overall port State risk increased in line with higher national income – in opposition to trends verified in most other world regions. Notably, governance and income account for only 10 per cent of the observed port State risk variance overall.
The full risk assessment criteria applied to each port State are shown below.
Table 4
A Diverse Set of Internal and External Factors Inform Risk at Port
Underlying indicators for the port State IUU risk index
|
Category |
AIS-based |
Priority |
Indicator |
|---|---|---|---|
|
General |
Yes |
N/A |
1. Operates commercial ports in which fishing vessels do business |
|
Internal |
Yes |
High |
2. Number of commercial fishing ports |
|
No |
Medium |
3. Party to the PSMA |
|
|
No |
Medium |
4. Contracting party or cooperating non-contracting party of a regional fisheries management organization (RFMO) with a binding port State measures resolution and transparent compliance monitoring |
|
|
No |
High |
5. Compliance record with binding RFMO port State conservation and management measures |
|
|
No |
Medium |
6. Transparency International’s Corruption Perceptions Index ranking |
|
|
No |
Low |
7. Status of the port State, identified by the EU* |
|
|
No |
Low |
8. Status of the port State, identified by the U.S.* |
|
|
No |
Medium |
9. Status of the port State, within any RFMO* |
|
|
External |
Yes |
Medium |
10. Port visits by foreign fishing vessels |
|
Yes |
High |
11. Flag of convenience State fishing vessels entering ports (plus vessels with an unknown Maritime Mobile Service Identity) |
|
|
Yes |
High |
12. Average flag State governance index of fishing vessels entering ports† |
|
|
Yes |
High |
13. IUU-listed fishing vessels entering port |
|
|
Yes |
Medium |
14. EU-carded flag State fishing vessels entering ports |
|
|
Yes |
Medium |
15. U.S.-carded flag State fishing vessels entering ports |
|
|
Yes |
Medium |
16. Average internal port State risk of fishing vessels entering ports (indicators 1-9) |
|
Notes: In this table, “fishing vessels” refers to fishing vessels and carrier vessels. * Status indicates whether the port State has been identified or issued a warning by the European Union, the U.S., or an RFMO mechanism as an underperforming State. †Average Transparency International Corruption Perceptions Index scores for the flag States of foreign vessels that entered given ports. | |||
Risk findings based on indicator scoring and trends
As the quality of AIS data increases, so does the ability to track vessels. This is seen through the observed increase in domestic vessel visits, which rose more than 160 per cent from 2017 (775,454) to 2023 (2,092,682) (Table 5). Vessel visits to foreign ports, while increasing by 37 per cent over the study years, represent a reducing proportion of port activity, decreasing from 5.21 per cent of all visits in 2017 to 2.65 per cent in 2023. While the study data can’t pinpoint with accuracy what’s happening in the water, researchers were able to draw confident conclusions about many aspects of IUU fishing risk and PSMA implementation. In particular, it has emerged that the vast majority of vessel visits are to domestic ports. While most of the current focus on PSMA implementation is on foreign vessels, it is critical that countries pay more attention to the implementation of Article 20 of the PSMA, which stipulates that measures applied to domestic vessels should be as effective in preventing, deterring and eliminating IUU fishing as those measures applied to foreign vessels.4 While controls in port for foreign vessels are a critical part of the agreement, the domestic requirements have been largely neglected to date; this needs to change.
Table 5
Over Twofold Increase in Identifiable Port Visits From 2017 to 2023
Improvements in tracking, AIS use help explain increase
|
Year |
Domestic |
Foreign |
Foreign vessel visits as a |
|
2017 |
775,454 |
40,369 |
5.21% |
|
2020 |
1,705,358 |
49,929 |
2.93% |
|
2023 |
2,092,682 |
55,387 |
2.65% |
Vessels flagged to European countries account for the highest percentage of visits to foreign ports, at 55.8 per cent, followed by vessels flagged to Asian countries at 22.3 per cent (Table 6). Vessels flagged to the Near East increased the most in that category, rising from 0.3 per cent in 2017 to 2.8 per cent in 2023.
Table 6
Percentage of Visits to Foreign Ports by Flag Region
Global distribution of port calls by percentage of visits into foreign port, 2017, 2020 and 2023
|
Region where vessel is flagged |
2017 |
2020 |
2023 |
|---|---|---|---|
|
Latin America and the Caribbean |
18.8% |
12.9% |
11.2% |
|
Southwest Pacific |
4.0% |
2.7% |
3.1% |
|
Africa |
4.8% |
4.0% |
2.9% |
|
Near East |
0.3% |
1.0% |
2.8% |
|
Europe |
41.0% |
56.8% |
55.8% |
|
North America |
2.5% |
1.2% |
1.9% |
|
Asia |
29.0% |
21.4% |
22.3% |
Overall, global port State risk declined by 6 per cent from 2017 to 2023 (Table 7), indicating that nine years after the PSMA came into force, countries are making progressive improvements in implementing it. The declining risk is probably also due to increasing numbers of RFMOs adopting conservation and management measures and agreeing to implement compliance monitoring. That said, not all RFMO measures are fully aligned with the agreement, and RFMOs should therefore focus efforts on minimizing risks and ultimately adopting port State measures more in sync with the treaty. Members should comply with the PSMA as a condition of their RFMO membership, regardless of whether those members joined the treaty.
Table 7
Globally, IUU Risk Declined as PSMA Implementation Improved
Data varies by region, but overall trend is encouraging
|
Year |
Internal risk |
External risk |
Overall risk score |
|---|---|---|---|
|
2017 |
2.30 |
2.48 |
2.40 |
|
2020 |
2.23 |
2.52 |
2.40 |
|
2023 |
2.12 |
2.40 |
2.25 |
| Note: 0-1.4 is low risk, 1.5-2.4 is medium risk and 2.5 and above is high risk. | |||
The IUU risk status of States and regions shifted, in some cases substantially, from 2017 to 2023 (Table 8). Asia is now the region most at risk, followed by the Near East and Latin America and the Caribbean.
Governance quality is a significant indicator of port State performance. The Near East, Africa and Latin America and the Caribbean have weaker governance and therefore elevated risk scores. Risk in the southwest Pacific has declined significantly, potentially because of the aforementioned port control measures from RFMOs.
Table 8
Risk Scores Demonstrate Where More Capacity Development Is Needed
Risk level rankings from low (1-3) to high risk (5-7) and scores by risk type and region, 2017, 2020 and 2023
|
Area |
Risk rank 2017 |
Risk rank 2020 |
Risk rank 2023 |
||||||
|---|---|---|---|---|---|---|---|---|---|
|
Internal |
External |
Overall |
Internal |
External |
Overall |
Internal |
External |
Overall |
|
|
Africa |
3 |
6 |
4 |
3 |
4 |
3 |
4 |
6 |
4 |
|
Asia |
5 |
7 |
6 |
4 |
5 |
5 |
6 |
7 |
7 |
|
Europe |
1 |
5 |
2 |
2 |
1 |
1 |
2 |
3 |
3 |
|
Latin America/ Caribbean |
4 |
3 |
3 |
5 |
8 |
6 |
5 |
5 |
5 |
|
Near East |
7 |
4 |
7 |
7 |
7 |
7 |
7 |
4 |
6 |
|
North America |
2 |
2 |
1 |
1 |
3 |
2 |
3 |
1 |
1 |
|
Southwest Pacific |
6 |
1 |
5 |
6 |
2 |
4 |
1 |
2 |
2 |
Recommendations
The evolution of AIS processing and technology since these studies began has resulted in increasing confidence in the identification of the busiest ports and the ability to track fishing vessel voyages. Overall, the data shows that worldwide vessels predominantly land their catch in domestic ports. There was a discernible decline in global port State risk from 2017 to 2023, suggesting that the implementation of the PSMA is having an impact. To help ensure the continued effectiveness of the PSMA, Pew recommends the following:
- Increase usage of the Global Record and the Global Information Exchange System: The Global Record and GIES are two key tools to support the effective implementation of the PSMA and are essential for risk assessment before vessels enter port. However, although the GIES was operationalized in 2023, its confidential reporting system has not yet been fully used, and the Global Record, which does support public data, is also insufficiently used. Therefore, Parties must commit to providing all mandatory data to the Global Record and to update that information at least annually and use GIES or link national and regional systems in real time.
- Focus on domestic controls: With less than 3 per cent of total vessel visits in foreign ports, Parties to the PSMA should ensure that their vessels are complying with the treaty (Article 20) even when landing catch at domestic ports.
- Conduct effective risk assessments: Parties to the PSMA, intergovernmental organizations and nongovernmental organizations should ensure that investigations, assessments and inspections are commensurate with risk – both in States with high vessel traffic and capacity and in high-risk regions such as Asia and the Near East.
- Coordinate effective regional implementation: RFMOs can play a valuable role in ensuring effective PSMA implementation, but not all RFMOs have port State measures that are in line with the treaty. All RFMOs should therefore implement mandatory port State measures aligned with the PSMA.
- Enhance AIS usage: As shown by improvements in vessel tracking over the six years of the studies, AIS is a useful tool in helping authorities and analysts to see what’s happening on the ocean. All flag States should be encouraged to mandate AIS use for all their eligible vessels.
- Increase transparency: One of the continued challenges of large-scale analysis of fishing effort is the lack of transparency across the industry. Initiatives such as the Global Charter for Fisheries Transparency, which was developed by the Coalition for Fisheries Transparency (of which Pew is a member), help to point the way forward.5 If flag States met their existing commitments, including public sharing of vessel data, to implement international agreements, such as the FAO Compliance Agreement, they would meet many of the tenets of the charter.6 And in doing so, these flag States would also help all States, particularly developing States, implement the oversight and control necessary to combat IUU fishing.
Conclusion
The three completed studies on port activity indicate an encouraging trend. The effectiveness of the PSMA seems established and has improved and expanded, and risk of IUU-caught fish entering the supply chains is declining. The net is tightening on higher-risk vessels. AIS use is increasing, port and flag States (and others) are helping to increase transparency of vessel activities.
But implementation of the PSMA is key. In particular, the studies highlight the need for effective oversight of domestic activities in port, which needs to run parallel with that for foreign vessels. They also point to the fact that while many useful implementation tools are in place, port and flag States, Parties to the PSMA, and RFMO members must provide – and regularly update – the required data and act on that data to make the tools effective. Likewise, countries should use thoughtful risk analyses to help identify areas for improvement or targeted assistance.
Methodology
In this study, led by Poseidon Aquatic Resource Management, Global Fishing Watch (GFW) used 2023 AIS data to create a global data set of anchorages, which resulted in a global data set of 166,497 anchorage points.7 This data set was expanded as GFW changed its AIS provider from ORBCOMM to Spire, including new data from ExactEARTH. Anchorage points were aggregated into ports and identified when fishing vessels and fishing carriers enter an anchorage when an AIS position is within 3 kilometres of an anchorage point and exits with a position more than 4 km from an anchorage point. To avoid recording port entries as vessels transit near anchorages (meeting the basic entry and exit criteria), two additional events are recorded: anchorage stops and anchorage gaps. A port stop begins when a vessel is within 3 km of an anchorage point (in port), with a speed less than 0.2 knots, and ends when the vessel speed is greater than 0.5 knots. These stops were algorithmically grouped to represent port visits and linked to locations that represent commonly used ports and anchorages.
The only change in methodology from the previous studies was the exclusion of carrier vessels that probably carried non-fish products (such as fruit) and refrigerated containers.8 AIS data considerations:
- Larger vessels are more likely to carry AIS transmitters and to be detected by AIS receivers, although this study has highlighted that ever-smaller vessels are adopting the AIS technology. This bias increases the confidence of the findings related to foreign visits but underestimates domestic port arrivals by smaller, local vessels.
- While AIS is not compulsory in all States, some countries and regions – for example, the U.S. and Europe – flag more fishing vessels operating on AIS because of regulations making AIS compulsory for certain vessel sizes.
- Several regions frequently generate poor AIS data because of the limited number of terrestrial receivers and high traffic density (e.g., Strait of Malacca and the English Channel) or because operators turn off AIS to reduce the risk of pirate attacks (for example, near Somalia).
- Researchers excluded some transmitted AIS data because of known issues, including invalid ship positions, multiple vessels sharing a single AIS identity, and boats transmitting insufficient information to distinguish them as fishing or carrier vessels. AIS data quality problems are more common in Asia.
Given the variable satellite coverage and AIS use and data quality, this analysis captures approximately 75 per cent of all detected fishing voyages.
Trygg Mat Tracking carried out an extensive quality assurance review of a subset of the data for ports and anchorages.9 That review identified some events that were wrongly associated with a specific anchorage or port, and researchers may have overcounted port visits at the State level. These errors were corrected but, regardless, probably did not significantly affect the analysis, because researchers believe any mistakes fell within the accepted margin of error.
The ranking of ports, especially those based on the hold size, must be used carefully, as these values are estimates and should be used for comparative purposes only. The ranking based on hold size is of great interest to States, intergovernmental organizations and non-governmental organizations, among others, because it represents the aggregate potential for the loading, unloading or transshipment of fish but should not be interpreted as an estimate of the volume of landings or transshipment in port.
Of the 153 coastal States selected for this study, researchers eliminated 15 because no AIS-fitted fishing vessels could be detected entering their ports. Those countries are Belize, Bosnia and Herzegovina, Comoros, Cook Islands, Eritrea, Haiti, Monaco, Nauru, Nicaragua, Niue, Somalia, Sudan, Syria, Timor-Leste and Yemen.
The quality of the non-AIS source data used for indicators (Table 4) is reliable and is determined by the processes applied by the individual organizations producing and hosting these data. When researchers found discrepancies between how information is reported to different sources, they took a conservative bias to ensure that countries did not receive better scores than they should have.
Endnotes
- David J. Agnew et al., “Estimating the Worldwide Extent of Illegal Fishing,” PLOS ONE 4, no. 2 (2009): e4570, https://doi.org/10.1371/journal.pone.0004570.
- Gilles Hosch et al., “Don’t Follow Trends, Start Trends: PSMA Implementation and Port State Performance From 2017 to 2023,” Ocean & Coastal Management 262 (2025): https://doi.org/10.1016/j.ocecoaman.2025.107584.
- The European Union represents its 27 member States under the PSMA. EU vessels visiting another EU port are classed as domestic and would not fall under the requirements of the PSMA. Only third-country vessels would be classed as foreign.
- United Nations Food and Agriculture Organization, Agreement on Port State Measures to Prevent, Deter and Eliminate Illegal, Unreported and Unregulated Fishing (2009), Article 20, https://www.fao.org/3/i5469t/I5469T.pdf.
- “Global Charter for Fisheries Transparency,” Coalition for Fisheries Transparency, https://fisheriestransparency.net/wp-content/uploads/2024/10/Coalition-for-Fisheries-Transparency-Global-Charter-2024-EN.pdf.
- United Nations Food and Agriculture Organization, Agreement to Promote Compliance With International Conservation and Management Measures by Fishing Vessels on the High Seas (2024), https://openknowledge.fao.org/items/79a1bbdd-3b95-45fe-8395dd15621329c2.
- Gilles Hosch et al., “Any Port in a Storm: Vessel Activity and the Risk of IUU-Caught Fish Passing Through the World’s Most Important Fishing Ports,” Journal of Ocean and Coastal Economics 6, no. 1 (2019): https://cbe.miis.edu/cgi/viewcontent.cgi?article=1097&context=joce.
- Gilles Hosch et al., “IUU Safe Havens or PSMA Ports: A Global Assessment of Port State Performance and Risk,” Marine Policy 55 (2023): https://doi.org/10.1016/j.marpol.2023.105751. Gilles Hosch et al., “Any Port in a Storm: Vessel Activity and the Risk of IUU-Caught Fish Passing Through the World’s Most Important Fishing Ports,” Journal of Ocean and Coastal Economics 6, no. 1 (2019): https://cbe.miis.edu/cgi/viewcontent.cgi?article=1097&context=joce.
- “About Us,” Trygg Mat Tracking, https://www.tm-tracking.org/about-tmt-1.


