Philadelphians With Disabilities Increasingly Are Finding Employment
State of the city’s neighborhoods

Philadelphia had the highest rate of disability among America’s 10 most populous cities, with 17% of respondents reporting at least one disability of some kind, according to five-year census data from 2019 to 2023.
This means that roughly 274,000 Philadelphians have functional disabilities, including vision, hearing, cognitive, or ambulatory difficulties, or need help with everyday activities, such as bathing, dressing, and running errands. People with disabilities also face obstacles finding housing and work and navigating the city because of societal and structural barriers.

The Americans with Disabilities Act of 1990 (ADA) aimed to ensure that people with disabilities could fully participate in society by removing physical and societal barriers, including discrimination. A core component of that federal law was that individuals with disabilities who wanted to work should have equal opportunities to do so.1
However, Philadelphians with disabilities are still far less likely to be in the labor force than are people without disabilities. In the U.S. Census Bureau’s most recent American Community Survey data, working-age adults (individuals ages 20 to 64) with disabilities in the city had a labor force participation rate of 43%, which included those who are either employed or actively looking for work. That figure is higher than in past years, but still far below the 83% participation rate for those who did not report having a disability.
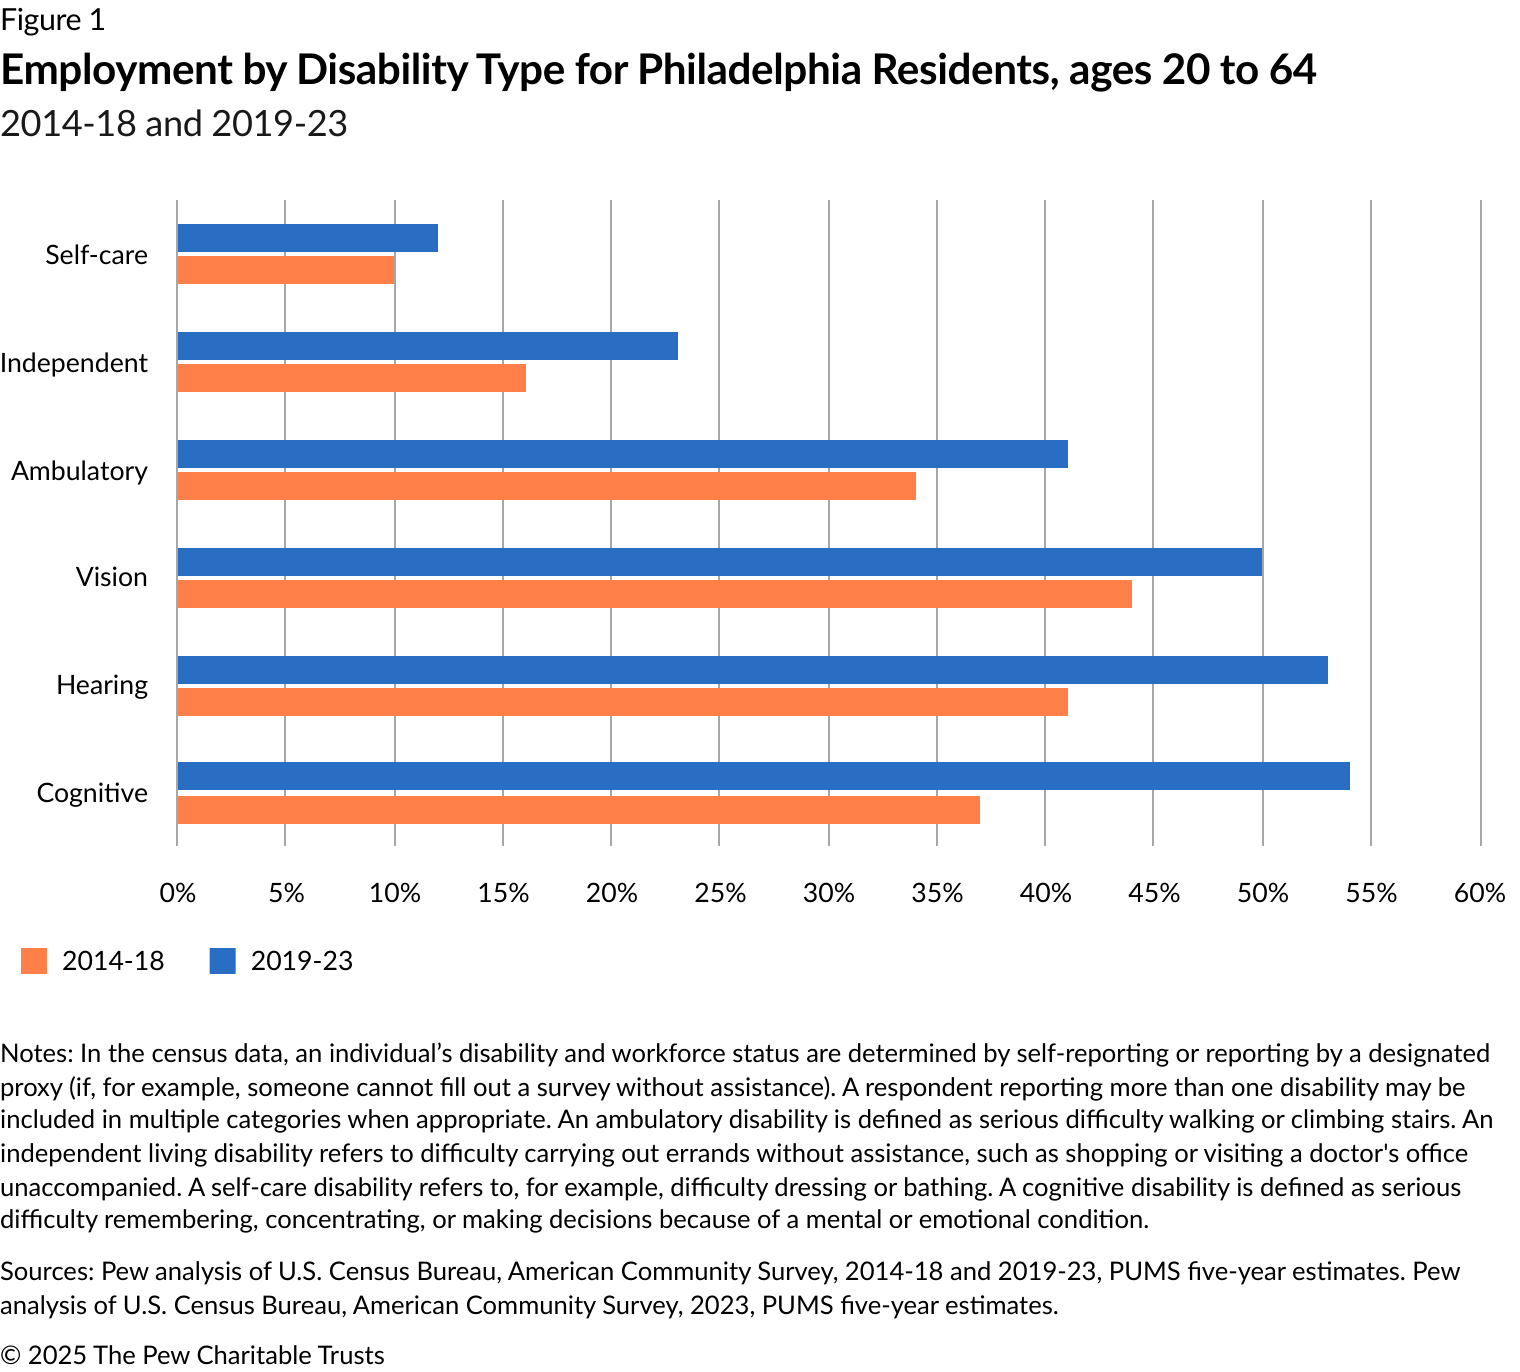
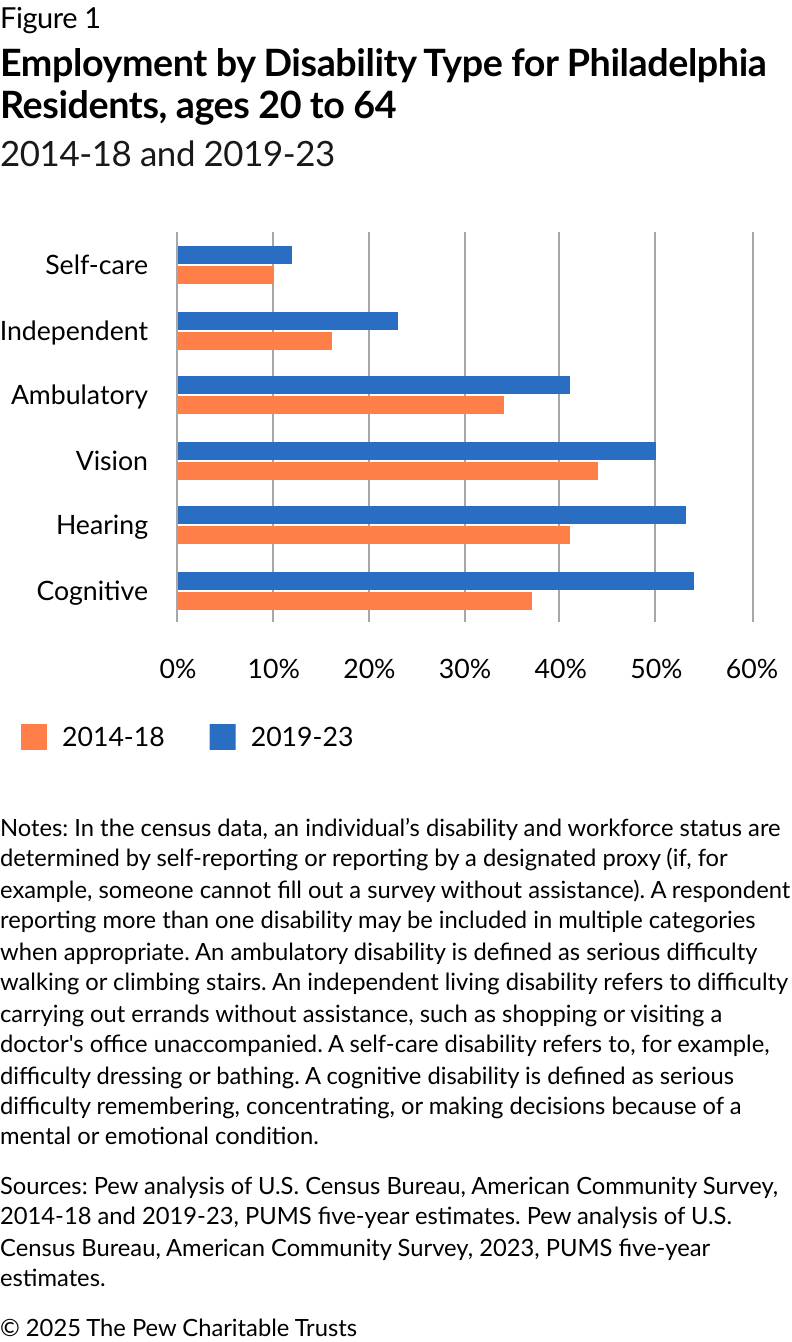
Some progress has been made over the past 35 years; the employment-to-population ratio increased from 27% in 2014-18 to 36% in the most recent five-year data (2019-23) among working adults ages 20 to 64 with disabilities in the city. Experts attribute these increases to companies shifting to remote work during the pandemic.2 Employment increased across six disability types reported in the census: hearing, vision, cognitive ability, and ambulatory ability as well as difficulties related to self-care and independent living.3 Working-age residents with cognitive difficulties experienced the largest increase in employment over the past 10 years, increasing by 17 percentage points. (See Figure 1.)
Despite progress in employment figures, the rate of poverty remains unchanged for working-age Philadelphians with disabilities, 38% of whom had incomes below the poverty threshold during the period examined.
Residents with disabilities disproportionately reside in census tracts where the overall poverty rate is 20% or higher, a threshold set by the U.S. Census Bureau when designating communities as “high poverty.”5 Those tracts are concentrated in North and West Philadelphia. Tracts with a disability rate between 25% and 50% had an average poverty rate of 37%, while tracts with a disability rate of less than 25% had an average poverty rate of 24%. (See Figure 2.)

A recent study found that when adjusting the federal poverty rate to include direct costs incurred by residents with disabilities—such as assistive technology and caregiving services that allow them to participate fully in society—the rate increased from 24% to 35%. That would put an additional 2.2 million people with disabilities at or below the federal poverty level. The report further estimated that households in which one or more members had a disability needed an income that was 29% higher to attain the same living standard as households in which no member had a disability.6
The Pew Charitable Trusts examined two Philadelphia neighborhoods that had a higher share of residents with disabilities than the average found across the city as a whole: Port Richmond and West Philadelphia-Haddington. Pew examined whether a citywide trend of increased employment for working-age adults with disabilities was also evident in these two communities.
Port Richmond:
Port Richmond, a neighborhood in the River Wards section of Philadelphia, is situated along the Delaware River. It is home to more than 22,000 residents, of whom 53% are White, non-Hispanic; 30% Hispanic; and 15% Black or African American.
The neighborhood has a disability rate of 29%, meaning that about 6,400 residents characterize themselves as disabled. Figure 3 shows the disability rate distribution in the neighborhood, which ranges from around 16% to 45% across the tracts.

The most prevalent disabilities in Port Richmond are cognitive difficulties, cited by 54% of residents with a disability (about 3,500 residents), and ambulatory difficulties, affecting 39% of the population (about 2,500 residents).

Pew wanted to determine the employment level among working-age adults in Port Richmond. However, because of limited data, researchers had to work with a somewhat larger area, comprised by the entirety of ZIP code 19134, where most of Port Richmond is located.
While the citywide employment rate for adults with disabilities rose from 2014-18 to 2019-23 by 9 percentage points to 36%, the employment-to-population rate of working-age adults with a disability in the ZIP code remain unchanged at 29%.
By comparison, working-age adults without a disability in this ZIP code had an increase in employment by 8 percentage points, from 63% to 71%.
West Philadelphia–Haddington
The West Philadelphia-Haddington neighborhood sits largely within the 19139 ZIP code. It is home to more than 21,000 residents, 94% of whom are Black or African American.
The neighborhood has a disability rate of 20%, meaning that roughly 4,300 residents reported having one or more disabilities. Among these residents, the most prevalent disabilities are ambulatory (63%), cognitive (48%), and independent living (42%).
Figure 4 shows that disability rates across the neighborhood ranged from around 16% to 22%.

The percentage of working-age adults with disabilities in the 19139 ZIP code—which encompasses most of West Philadelphia–Haddington—saw a significant increase in the employment-to-population rate among working-age adults, from 19% in 2014-18 to 30% in 2019-23.
Working-age adults without a disability had an employment rate of 74%—more than twice that of those with a disability. During the period examined, employment increased by only 6 percentage points for those without a disability—less than the 11 percentage point increase for residents with disabilities.
Conclusion
In recent years, Philadelphians saw an encouraging increase in the ranks of residents with disabilities who are employed, but the findings suggest that more must be done to remove barriers to employment for working-age adults with disabilities.

Comparing a decade of U.S. Census data, from 2014 to 2023, employment among working-age adults with a disability in Philadelphia increased by 9 percentage points. But this trend was not experienced equally across the city, as evidenced by two neighborhoods with large disability communities.
West Philadelphia-Haddington experienced an 11 percentage-point increase in employment among residents with disabilities during the period examined. By contrast, employment remained unchanged for members of the disability community in Port Richmond.
As discussed earlier in this report, Philadelphians with disabilities face a higher cost of living merely to match the level of economic participation enjoyed by nondisabled residents. Recent employment gains by disabled individuals may not offset the additional financial burdens they face as they attempt to access the accommodations needed to participate fully in society.
And over the period examined, the percentage of disabled Philadelphians with incomes below the poverty threshold remains stuck at a far-too-high 38%, signaling a need for greater attention to the economic challenges faced by this community.
To tackle the additional financial burdens faced by those with disabilities, city officials need not only to address the barriers to employment encountered by those with disabilities, but also the challenges they face when trying to access the accommodations they need to surmount them.
Endnotes
- A Guide for People With Disabilities Seeking Employment, U.S. Department of Justice Civil Rights Division, 2020, https://www.ada.gov/resources/employment-seeking-guide/.
- Cassandra Marks and Hannah Rubinton, “The Labor Effects of Work From Home on Workers With a Disability,” Federal Reserve Bank of St. Louis, Feb. 27, 2024, https://www.stlouisfed.org/on-the-economy/2024/feb/labor-effects-work-from-home-workers-disability.
- U.S. Census Bureau. "How Disability Data Are Collected From the American Community Survey."
- U.S. Census Bureau, "How Disability Data Are Collected From the American Community Survey."
- U.S. Census Bureau, “Poverty Glossary,” https://www.census.gov/topics/income-poverty/poverty/about/glossary.html.
- Z. A. Morris, McGarity, S. V., Goodman, N., & Zaidi, A., “The Extra Costs Associated with Living with a Disability in the United States,” Journal of Disability Policy Studies, 33(3), 158-167. (2022): https://doi.org/10.1177/10442073211043521.
People


