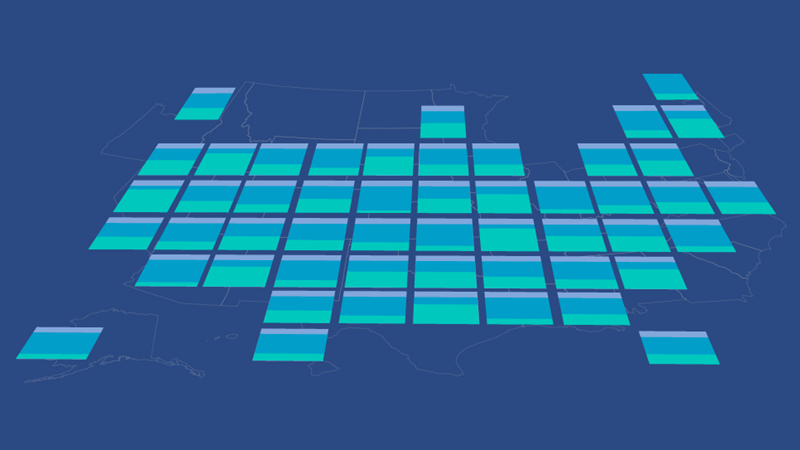
The Pew Charitable Trusts’ Fiscal 50—an interactive platform on Pew’s website that provides a data-driven picture of the fiscal conditions in each U.S. state—marked its 10th anniversary with a top-to-bottom redesign. Launched in May, the updated Fiscal 50 contains plenty of detailed information to help policymakers understand long-term budgetary trends and boasts an improved suite of interactive features. A new Budget Threads feature offers Pew’s perspective on the latest state fiscal news.
Visitors can select a state and view, sort, and analyze data on key trends that shape that state’s fiscal health both in the present day and over the long term. The site measures eight key indicators: fiscal balance, tax revenue trends, federal share of state revenue, reserves and balances, long-term liabilities, state Medicaid spending, tax revenue volatility, and population change.
Many of these long-time indicators were overhauled to incorporate new data and policy-relevant insights. For example, the population indicator now includes projections, breaks data down by age group, and offers more granular details on what drives trends. All of these indicator pages are interactive, with data that is also highly customizable and shareable.
In addition, these updated indicator pages offer analysis of 50-state performance and recent trends, show visitors why each indicator matters, and explain relevant on-the-ground developments in each state. The pages are anchored by interactive data visualizations, which include captions and other text that respond to a visitor’s selections. For instance, if someone asks for a view with trend lines that highlight the capacity of rainy day funds in Kansas, Michigan, and New Jersey over time, a detailed caption will appear that explains key takeaways for each of those states and provides national context.
Other improvements include state pages that help visitors keep track of trends in their home state and provide national and regional context. These pages also highlight and bring together the most relevant state fiscal policy tools, research, and analysis from across Pew.
After Fiscal 50 first arrived on Pew’s website a decade ago, it quickly became the fiscal portfolio’s signature product—and also its most popular. Today, it is a trusted resource not only for state and local policymakers, but also for the public. That said, after a decade, the site was in need of a little refurbishment.
“After 10 years, there came a natural need for reimagining this work,” said Melissa Maynard, who directs the Fiscal 50 project. “We had a clear expectation of what users wanted to get out of our platform and what they’d come to expect from it, but also saw a clear need to shake things up and experiment with new approaches.” The new design lets visitors access and compare data in fresh new ways.
The fiscal decisions state leaders make have profound and long-term effects on communities. By securing stable, sustainable state budgets, lawmakers can ensure that key services are reliably funded and policy priorities are protected, even during economic downturns. Fiscal 50 provides the research, data, and tools needed to address such challenges and to also contend with things like aging infrastructure, natural disasters, and shifting demographics.


