Most Students Pay Out of Pocket for Nondegree Credentials
Findings are similar across demographic groups

Nondegree credentials (NDCs) have become increasingly popular in the last couple of decades. In 2022, approximately a third (34%) of the U.S. population ages 16 to 75 had completed an NDC, such as a vocational certificate or professional license, and annual rates of self-reported NDC attainment tripled between 2009 to 2021, according to an article by The Pew Charitable Trusts. Survey data also revealed that nearly half of NDC earners fully paid for their most recent vocational certificate (45%) or their most important professional license or certification (49%) themselves, while 29% and 32%, respectively, partially paid for their credentials themselves.
This article is part of a series on findings from the 2022 National Training, Education, and Workforce Survey pilot, a nationally representative survey of 15,000 people. The first analysis examined the individual funding sources that respondents used to pay for their credentials. This second analysis dives deeper into the data, finding that across demographic groups, most people finance NDC programs themselves or take out loans.

NDCs are earned through programs often lasting less than a year—offered by schools (both accredited and not), organizations, and government agencies—and typically focus on a specific skill or industry, such as welding, construction, dental assisting, or web programming. Examining how various demographic groups finance their NDCs may reveal differences in experiences that are not typically captured by overall estimates. For example, some groups may be more likely than others to use risky forms of financing for educational expenses, such as credit cards or private loans, which can shed light on affordability challenges.
Additionally, the financial consequences of borrowing to pay for an NDC may be particularly concerning if a high-cost program leads to a low-wage job. Findings from this analysis can help policymakers identify potential barriers to financing for different populations and guide efforts to ensure that NDC programs are accessible, high quality, financially sound, and supported by meaningful accountability measures.
About the data
This analysis uses pilot data from the 2022 National Training, Education, and Workforce Survey (NTEWS), a nationally representative survey of over 15,000 respondents fielded by the U.S. Census Bureau, and focuses on two types of credentials: vocational certificates and professional licenses or certifications. NTEWS defines a vocational certificate as “a vocational certificate or diploma for completing a training program from a community college, technical or trade school, or some other school” and excludes associate degrees. The analysis also includes respondents with “any currently active state or industry licenses or professional certifications,” such as “teaching license, land surveyor license, nurse midwife certification, Cisco Certified Network Associate, etc.” and excludes “vendor’s licenses or other licenses to operate a business.”
NDC holders finance their credentials through a range of funding sources
Survey respondents were asked about the types of financing they used to pay for their NDCs. To provide more structured insights, the Pew team grouped NDC funding sources into three broad categories: self-pay (using their own money and/or borrowing), payment by external sources (including employers and grants), and a combination of self-pay and external sources (see Table 1).
Funding Sources for Nondegree Credentials
|
Fully paid for by external sources |
Fully paid for by self/loans |
Combination |
Payment method unknown |
|
External sources include:
|
Self-pay/loans include:
|
Respondents chose a combination of “paid for by external sources” and “paid for by self/loans.” |
Respondents did not choose any of the “fully paid for by external sources” or “fully paid for by self/loans” funding sources. |
These categories reveal the proportion of respondents who paid for their credential entirely through their own personal resources—using savings or checking accounts, credit cards, or borrowing—versus those who used other payment sources, helping pinpoint the groups most likely to bear the financial burden of earning an NDC.
Paying out of pocket was the most common method of financing vocational certificates and licenses across demographic categories
Using the NTEWS survey data, the Pew team examined payment patterns for NDCs throughout demographic categories and looked separately at funding sources for vocational certificates and for licenses or certifications. Nevertheless, findings were consistent across demographics and across credential types: Most respondents paid for their NDC programs out of pocket. The following is a breakdown of some of our findings.
Vocational certificates
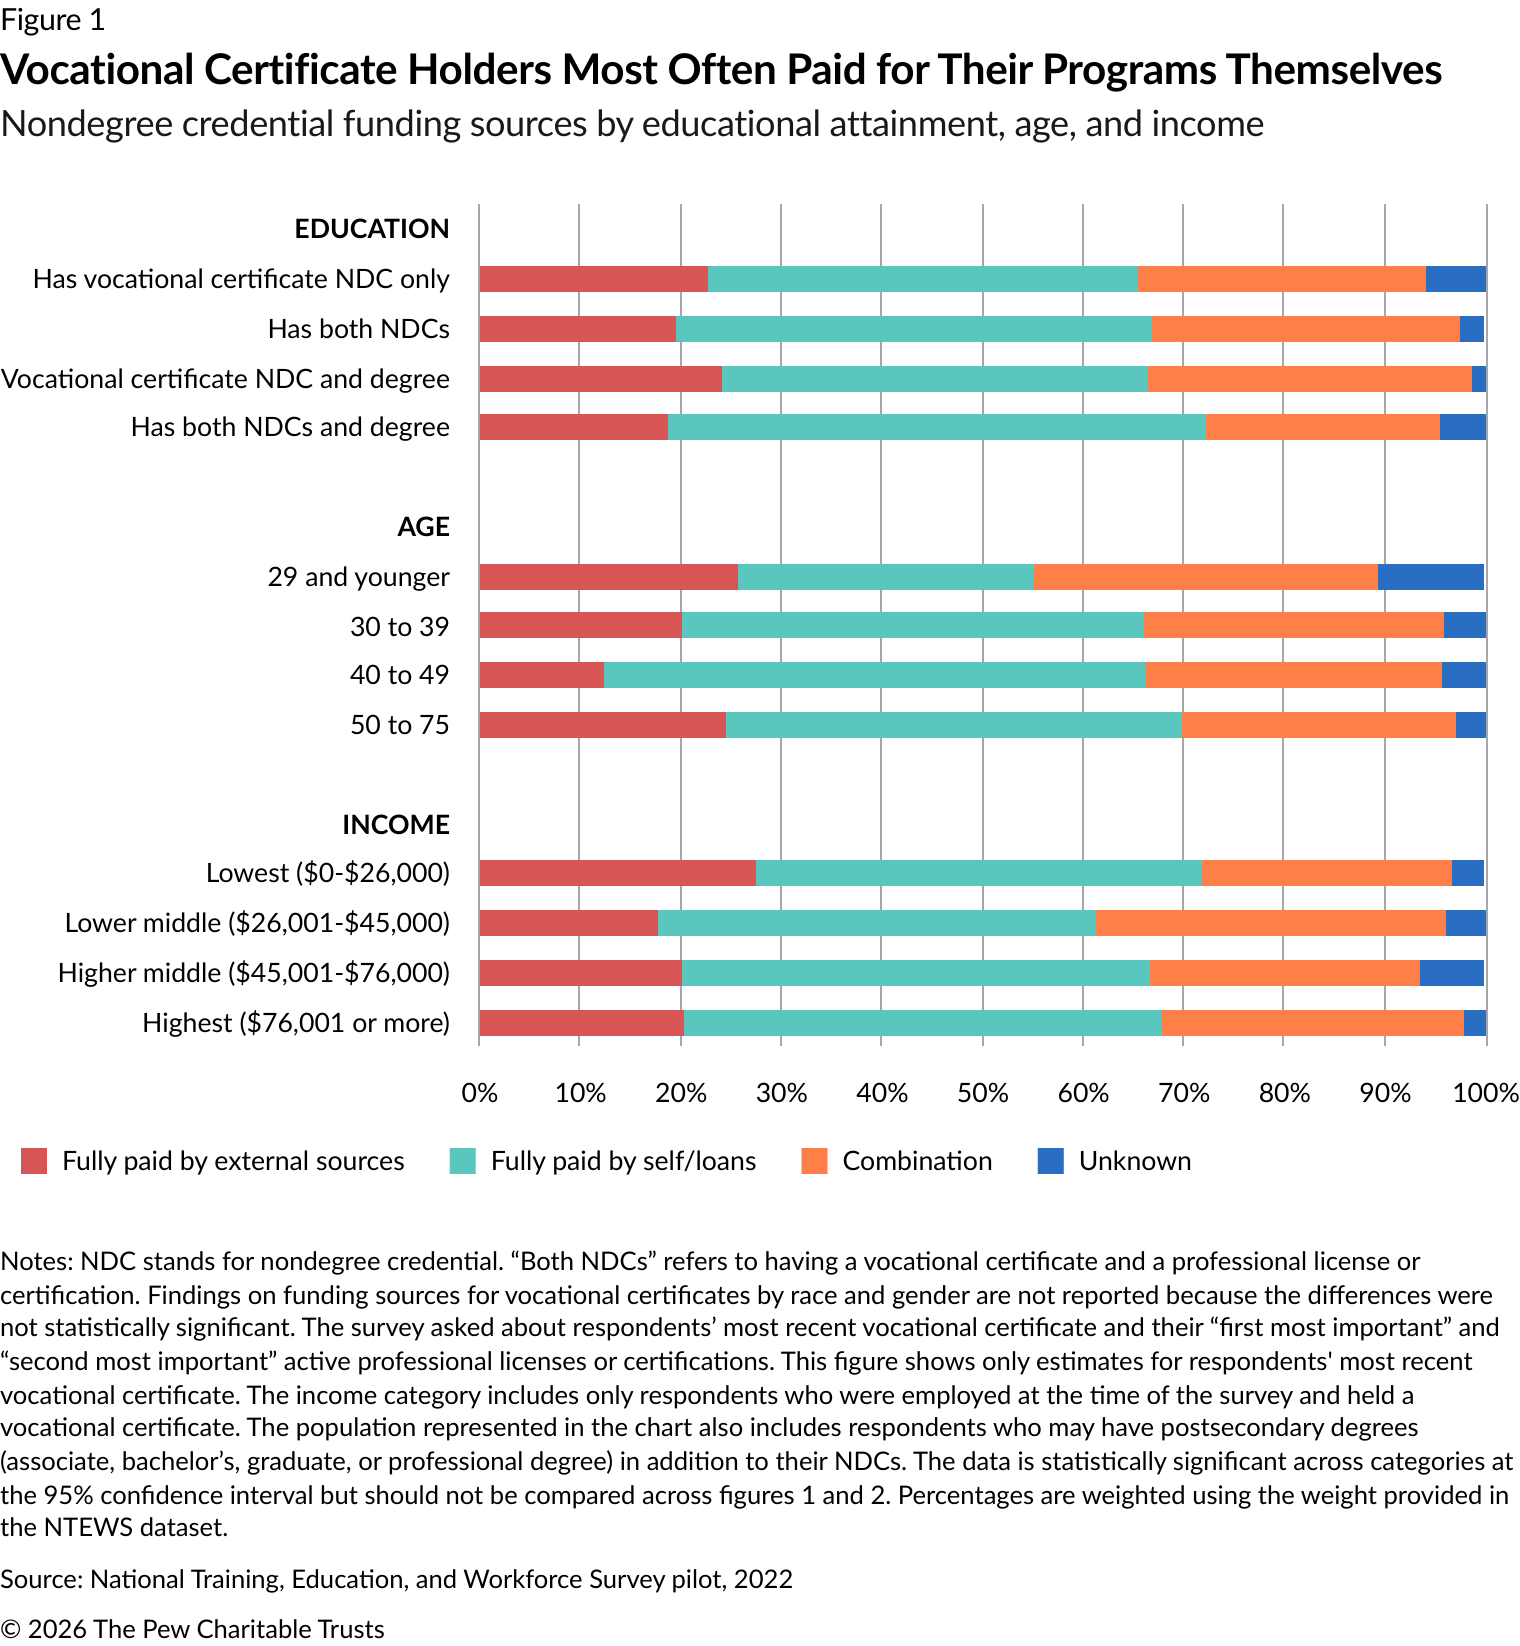
Among respondents who obtained vocational certificates, slight variations existed regarding their educational attainment, age, and income, but the differences were modest (see Figure 1).
Education: Payment patterns varied by educational attainment, but across all educational categories, about 3 out of 4 respondents (72%-77%) paid for their vocational certificate out of pocket, either fully or partially, while fewer than 1 in 4 (19%-24%) reported having it fully paid for by external sources.
Age: Likewise, across age categories, 63%-84% of respondents partially or fully paid for their credential out of pocket. Self-payment rates (partial or full) were particularly high among respondents ages 40 to 49, at 84%.
Income: A similar pattern held across income levels. Although the respondents with the lowest incomes, below $26,000, were more likely than those in other income brackets to have their program costs fully covered by external sources (27%), a large majority (69%) in this category paid out of pocket, with 44% paying the full costs themselves. Meanwhile, nearly half of those in the higher-middle-to-upper-income brackets (47%) paid for their education entirely by themselves. Although respondents with lower incomes were more likely to have their costs fully covered by outside sources, that does not necessarily indicate that NDCs were more affordable for them. For example, they may have had a harder time covering nontuition costs such as food and housing while enrolled.
Licenses and certifications
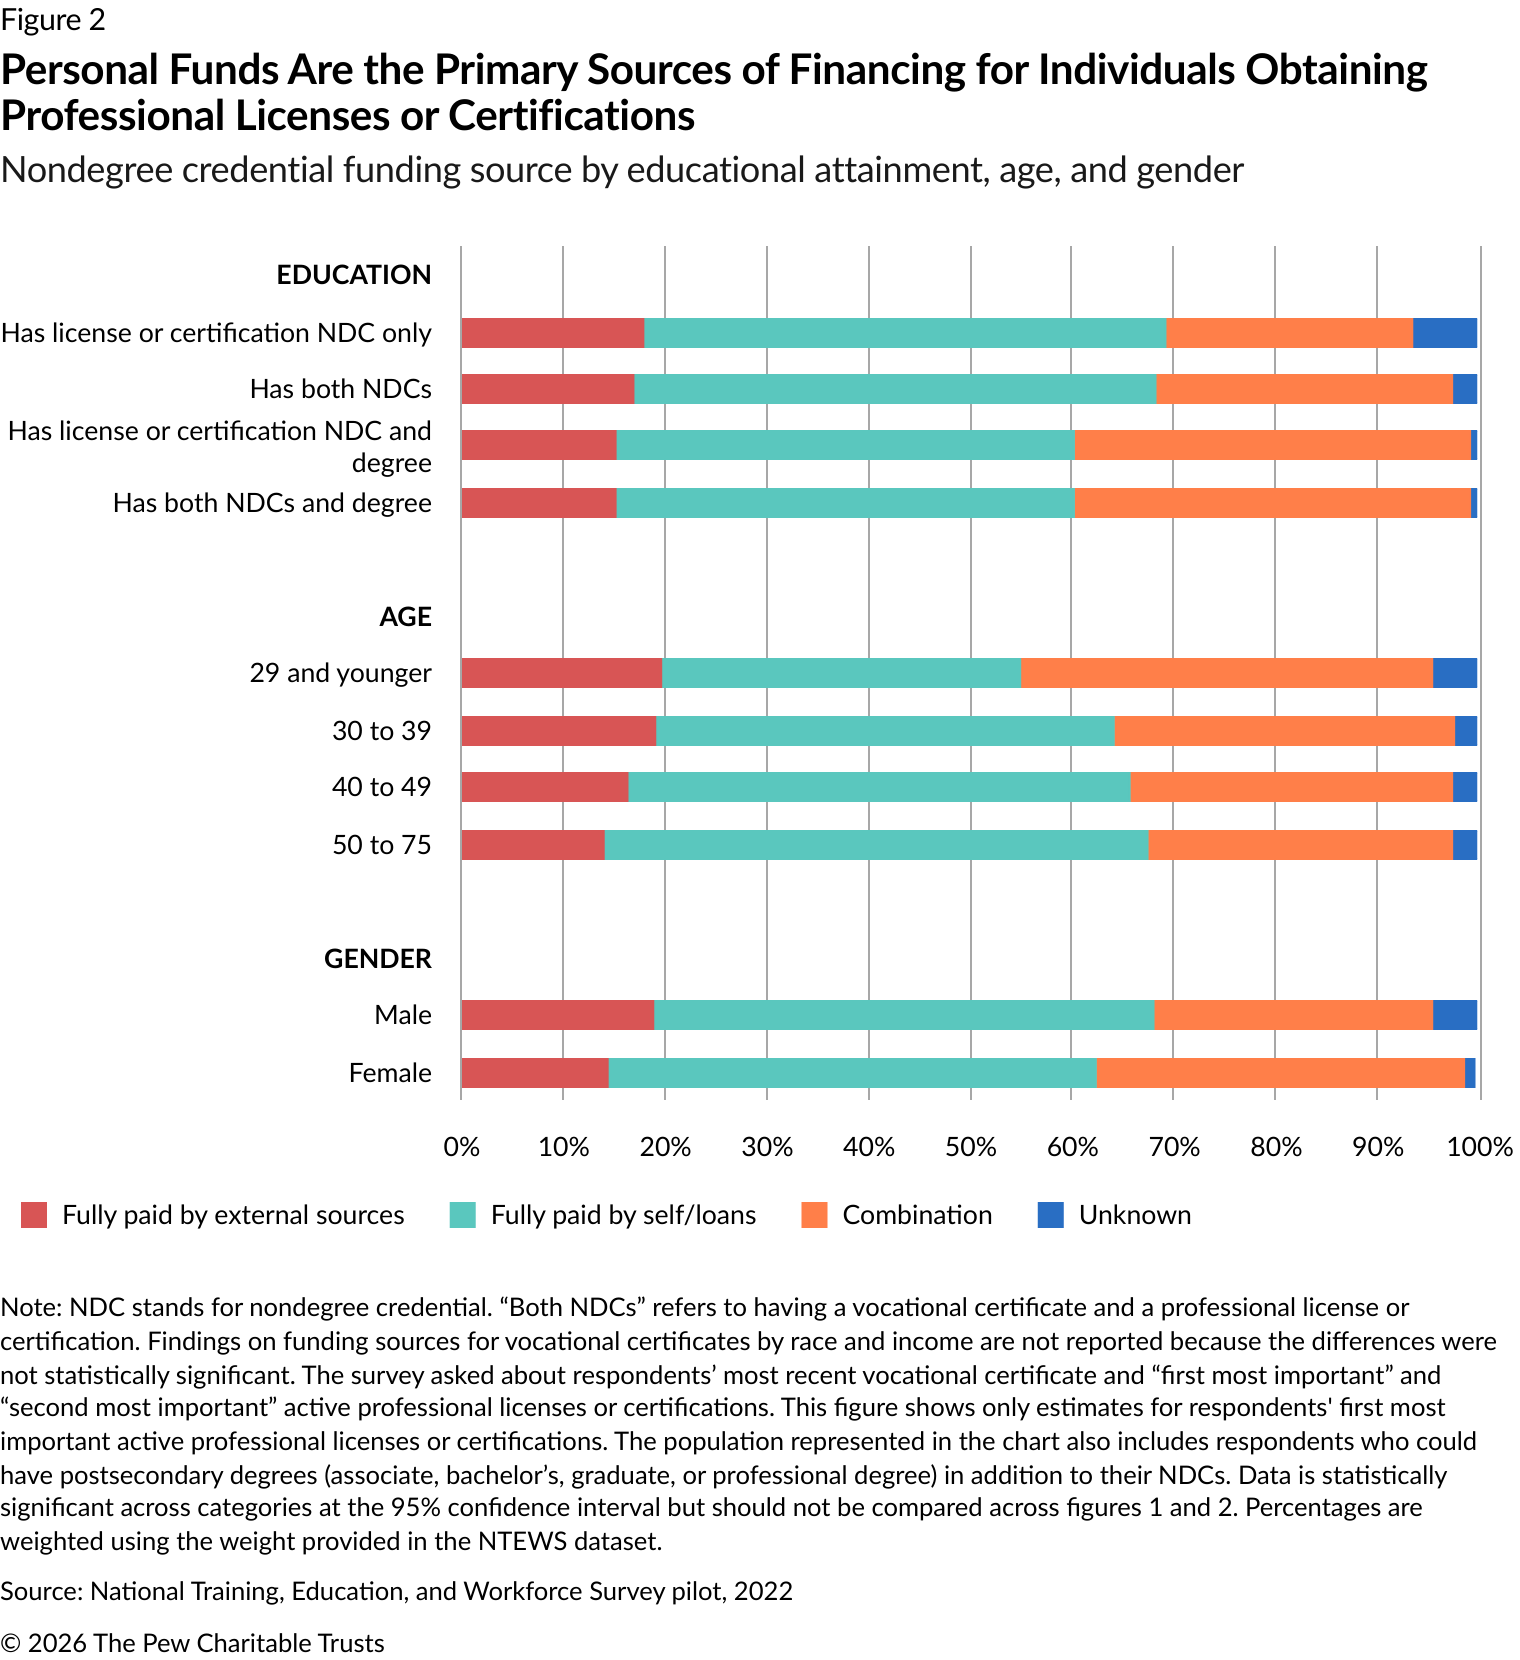
For licenses and certifications, payment patterns varied slightly by educational attainment, age, and gender. However, as with vocational certificates, those differences were modest (see Figure 2).
Education: Licenses and certifications were even more likely than vocational certificates to require out-of-pocket payment from individuals at all educational attainment levels. About 4 in 5 respondents (75%-84%) reported paying for a license or certification out of pocket either partially or fully.
Age: Older respondents ages 50 to 75 were more likely to finance their own license or certification out of pocket or with borrowed money. But across all age categories, a large majority of respondents reported paying for their credential by themselves, either partially or fully (75%-84%).
Gender: Women (84%) were more likely than men (76%) to pay for their license or certification out of pocket, either partially or fully.
Research raises key questions about how students are paying for nondegree credentials
Pew’s ongoing analysis of NTEWS data financing trends shows that most respondents, across demographic groups, pay for their credentials out of pocket. This raises questions about how affordable they are, how self-paying credential holders cover their program costs, whether they are using risky forms of financing, and how that risk affects their financial outcomes, especially for those with low-to-moderate incomes.
Although the payment method categories created for this analysis provide an organized, concise view of funding sources overall, examining individual funding sources could highlight whether variations exist across demographics for those who self-pay to finance their NDCs. For example, research has shown that, in many cases, the hourly cost of attendance for nondegree programs exceeds the minimum wage in most states, raising affordability concerns. In Pew’s current self-pay definition, we include out-of-pocket expenses and accrued debt; one group might be more likely to use available savings while another relies more heavily on borrowing or higher-cost credit, even though both appear as self-pay. Exploring these nuances could give policymakers a truer view of financial well-being versus financial debt.

Similarly, although it is unclear how many NDC students who pay for their credentials use high-cost financing sources such as credit cards, research has found that high-interest funding sources contribute to debt and ongoing financial instability for college students. It is critical to dig deeper to better understand how different groups of credential holders manage program costs and how their experience paying for the credentials may affect their financial and employment outcomes as well as their views on their NDCs’ value. For instance, for low-income respondents whose credential lands them in a low-wage job, any incremental wage increases from earning the credential could be negated by the debt they incurred from paying for it out of pocket via credit cards or loans.
Future Pew research will shed light on the specific payment sources that individuals use to cover out-of-pocket NDC program costs and on the affordability challenges faced by different demographic groups.
This article is the second in a series that will report on findings from the 2022 National Training, Education, and Workforce Survey (NTEWS) pilot, a nationally representative survey of 15,734 respondents ages 16 to 75. The survey was sponsored by the National Center for Science and Engineering Statistics (NCSES) within the National Science Foundation and the National Center for Education Statistics (NCES) and was administered by the U.S. Census Bureau. NCSES designates the NTEWS pilot as an experimental statistical product, produced to benefit users in the absence of other relevant information and to improve future data collection. This product may not meet some of NCES’ quality standards. The findings from this analysis should not be used to make official statements or inferences about characteristics of the population or economy. This survey is the only nationally representative data source for many key indicators of credential attainment. The dataset was downloaded from the NCES website on Feb. 2, 2025, and can be accessed here.
Janette Barbosa is a senior associate with The Pew Charitable Trusts’ quality skills and educational pathways project.
People