States Fall Short of Funding Needed to Keep Roads and Bridges in Good Repair
Lessons from Transportation Asset Management Plans

Overview
Roads and bridges in the United States are a vital part of daily life, connecting people to jobs, schools, homes, and services and supporting nearly $19 trillion in freight each year.1 In fiscal year 2024, the latest year for which data was available, states spent about $247 billion—roughly 8% of their total expenditures that year—on these roadway assets.2
Yet even with those hundreds of billions spent, many states and localities struggle to make the investments necessary to preserve and maintain their transportation systems, a situation that in turn threatens economic development, the safety of millions of drivers and residents, and the long-term sustainability of public budgets. One factor in these investment challenges is a persistent lack of consistent data on infrastructure conditions and spending needs, which—despite recent improvements in disclosure thanks to federally mandated reporting— has hindered policymakers’ ability to fully assess these capital assets, make spending decisions, and ensure public accountability and transparency.3
To better understand the scale of the data and investment issues, The Pew Charitable Trusts analyzed information from all 50 states’ most recent Transportation Asset Management Plans (TAMPs), largely released in 2022. These reports, which are a requirement for states receiving federal National Highway System (NHS) funding, help state departments of transportation (DOTs) assess the condition of their NHS roads and bridges and implement performance-based asset management practices.4 Although state DOTs vary in which roads and bridges they analyze, how they define and measure roadway conditions, and what types of information they provide, TAMPs nevertheless provide key insights, such as whether state policies will ensure that transportation infrastructure is maintained in good condition or push the cost of roadway maintenance and repair to future budgets.
Most TAMP reports include a gap analysis that projects the condition of key roads and bridges over 10 years and compare that with what the state has determined as a “state of good repair” (SOGR)—a benchmark of an adequate condition for public roads and bridges—to determine whether they will achieve an SOGR over the next 10 years. Pew designates states that expect to fall short of their SOGR benchmarks as having a “condition gap.” Additionally, some states include 10-year projections of the funding necessary to maintain NHS and other state roadways at the state’s SOGR, as well as expected investments in those roads and bridges and the difference between needed and anticipated spending. Pew identifies states with an investment shortfall as having a “funding gap.” (See the separate methodology and information on sources for more information.) The key findings from Pew’s analysis are:
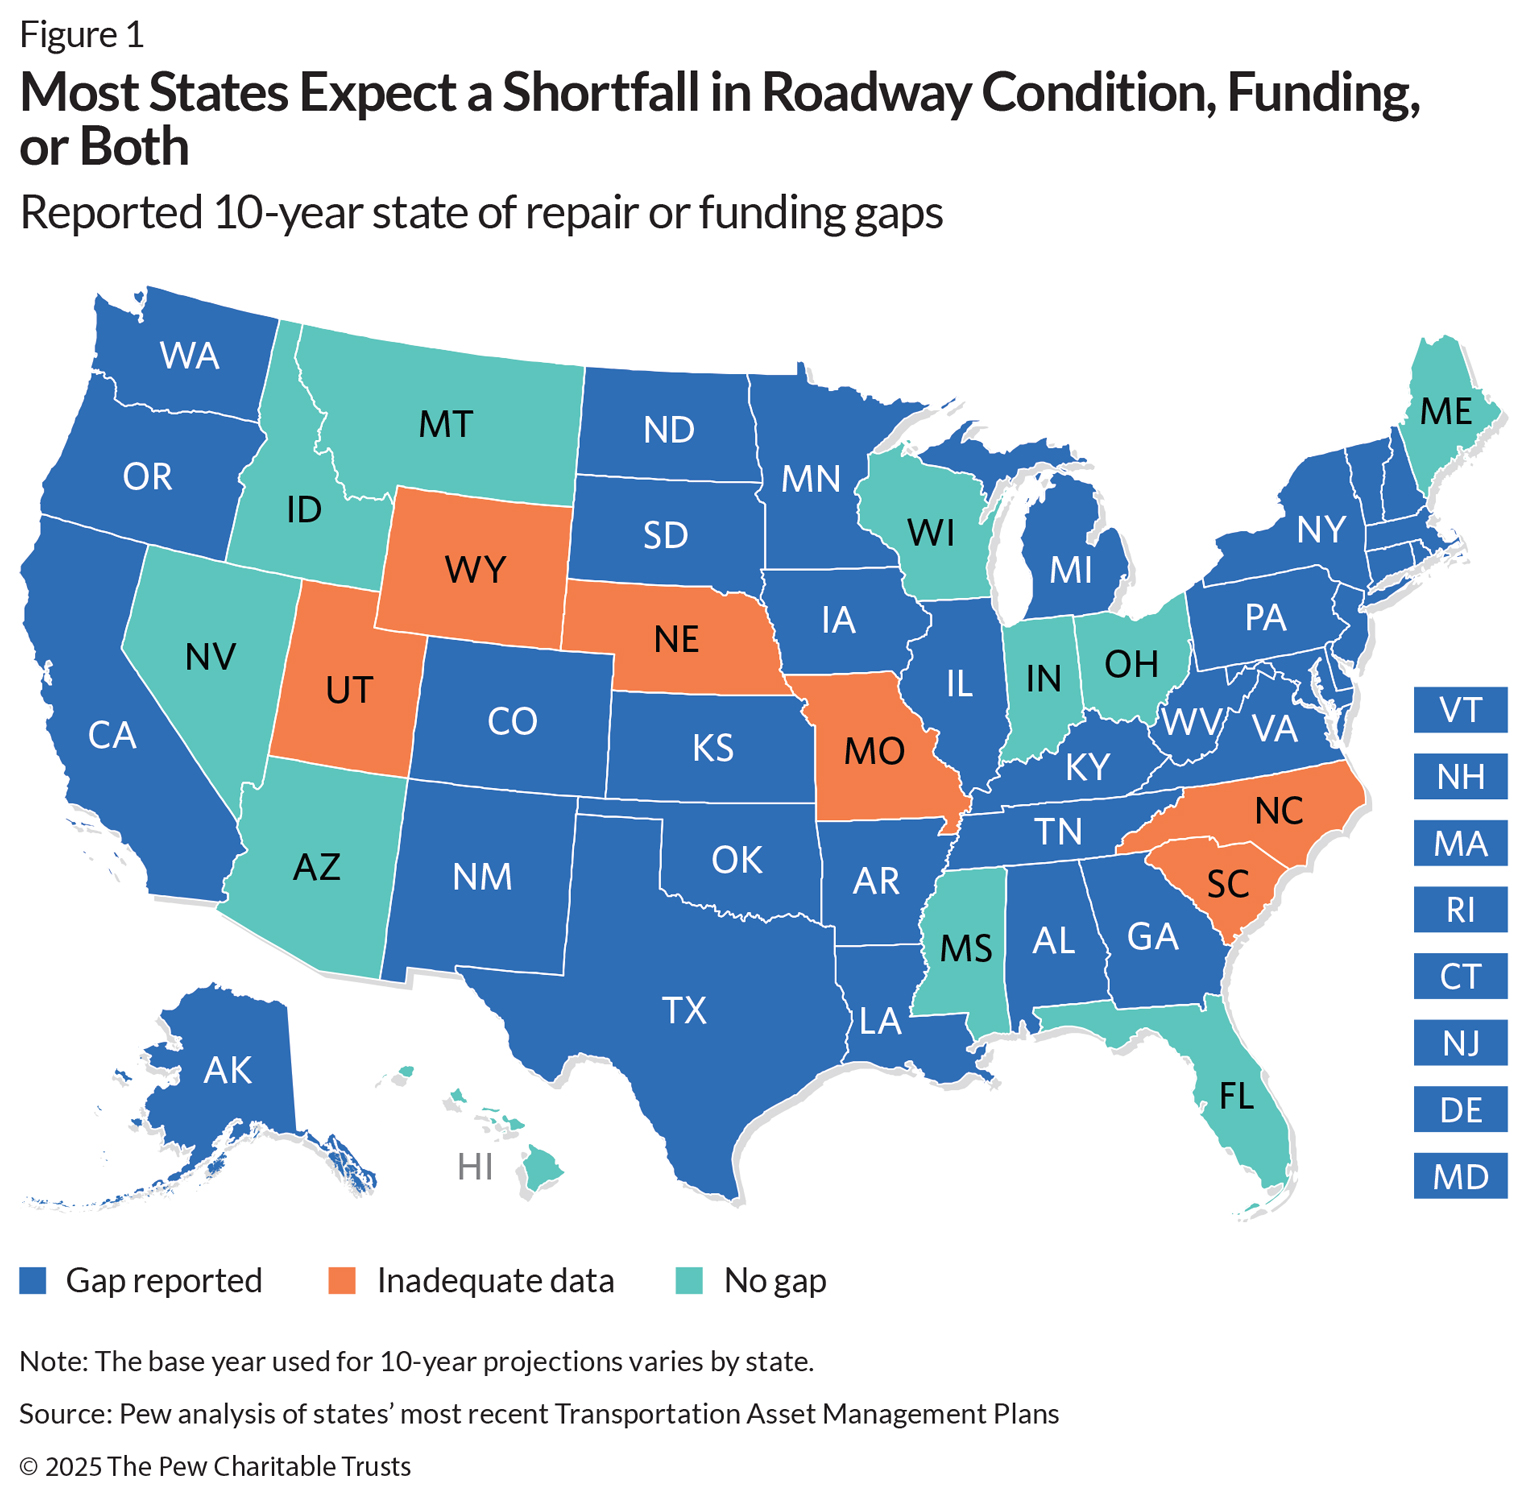
- 33 states expect to miss at least some of their benchmarks for roadway conditions, preservation and maintenance funding, or both over the next decade. Just 11 states are on track to meet their funding and condition goals for both roads and bridges. The remaining six states did not have adequate information to assess whether they will meet their targets or face gaps.
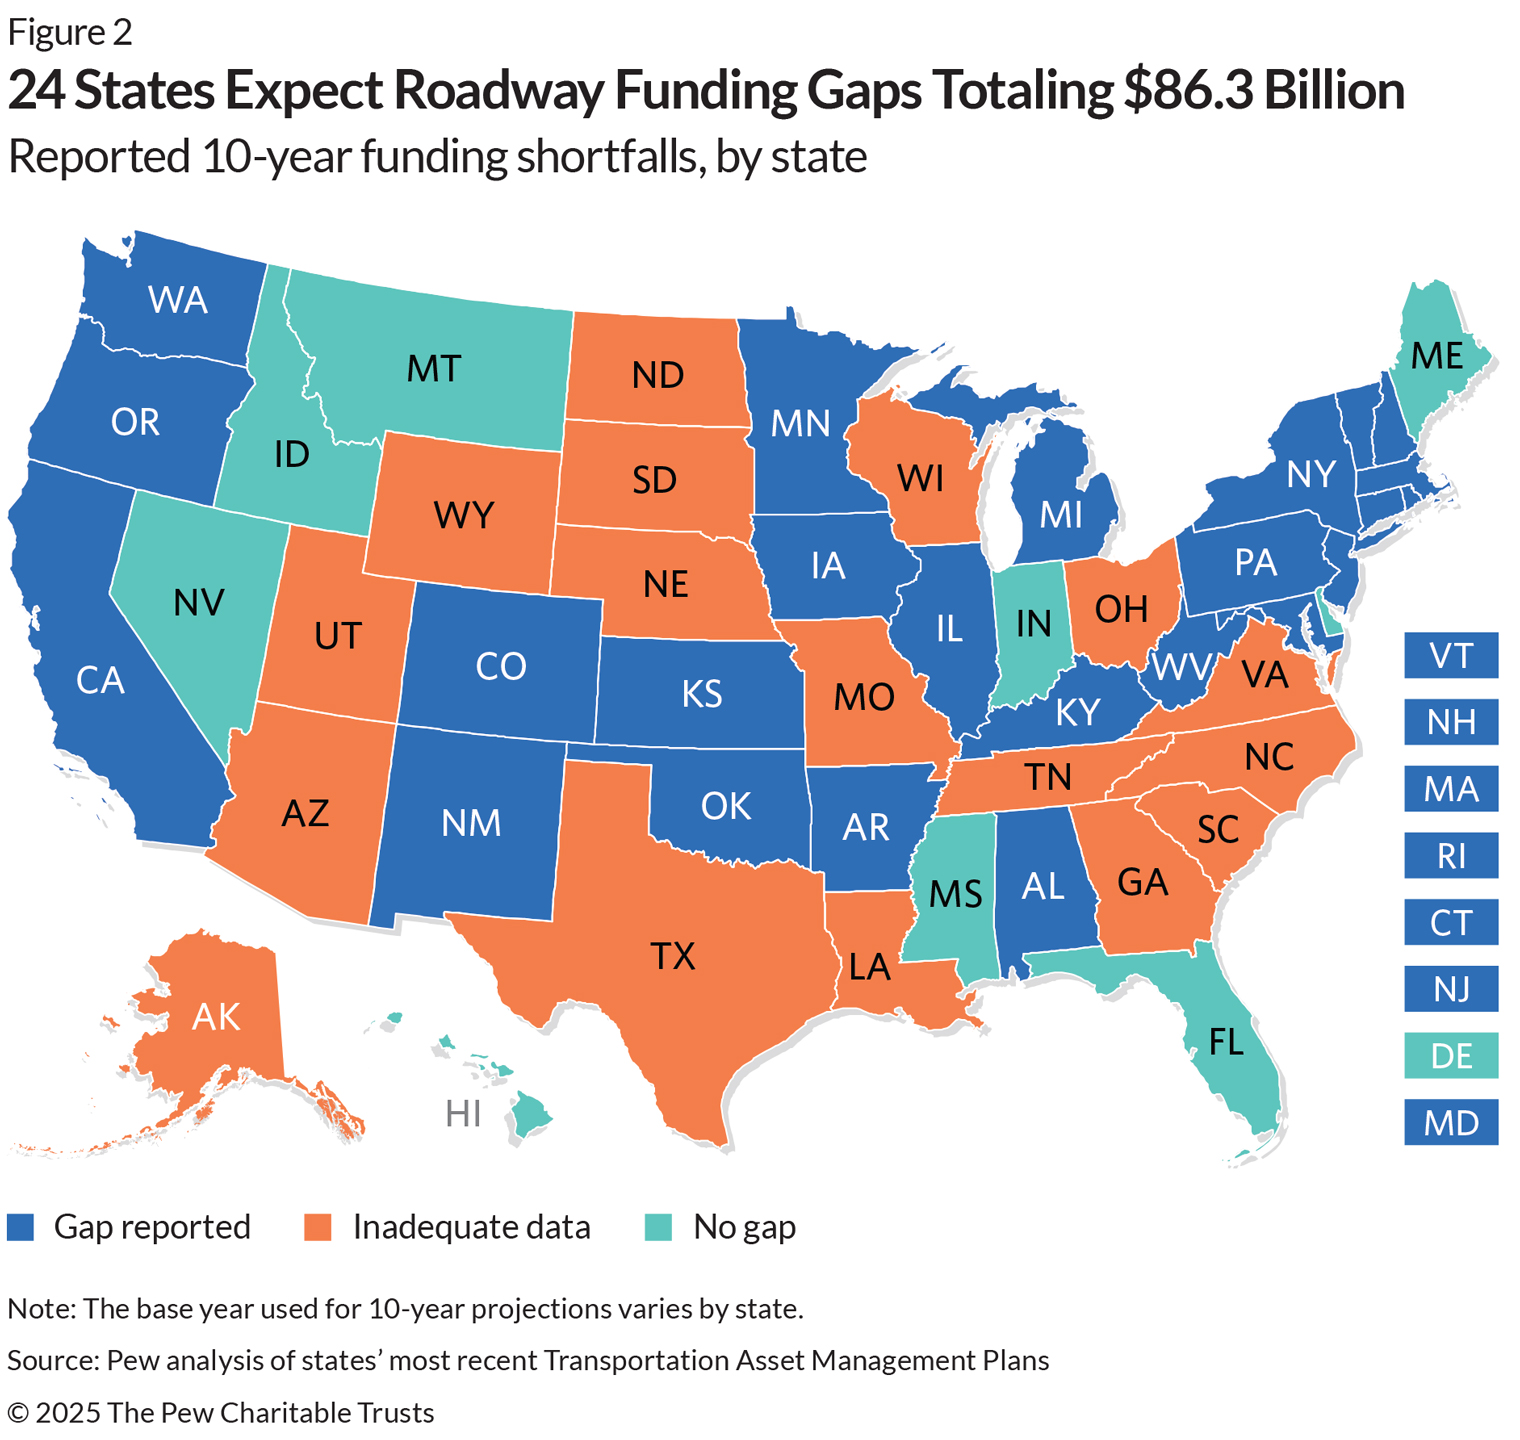
- 24 states reported a combined $86.3 billion funding gap over 10 years. These states already expect to collectively spend $194 billion on TAMP roads and bridges over the next decade and would need to increase spending by 44% to reach the $280 billion required to close the shortfall. Only nine states projected adequate funding, and 17 did not report sufficient information to evaluate whether their spending would be sufficient. Because TAMP reporting requirements cover only NHS roads and bridges—though some states voluntarily report on all state roads—the total funding gap excludes the bulk of the shortfall for non-NHS roadways.
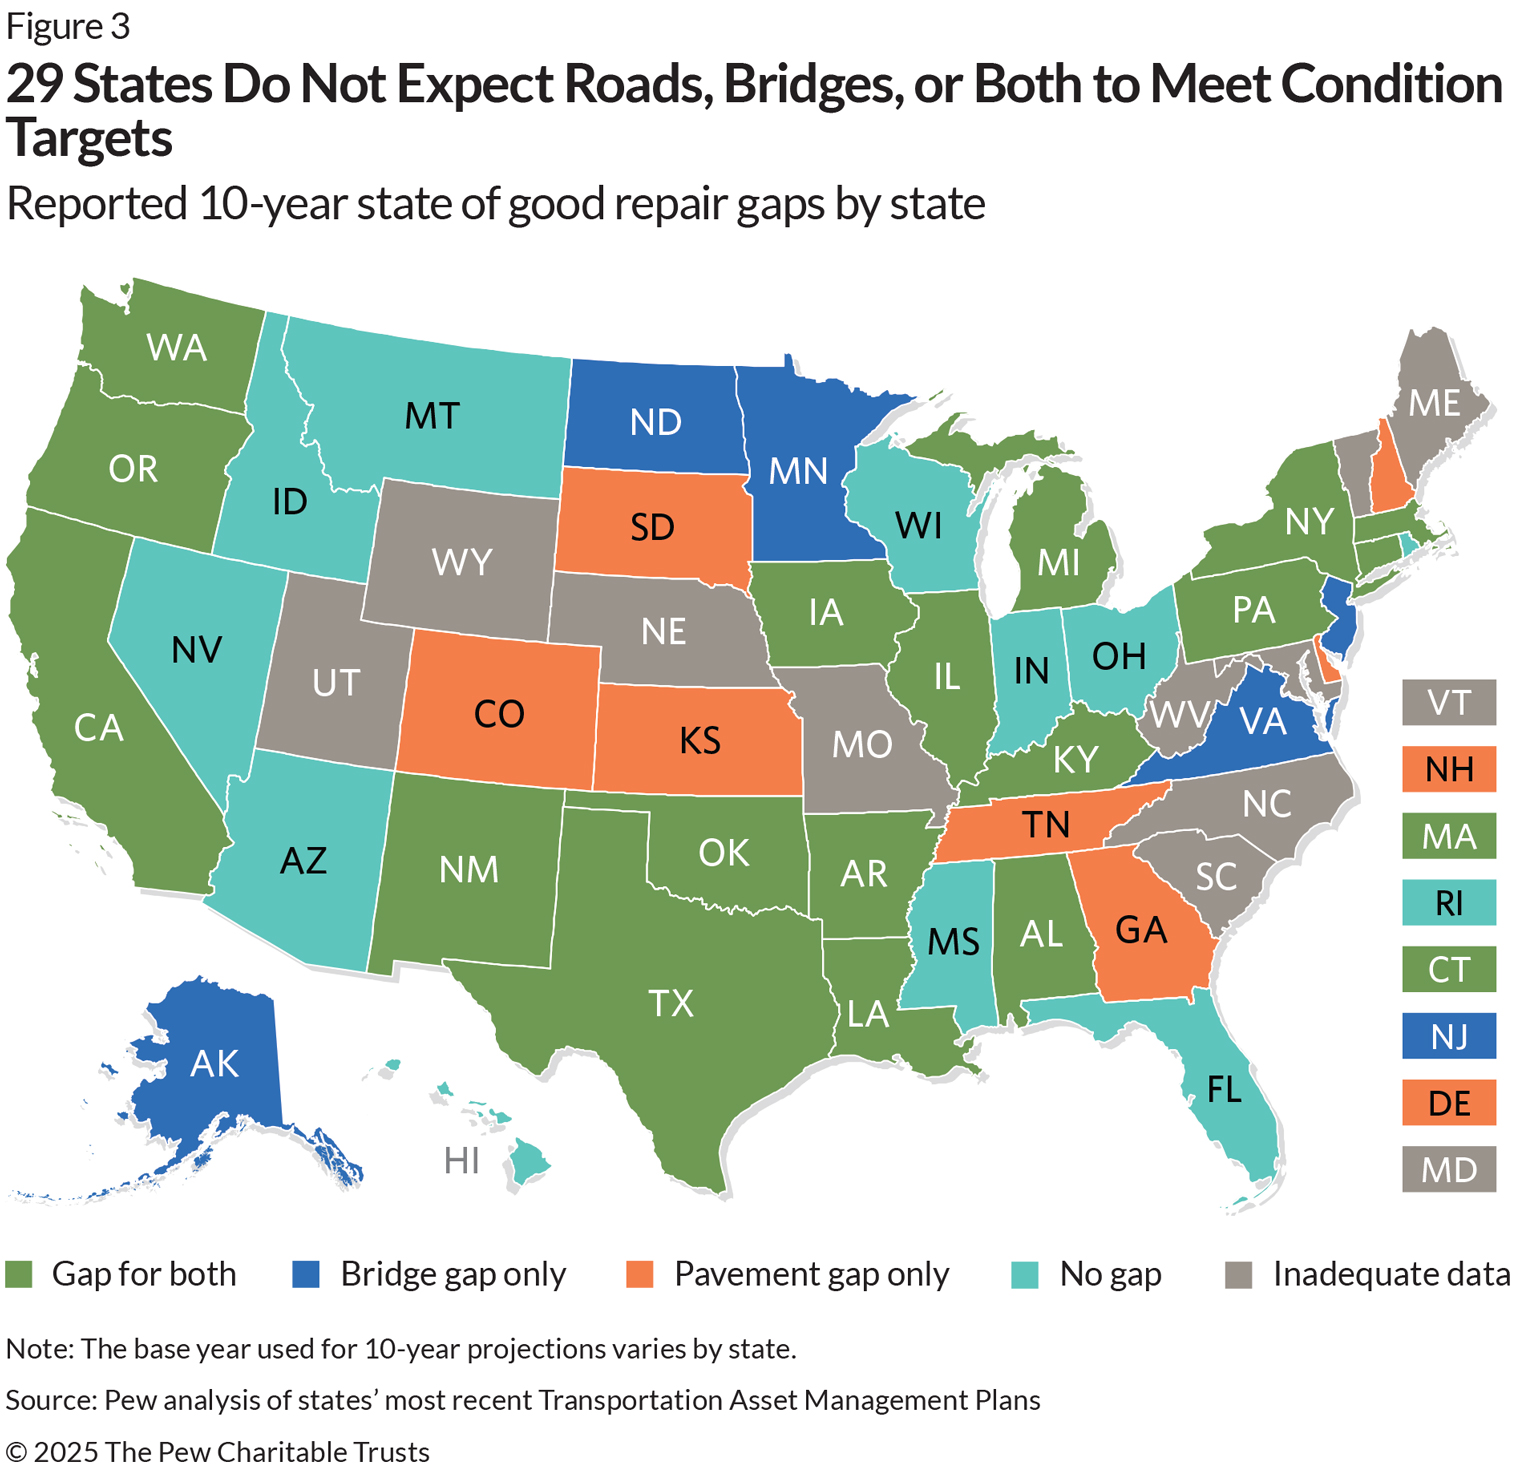
- 29 states projected a condition gap for their roads, bridges, or both over 10 years. Eleven states projected that their roads and bridges would meet condition benchmarks, and 10 had missing or incomplete data.
- TAMP reporting offers an opportunity for states to better understand and budget for roadway preservation and maintenance. Although a persistent lack of comprehensive data is a barrier to fully assessing the gaps that states face, the TAMPs offer important insights drawn from states’ data and analyses about how states manage roads and bridges. State policymakers can use these reports to ensure that their budgeting and transportation spending decisions will be sufficient to resolve projected funding and condition gaps and avoid future shortfalls.
- Pew recommends that states improve reporting and use that information to make informed decisions. Changes, such as reporting data on non-NHS as well as NHS roadways and using clear reporting standards, can provide critical information for policymaking. Examples from states offer ways to make transportation reporting more consistent, comprehensive, and current so that the information can guide decision-making and improve transparency.
This report reveals significant fiscal and roadway asset management challenges facing states, but it also highlights the value of improved disclosure and reporting as a result of the TAMP mandate: Being able to identify a problem is the first step to being able to sustainably address it.
States project transportation infrastructure maintenance shortfalls
Pew’s research found that most states expect a shortfall over the next decade in their ability to repair, rehabilitate, and preserve their NHS roads and bridges as well as other state and local roadways included in their TAMP reports. (See Figure 1.) Thirty-three states included information in their TAMPs indicating gaps in funding, condition, or both for their NHS and other roads and bridges; 11 had data projecting that they would meet their SOGR benchmarks and anticipated no funding shortfalls; and six lacked adequate data to make those assessments.
Some states compared projections of capital expenditures needed to preserve roads and bridges with expected investments in preservation, repair, and rehabilitation to determine whether the state faces a funding gap. Other states compare the expected conditions of roads and bridges with what the state DOT considers an SOGR to identify possible condition gaps. Twenty-seven states provide both comparisons to help policymakers and stakeholders understand whether current policy will adequately preserve the roads and bridges that state residents rely on.
Funding gaps
The federal government requires that state TAMPs describe DOT processes for developing their 10-year financial plans and investment strategies, including projected costs and available funding for future work.5 Thirty-five states provided sufficient details about their investment strategies to assess whether expected investments will be sufficient to fund the preservation and repair of roads and bridges and avoid deferred maintenance—the difference between what should have been invested to maintain and repair public infrastructure and what was actually spent—or will lead to funding gaps that burden future budgets and leave roadways in poor condition.
The TAMP data shows that most of those states face substantial shortfalls, with 24 states reporting funding gaps for roads, bridges, or both totaling $86.3 billion over 10 years, or $8.6 billion annually. (See Figure 2.) Based on TAMP reporting, these states expected to spend $194 billion on roads and bridges covered by the TAMP, so filling the gap would require a 44% increase over current spending projections. On average, each of those states would need to invest nearly $359 million annually in addition to what they already expect to spend to get back on track with necessary maintenance and preservation of transportation infrastructure.
Of the 24 states reporting funding gaps, three expected adequate funding for roads but not bridges, and three others forecast sufficient investments for bridges but not roads. Arkansas and Pennsylvania provided a combined funding gap for roads and bridges. The remaining 16 states had funding gaps for both categories of transportation assets. And nine states—Delaware, Florida, Hawaii, Idaho, Indiana, Maine, Mississippi, Montana, and Nevada— reported no funding gaps.
Notable state funding gaps include the following:
- Michigan reported the largest road funding gap at $15 billion between expected spending of $9.2 billion and needed investments in TAMP roads of $24 billion.6
- New York had the largest bridge gap, totaling slightly more than $11 billion. The state’s DOT estimated that $17 billion would be needed over 10 years to meet condition goals for bridges but that only $6 billion in funding would be available over that period.7
- Kansas had the smallest reported funding gap of $60 million.8
- Arkansas and Pennsylvania reported total funding gaps of $1.7 billion and $8.2 billion, respectively, but did not provide data broken down by asset category.9
Some TAMPs indicated that funding will be insufficient but did not provide an assessment of how much more funding will be needed. For instance, Louisiana’s 2022 TAMP showed that current funding will lead to a significant decline in the condition of NHS bridges, with more than 20% of the deck area in poor condition by 2034, and even a $200 million increase in annual bridge funding would be insufficient to halt that trend. Based on these projections, Louisiana’s bridge funding gap from 2021 through 2030 would exceed $2 billion, but the report does not provide sufficient data to support an assessment of how much additional investment would be needed to close the gap.10
What should policymakers take away from the prevalence and size of funding gaps for TAMP roads and bridges? First, the $86 billion gap probably represents a subset of the total shortfall. The 34 states that report on funding had combined spending on roads and bridges covered by the TAMP of $194 billion over 10 years, or just $19.4 billion annually. That is just a fraction of state capital outlays for highways, which totaled approximately $82.7 billion in 2022 according to Federal Highway Administration (FHWA) data (capital outlays for local roads totaled another $45 billion).11
Second, having identified a gap, the next step is to figure out how to sustainably address that funding shortfall. At the federal level, these findings can inform decisions about surface transportation spending as well as the value of federal reporting requirements in making information available on the adequacy of preservation and maintenance efforts for NHS roads and bridges.
For state policymakers, funding and condition gaps indicate that existing revenues and fees from both state sources and federal transportation spending are insufficient to meet transportation goals. A range of strategies is available to fill these gaps—such as increasing gasoline and diesel taxes, prioritizing maintenance and preservation over new construction, levying additional fees, using general fund revenues, issuing bonds, or adding user charges—and policymakers can look to TAMPs and other analyses for important insights into the scale of the challenge and the effectiveness of various solutions.12
Condition gaps
Federal regulations require states to conduct condition gap analyses for NHS roads and bridges by setting and reporting SOGR targets; project whether existing policies are sufficient to meet those goals over two- and four-year windows; and, where gaps exist, outline strategies to close them.13 States typically define SOGR targets in terms of two key metrics. For road pavement, most states use the federal government’s condition measures that evaluate roughness, cracking, and faulting to categorize roads as being in good, fair, or poor condition.14 And for bridges, most rely on the National Bridge Inventory rating scale, which assesses the condition of key bridge features, such as the deck, superstructure, substructure, and culverts.15
Beyond the required two- and four-year analyses, 40 TAMPs included 10-year condition projections for both roads and bridges that allow time for states that have deficient infrastructure to get back on track and better show which states’ policies are insufficient to maintain roadways even at current condition levels. Of those 40 states, 17 identified condition gaps for road and bridge conditions, 12 reported gaps for either roads or bridges, and 11 expect to meet their targets. The remaining 10 states lacked sufficient data in their TAMPs to evaluate their progress. (See Figure 3.)
New Mexico reported significant condition gaps for roads and bridges, indicating long-term challenges in maintaining transportation assets under its current policies. The state set a 10-year goal of having no more than 1.4% of its interstate pavement lane miles—a calculation that multiplies each mile of roadway by the number of lanes on the road—in poor condition but instead expects the figure to be 5.6%, for a gap of 4.2%—the nation’s largest such shortfall. For bridges, the state’s goal was to have 50.4% of surface area in good condition, but its projection is for only 26.8%, resulting in an expected shortfall equal to 23.6% of bridge surface area, the largest gap based on a good condition target.16
Other notable condition gaps include the following:
- Connecticut has the largest gap for interstate pavement in good condition, needing a 31.2-percentage-point increase in the share of line miles in good condition to meet the state target.17
- Arkansas shows the biggest gap for non-interstate pavement in good condition, with 46% of lane miles below the target condition.18
- New York reports the largest gap for non-interstate pavement in poor condition, with 27.6% of lane miles in poor condition compared with a target of 8%.19
- Oklahoma had the largest gap for bridges in poor condition, exceeding the state’s target by 5.4% of bridge deck area.20
Some states’ projections show significantly larger shortfalls in road conditions for non-interstate NHS roads compared with interstates. For instance, Arkansas had a gap of only 4 percentage points in the share of its interstate pavements in good condition, but a 46-point gap for non-interstates. And New York had a gap of 3.4% of interstate lane miles in poor condition versus 19.6% of non-interstate lane miles.
Funding and condition analyses can differ
State DOTs have a great deal of flexibility in defining the benchmarks, level of detail, and metrics used to measure conditions and needs in their TAMPs. As a result, a state can have a condition gap even if overall funding is adequate or it may have a funding gap while still achieving its condition targets. For example, Rhode Island reported no condition gap for TAMP pavement, based on an analysis that focused on whether the state would meet its SOGR objectives over 10 years, while also projecting a $624 million 10-year funding gap for maintenance, preservation, repair, and reconstruction. The report explains that although the state’s current spending would not cause pavement conditions to fall below targets over the 10-year period, it would result in underinvestment in pavement preservation overall, which in turn would lead to “accelerated pavement deterioration” and higher associated future costs.21 In essence, the condition analysis evaluated— and documented success for—a narrower target than did the funding analysis, which shows a shortfall in meeting long-term needs.
Delaware based its pavement funding gap analysis on the overall condition of the highway system. The state’s 2022 TAMP found “no significant gaps projected for state targets” for pavement under a “baseline funding scenario.” But the condition analysis indicated that condition targets for certain categories of roads were not being met, even though pavement funding needs were being met as a whole. As a result, the TAMP showed a pavement condition gap but no associated funding gap.22
Although such analytical inconsistencies can make comparisons across states more difficult, they can potentially make the analyses more applicable to the questions that a state’s policymakers and stakeholders need answers to.
State reporting and data vary, should be improved
States vary in what they analyze and present in their TAMPs. Detailed, consistent, and policy-relevant information can offer policymakers and stakeholders additional guidance and better inform decisions than just summary numbers. Offering year-by-year projections, breaking the data down into important categories of road and bridge maintenance and preservation, and assessing different potential strategies are examples of useful state reporting practices.
By sharing effective analytical models and promising reporting practices from states throughout the country, Pew’s examination of TAMPs can help state DOTs learn from each other and present more comprehensive, consistent information to better inform policymakers, stakeholders, and the public.
Investment reporting
Some states focus simply on reporting annual needed and expected investments under their current strategy. New Jersey, for instance, projected in the state’s 2022 TAMP that achieving a state of good repair for state highway system (SHS) bridges would require an average annual investment of $790 million through 2032 but with actual average annual investments of $755 million over the same period. (See Table 1.) In aggregate that means that the state expects a $35 million annual funding gap based on anticipated needs and available funding under current policy.
Table 1
New Jersey Documents Annual Costs to Reach State of Good Repair for Bridges
State’s estimated and expected investments and projected shortfall under current SOGR policy, by fiscal year, in millions of dollars
| Needed for SOGR | Investment strategy | Gap | |
|---|---|---|---|
| 2023 | $900 | $900 | $0 |
| 2024 | $700 | $665 | $35 |
| 2025 | $910 | $875 | $35 |
| 2026 | $655 | $615 | $40 |
| 2027 | $805 | $765 | $40 |
| 2028 | $850 | $810 | $40 |
| 2029 | $660 | $620 | $40 |
| 2030 | $830 | $790 | $40 |
| 2031 | $625 | $580 | $45 |
| 2032 | $985 | $940 | $45 |
| Average | $790 | $755 | $35 |
Note: New Jersey’s SOGR target for bridges is to have 94% of deck area in at least “fair” condition. The table does not reflect an additional $45 million for “inspections, administration of the bridge management system, and management of other structures (culverts, sign structures, etc.).” Averages have been rounded to the nearest $5 million.
Source: New Jersey Department of Transportation, New Jersey Transportation Asset Management Plan, 2022
By contrast, Washington uses a more detailed projection, showing needs and planned investments broken down between “operational maintenance,” which covers basic work to prevent roads from crumbling prematurely but does not extend their useful life, and “capital preservation,” which includes preservation and rehabilitation (these do extend asset lifespans) as well as replacement when appropriate. (See Table 2.) Compared with New Jersey’s approach, this reporting method provides greater specificity for policymakers and the public, showing that Washington expects to pay the full anticipated costs for operational maintenance but faces a funding gap of $1.44 billion through 2031 for capital preservation.
Table 2
Washington Provides Detail on Pavement Needs, Planned Investments
10-year expected and required spending for state-owned assets, in millions of 2021 dollars, 2022-31
| 2022 | 2023 | 2024 | 2025 | 2026 | 2027-31 | Total | ||
|---|---|---|---|---|---|---|---|---|
| Pavement 10-year average need | ||||||||
| Capital preservation | $318 | $318 | $318 | $318 | $318 | $1,590 | $3,180 | |
| Operational maintenance | $38 | $38 | $39 | $39 | $39 | $204 | $397 | |
| Pavement 10-year planned spending | ||||||||
| Capital preservation | $186 | $177 | $177 | $168 | $168 | $863 | $1,739 | |
| Preservation | $30 | $28 | $28 | $27 | $27 | $138 | $278 | |
| Rehabilitation | $104 | $99 | $99 | $94 | $94 | $483 | $973 | |
| Replacement | $52 | $50 | $50 | $47 | $47 | $242 | $488 | |
| Operational maintenance | $38 | $38 | $39 | $39 | $39 | $204 | $397 | |
| Total need | $356 | $356 | $357 | $357 | $357 | $1,794 | $3,577 | |
| Total spending | $224 | $215 | $216 | $207 | $207 | $1,067 | $2,136 | |
| Investment gap | -$132 | -$141 | -$141 | -$150 | -$150 | -$727 | -$1,441 | |
Note: “Operational maintenance” refers to activities that affect the short-term conditions of the assets, while “preservation,” “rehabilitation,” and “replacement” align with FHWA activity types.
Source: Washington State Department of Transportation, Washington State Transportation Asset Management Plan, 2022
Condition reporting
Importantly, states differ not only in the benchmarks they set for their roadway conditions but also in the way they report their analyses. Some states provide year-over-year analyses of projected conditions for the 10-year TAMP period while others more explicitly tie their condition forecasts to funding needs.
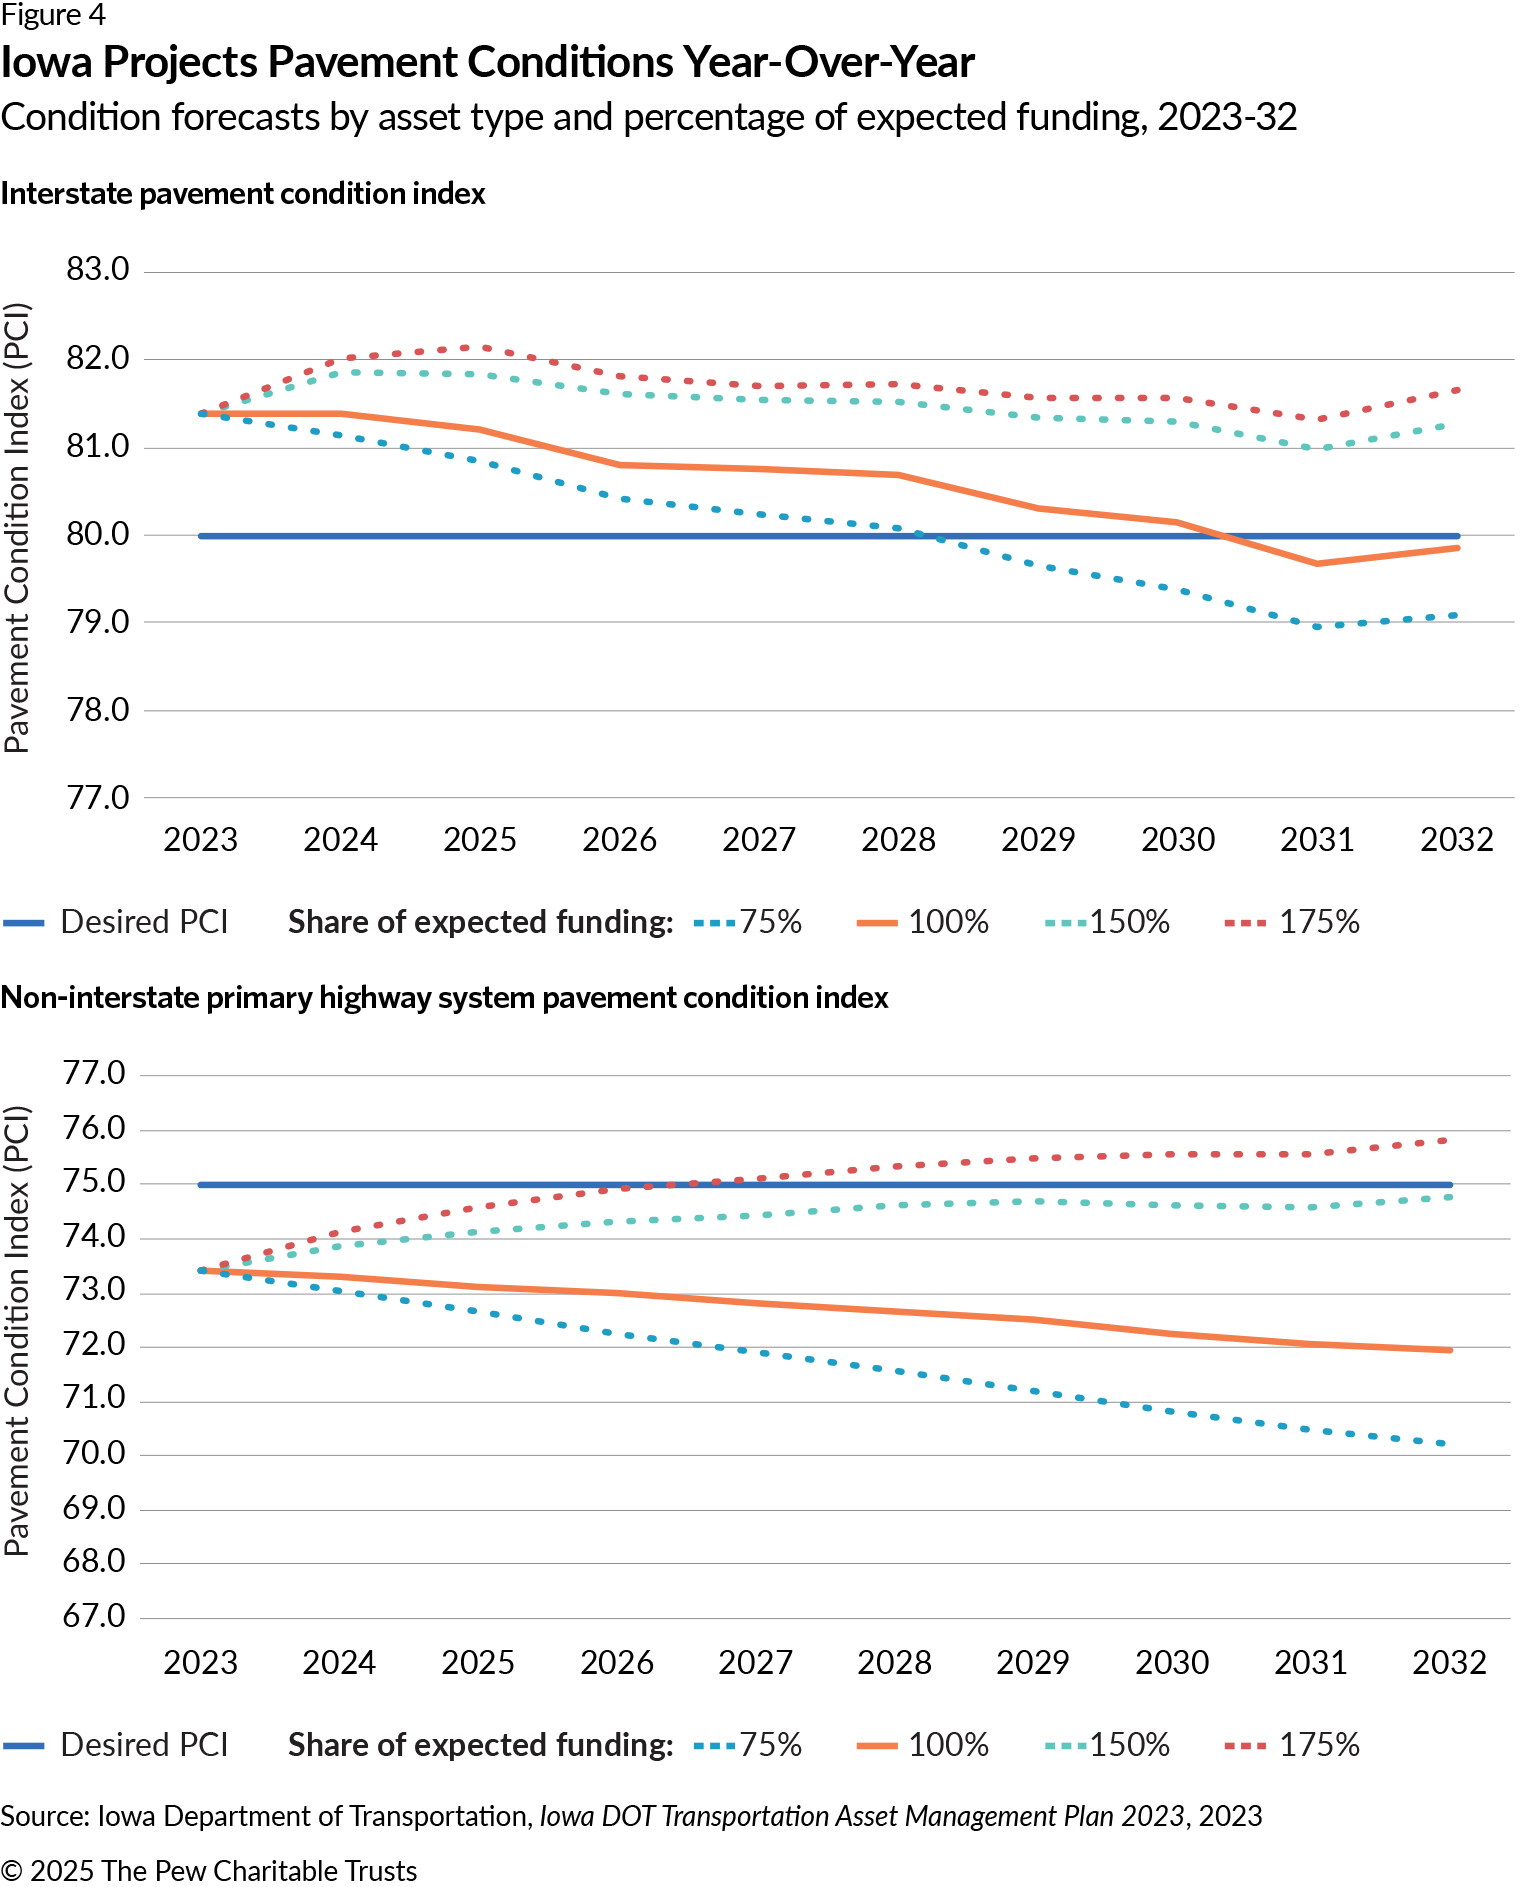
Iowa, for example, includes a thorough year-over-year projection of pavement conditions broken down by interstate versus non-interstate NHS and using the Iowa Pavement Condition Index (PCI), a measure of roadway distress, to assess condition levels and targets.23 The state also includes projections using current funding levels as well as possible higher and lower levels of investment in roads and bridges, showing how each would affect the PCI ratings. The findings show interstate roads ending up slightly below the target PCI of 80 and non-interstate roads with significant declines. It further shows that a 50% boost in funding would still leave non-interstate roads below the PCI target of 75. (See Figure 4.)
Assets assessed
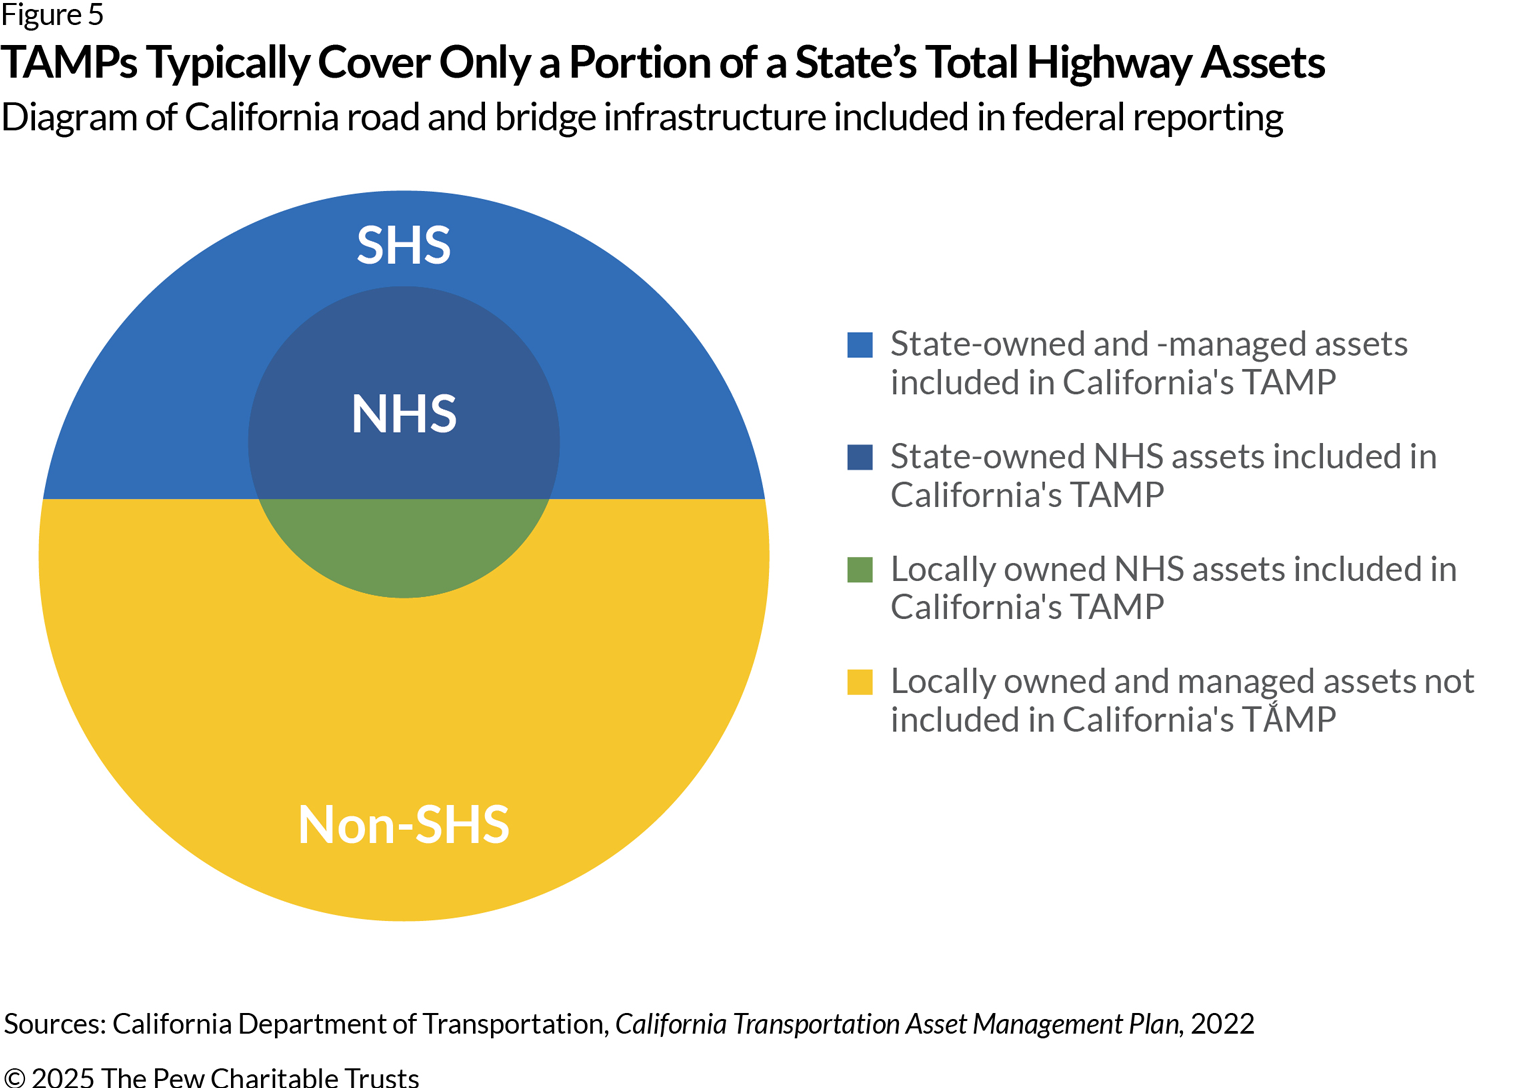
The infrastructure covered in the TAMPs typically does not include all transportation assets in a state. For example, California’s TAMP includes only SHS or federally designated NHS assets that are owned and managed by either the state or a locality, excluding roughly two-thirds of the state’s infrastructure that is non-NHS locally owned and managed.24 (See Figure 5.) This limited scope means that although TAMPs offer valuable insights into NHS assets, they fail to provide a full picture of state transportation networks and infrastructure performance and needs.
States can expand the scope of their TAMPs beyond federal requirements to include all road and bridge assets to provide a more comprehensive view of their infrastructure performance and funding gaps, give policymakers early warning about possible distress, and support better statewide coordination of transportation policy.
Alternatively, states can present information on transportation asset management separate from the TAMP. California, for example, releases a State Highway System Management Plan (SHSMP) that covers the complete state highway system assets—including tunnels, drainage systems, management systems, bicycle and pedestrian infrastructure, and other assets—rather than just the subset of roads and bridges included in the TAMP. The SHSMP follows the TAMP approach of conducting 10-year gap analyses for conditions and funding and serves as a “logical extension” of the TAMP reporting process.25 The state’s 2022 TAMP funding gap analysis shows an $8.7 billion shortfall over a 10-year analysis period, but the SHSMP finds a funding gap of $41 billion for the more comprehensive set of assets it covers.
Another strategy is offered by the Delaware DOT, which not only includes condition gap analyses for pavement and bridges as part of the TAMP process but also releases annual summaries of SOGR progress for a broad set of assets. These yearly analyses provide inventory, funding, and condition data and allow annual assessments of the adequacy and sustainability of highway funding and asset management in Delaware.26
Reporting condition and funding analyses outside the TAMP process is a rare practice across states, but it can make transportation asset management information more timely, more comprehensive, and better connected to state policy questions and concerns.
Gaps assessed
Most states report some of the information needed to assess gaps in their transportation policy, but only 26 have projections and gap analyses for both funding adequacy and roadway conditions. Without such comprehensive information, policymakers may not be able to easily connect funding shortfalls with the inability to meet condition targets and understand the scale of the challenge.
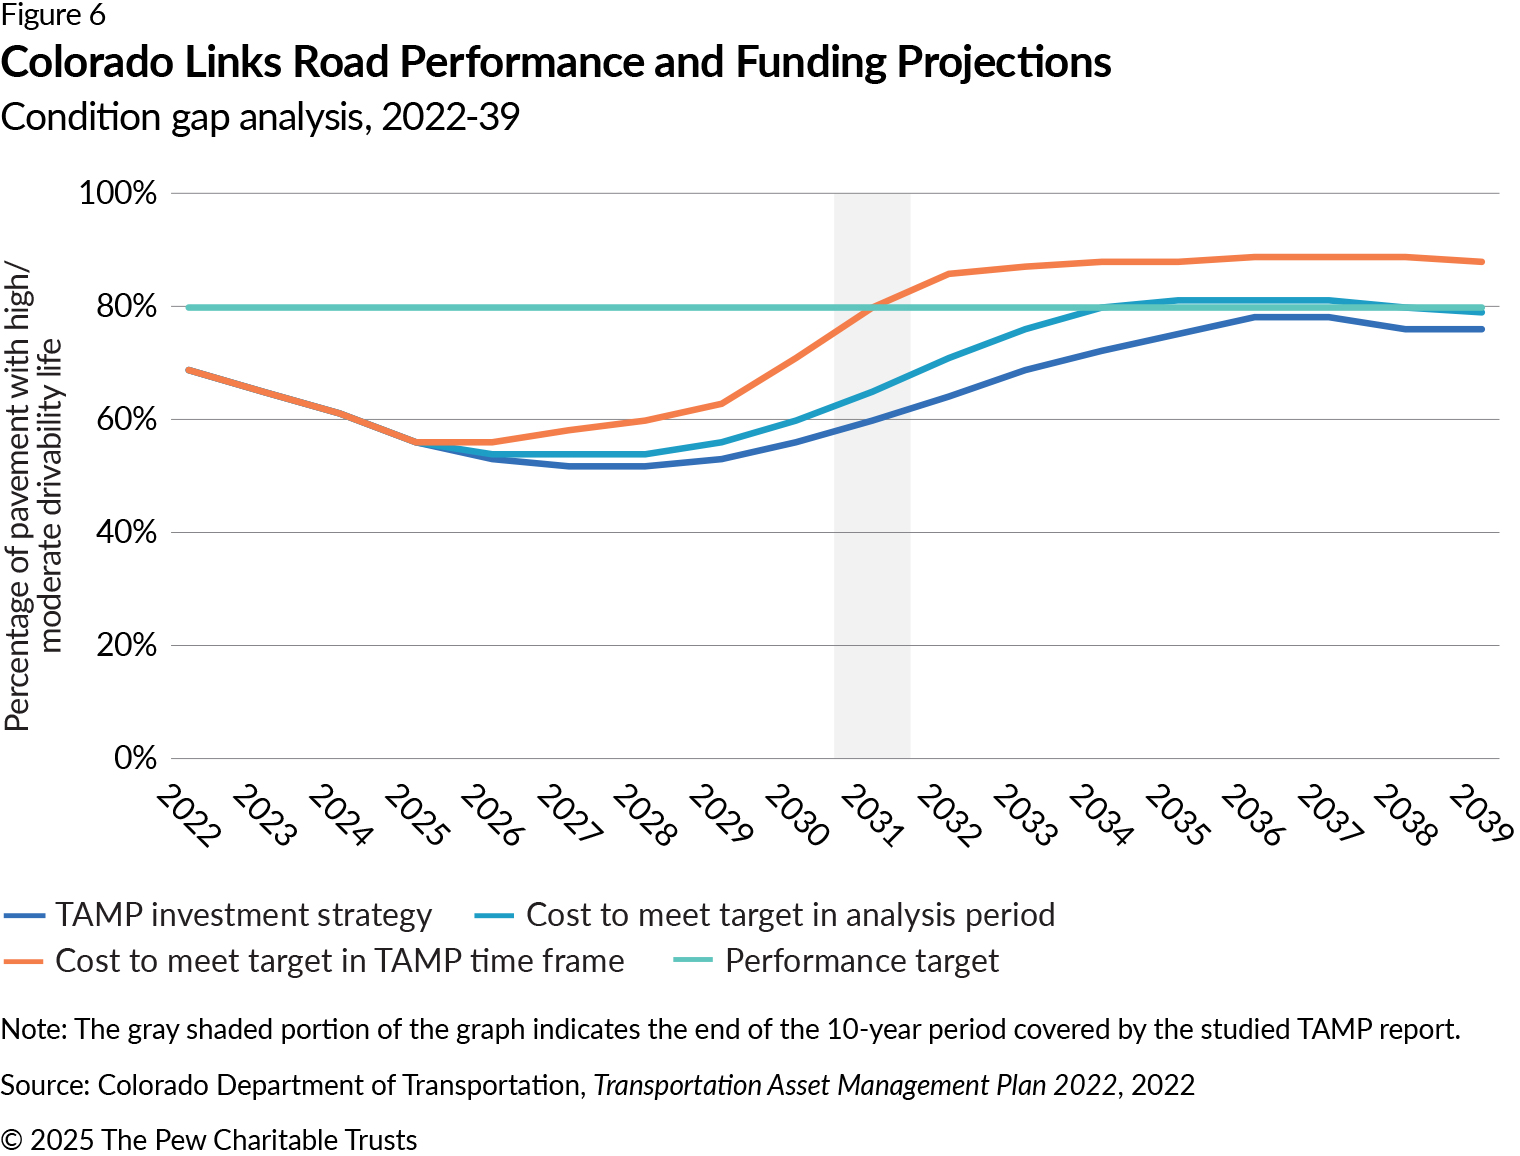
For instance, Colorado set a 10-year target to have 80% of assets achieve “high or moderate drivability” by 2031, but it projects that only 60% will meet that goal under the current investment strategy, resulting in a 20% gap between the state’s projected funding needs and its current investment strategy.27 (See Figure 6.) Colorado presents its metrics, targets, expected condition, performance gap over time, and amount of additional investment needed to close that gap over a range of time frames, giving policymakers and stakeholders the information they need to assess the impact of different investment strategies on the trajectory of road conditions in the state.
Recommendations
Pew’s analysis depends heavily on clear and transparent reporting in state TAMPs. And although good reporting does not necessarily equate to good performance, it forms a foundation for states to accurately assess their long-term fiscal sustainability and increases transparency, which in turn promotes government accountability and sound decision-making.
Most importantly, because most states expect to fall short of needed investments, TAMPs need to be connected to state budgeting to guide policymakers’ decision-making on how to adequately fund road and bridge preservation and provide transparency and accountability when costs are pushed onto future taxpayers or when key transportation infrastructure is left in a state of poor repair.
Pew has identified a set of promising practices in use by some states that offer a roadmap for improving state reporting and transportation policymaking.
Use TAMPs to identify solutions and demonstrate progress
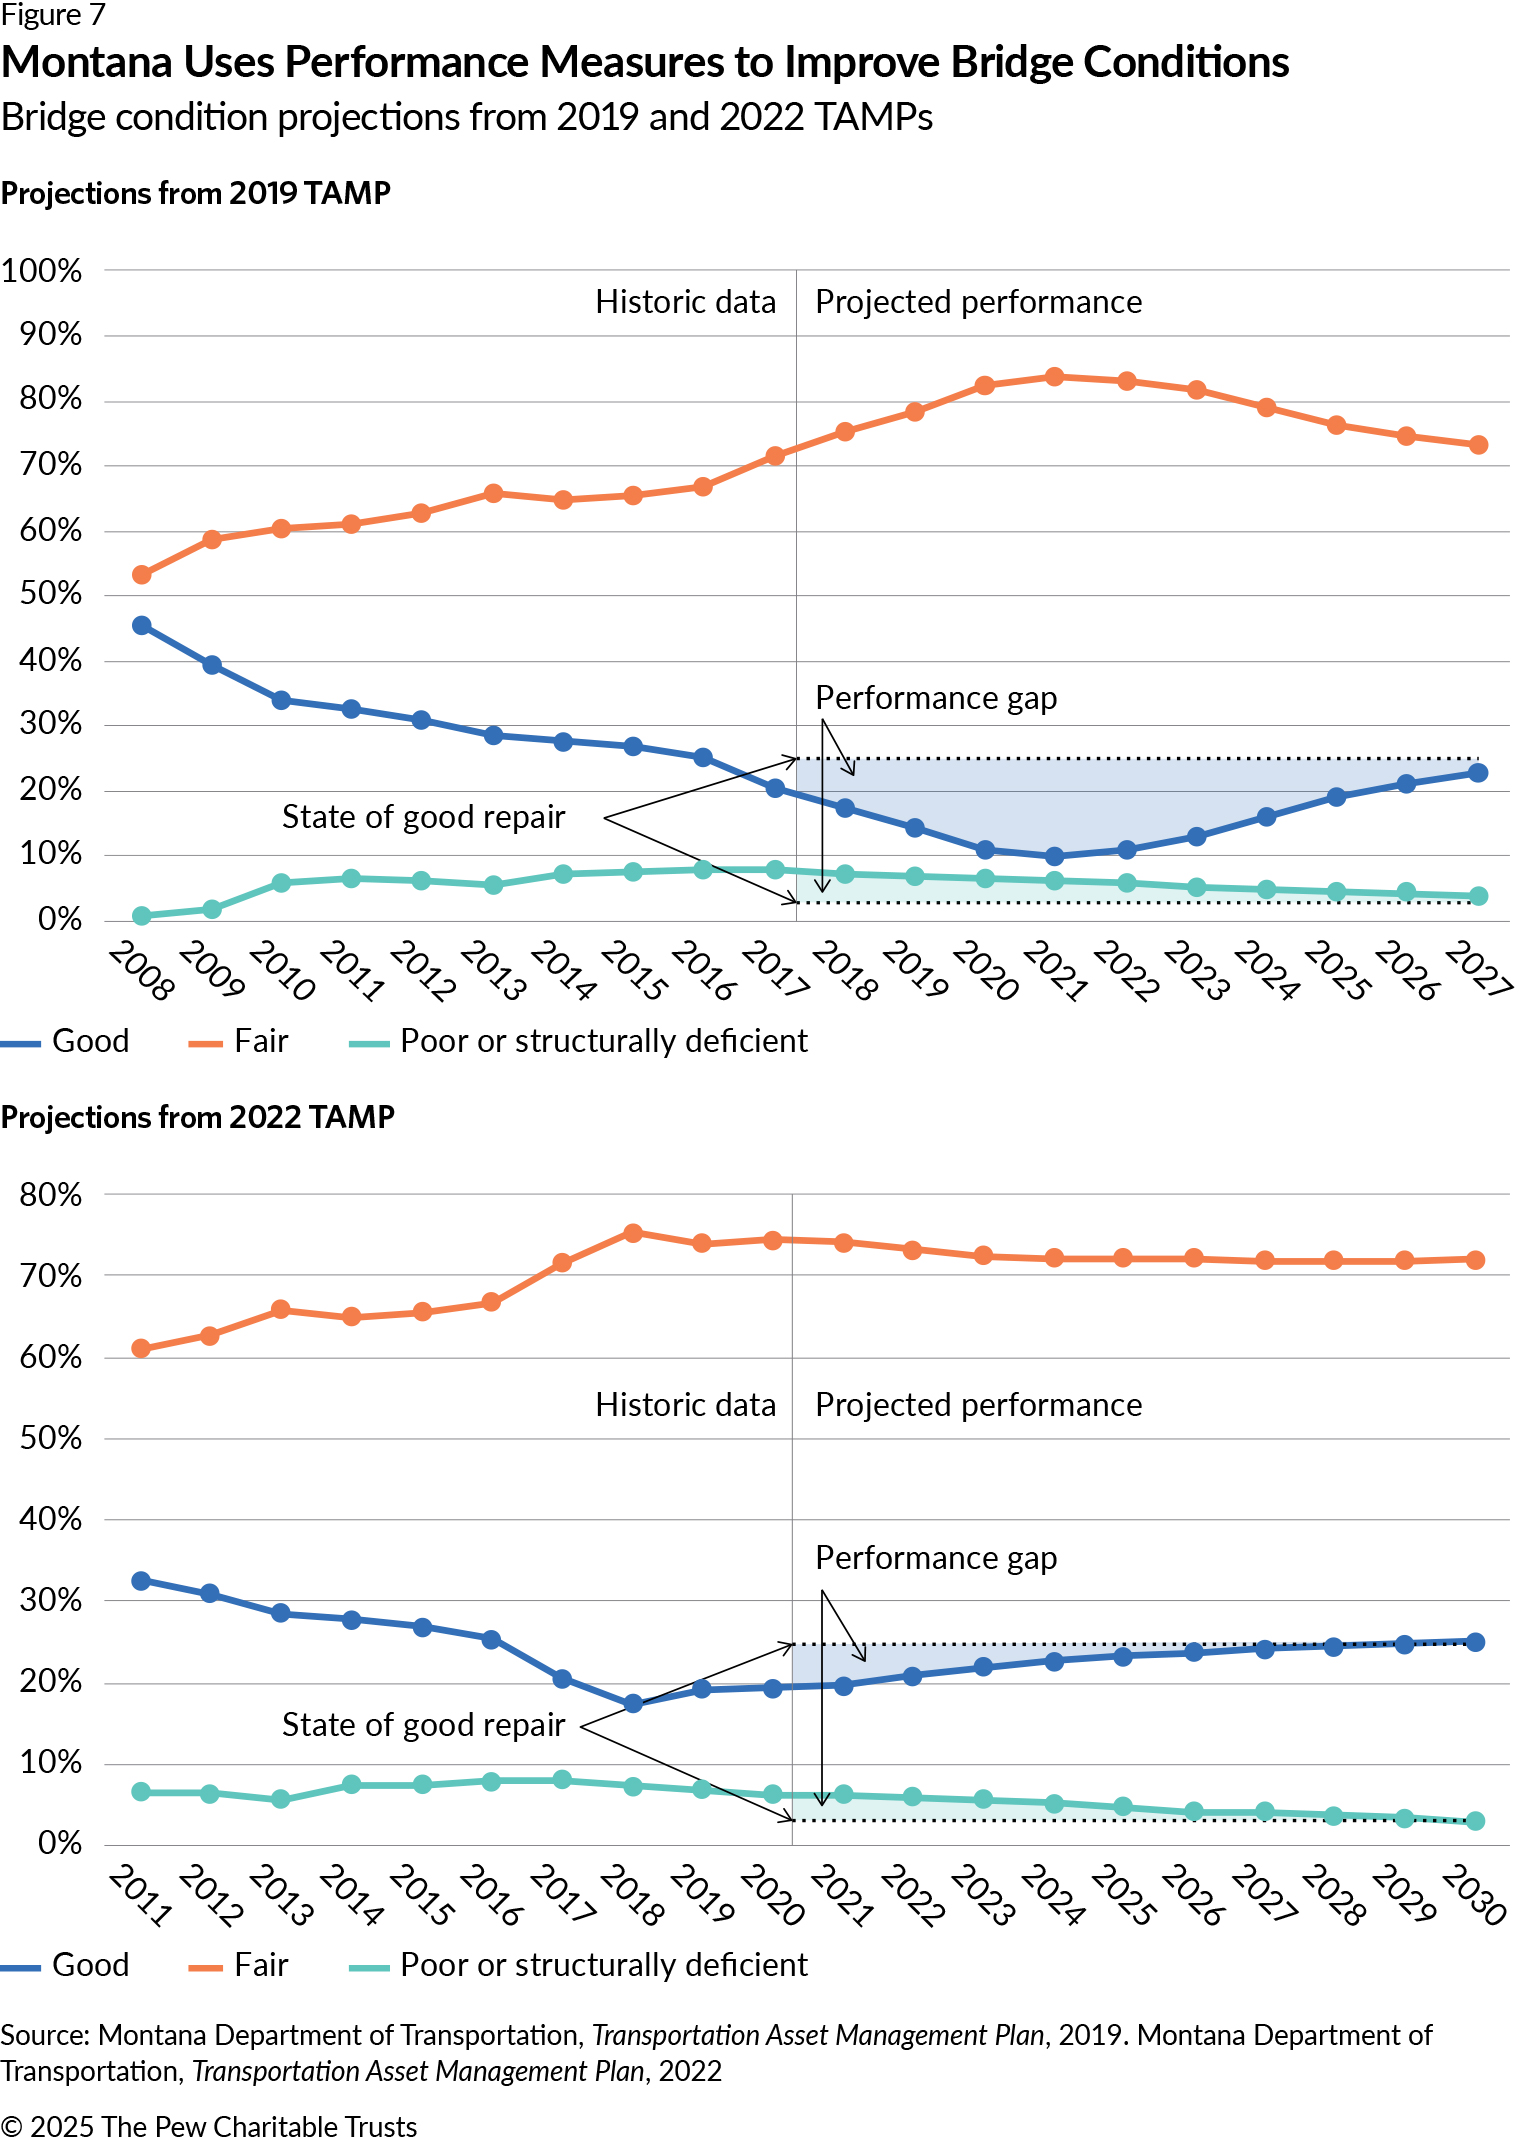
States can use their TAMPs to track changes in infrastructure investment and determine whether those changes are sufficient to meet state needs. For example, in 2019, Montana had a condition gap for NHS bridges and expected that its investments would be inadequate to close that gap, even with an increase from $25 million to $40 million annually. However, the next TAMP, which was published in 2022, projected that the gap would close over the 10-year analysis period after the state further increased funding to $50 million per year. 28 (See Figure 7.) The 2019 TAMP condition gap analysis diagnosed a problem for Montana’s transportation infrastructure and identified the size of the needed remedy, and the 2022 report indicated that state policymakers had resolved the shortfall.
Montana’s approach demonstrates that TAMP gap analyses can offer guidance not only on the likelihood of shortfalls but also on addressing those shortfalls and ensuring that investments are aligned with SOGR targets. Projected state funding needs should be explicitly tied to DOT condition goals and should specify the level of funding and type of maintenance or preservation activities required, ensuring a clear link between funding and condition. Stronger coordination between transportation agencies and the state budgeting process can ensure that state policymakers use the information to match actual investment numbers with what the DOT analysis shows to be necessary.
Include a broad range of assets
Some states report on more than just NHS assets. For example, Illinois provides a comprehensive inventory and full condition and funding gap analyses for all of its non-NHS and NHS assets, with clearly defined ownership and responsibilities for all roads.29 (Non-NHS assets make up more than half of the state-maintained pavements in Illinois.) (See Table 3.) By broadening the scope of its reporting to include non-NHS assets, Illinois presents a more complete picture of its infrastructure and funding needs, enabling better planning and resource allocation.
Table 3
Illinois Reports on All NHS and Non-NHS Assets
Inventory of pavement by jurisdiction and system, in centerline miles
| System | Roadway type | Jurisdiction | Jurisdiction total | System total | Illinois Department of Transportation (IDOT)-maintained total |
|---|---|---|---|---|---|
| NHS | Interstates | IDOT | 1,892.97 | 7,756.50 | 6,977.16 |
| Illinois Tollway | 284.84 | ||||
| Chicago Skyway | 7.66 | ||||
| Non-interstate NHS | IDOT | 5,084.19 | |||
| Non-interstate NHS | 10.07 | ||||
| IDOT | 476.77 | ||||
| Non-NHS | Marked routes | IDOT | 6,570.18 | 8,927.34 | 8,927.34 |
| Unmarked routes | IDOT | 2,357.16 | |||
| NHS and Non-NHS pavement | 16,683.84 | 15,904.50 | |||
Note: A centerline mile is one mile of roadway measured without regard for the number of lanes.
Source: Illinois Department of Transportation, Transportation Asset Management Plan, 2023
States should include non-NHS roads and bridges in their TAMPs to provide a more comprehensive view of state transportation systems. They could also incorporate critical local roadways into statewide asset management processes to help state DOTs identify and provide technical assistance and tools to less-resourced local governments and encourage public reporting and enhanced transparency about infrastructure conditions statewide. By proactively collecting and reporting comprehensive data, states can identify and mitigate risks; enhance the connectivity, safety, and economic opportunities for local communities; and enable better resource allocation.
Link 10-year condition and funding gaps
States can use their TAMPs to clearly connect condition shortfalls to financial gaps. New Jersey’s reports outline the state’s SOGR targets, current and projected bridge conditions, condition gaps, and corresponding investment data, including detailed funding needs, planned spending, and any anticipated gap.30 (See Table 4.) By providing a transparent view of how much funding is required to address investment shortfalls and close condition gaps, this approach offers an accurate picture of the financial resources necessary to achieve New Jersey’s infrastructure goals.
Table 4
New Jersey Ties Bridge Condition Gap Projections to Funding Needs
State’s anticipated 10-year bridge performance and investment, 2023-32
| Performance | Baseline CY 2021 | CY 2032 Planned |
|---|---|---|
| Condition measures | Good or Fair | Good or Fair |
| State of Good Repair objective | 94.0% | 94.0% |
| Condition | 90.5% | 93.6% |
| Performance gap (percentage points) | -3.5 | -0.4 |
| Investment | Average annual investment, FY 2023-32 | |
| Investment required to achieve objective | $790 million | |
| Planned funding | $755 million | |
| Funding gap | -$35 million | |
Notes: SHS bridges include all New Jersey Department of Transportation-maintained bridges.
Source: New Jersey Department of Transportation, New Jersey Transportation Asset Management Plan, 2022
TAMP analyses offer state DOTs an important opportunity to communicate with policymakers, stakeholders, and the public. By connecting condition and funding projections, DOTs can make the consequences of inadequate funding for state roads and bridges apparent to these audiences.
Clarify the relationship between state and federal metrics
State DOTs sometimes develop their own metrics for tracking pavement and bridge conditions while federal reporting requirements typically focus on federal measures. Clearly demonstrating how each measure and metric assesses roads or bridges, where they differ, and where they align can make reporting more accessible and transparent.
Delaware’s reports provide a side-by-side comparison to show how state-specific metrics compare with federal standards, making it easier for stakeholders, policymakers, and the public to understand the state’s infrastructure performance and fostering informed decision-making.31 (See Table 5.)
Although state-specific metrics often provide more detailed information than federal measures, they can also create confusion. States should clarify when each metric is used and how they compare in order to improve the accessibility and transparency of TAMP reporting.
Table 5
Delaware Shows Pavement Conditions Under Federal and State Metrics
State performance and associated funding needs reporting, 2021 and 2031
| Scenario | Average Annual Investment | Federal Highway Administration measures | State measures | ||||||||||
| Interstate | Non-interstate NHS | NHS average overall pavement condition (OPC) | Whole network average OPC | ||||||||||
| Share in good condition | Share in poor condition | Share in good condition | Share in poor condition | ||||||||||
| 2021 | 2031 | 2021 | 2031 | 2021 | 2031 | 2021 | 2031 | 2021 | 2031 | 2021 | 2031 | ||
| Baseline scenario | $82.2 million | 60.7% | 27.8% | 0.34% | 1.21% | 40.3% | 28.1% | 0.73% | 4.28% | 84.2 | 83.3 | 73.2 | 76.4 |
| +10% Increased Funding | $90.5 million | 60.7% | 26.5% | 0.34% | 1.21% | 40.3% | 30.1% | 0.73% | 3.85% | 84.2 | 83.2 | 73.2 | 77.7 |
| -10% Decreased Funding | $74.0 million | 60.7% | 30.3% | 0.34% | 1.21% | 40.3% | 28.5% | 0.73% | 4.25% | 84.2 | 83.2 | 73.2 | 75.2 |
Note: OPC is the Delaware DOT’s metric for tracking pavement conditions, with higher ratings representing lower levels of distress.
Source: Delaware Department of Transportation, Delaware Transportation Asset Management Plan, 2022
Integrate TAMP reporting with broader state strategies
TAMPs should not be developed solely to satisfy federal requirements. Rather, they should serve as a crucial component of states’ transportation planning process, helping to align the multiple plans, such as the Statewide Transportation Improvement Program (STIP) and the Long-Range Statewide Transportation Plan (LRTP), that are mandated by federal and state laws.32
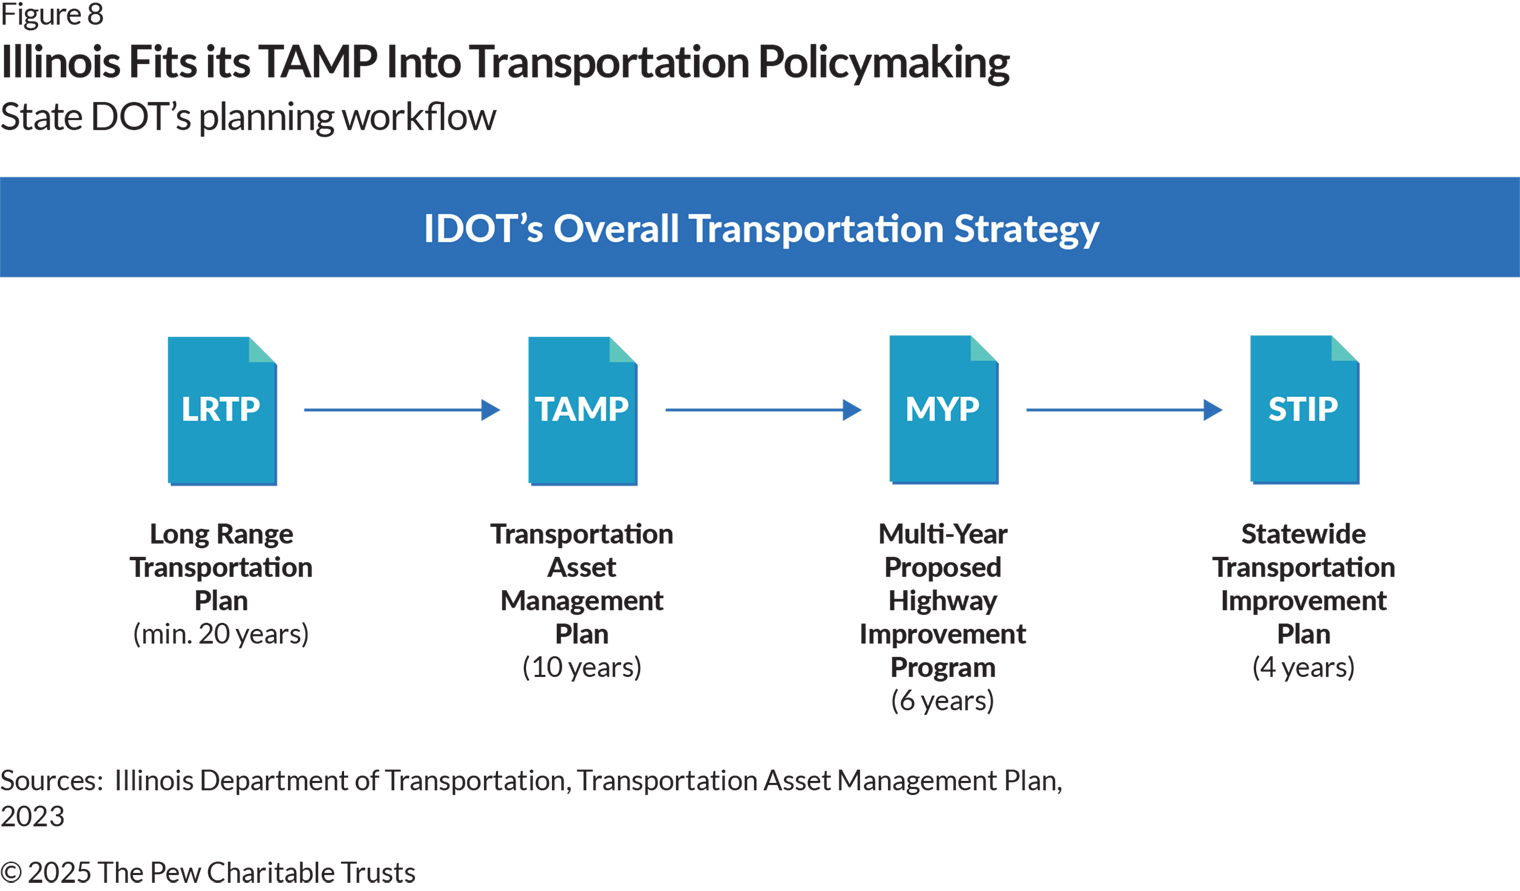
Illinois uses its TAMPs to clearly outline its overall transportation strategy and explain how its four key transportation plans relate to each other.33 (See Figure 8.) In this way, Illinois’ TAMPs play a pivotal role in connecting the strategic goals outlined in the LRTP with the specific projects identified in the STIP and provide a structure for ensuring that the state’s long-term transportation strategy is effectively implemented through concrete, multiyear planning efforts.34
States can integrate their TAMP data into their transportation planning by ensuring alignment across the STIP, LRTP, and other documents to create a cohesive and consistent framework for evaluating infrastructure performance and making investment decisions.
Use TAMPs to guide investment strategies
Although states would, of course, prefer to have projections showing that their current policies point them in the right direction, having advance notice of a future shortfall can help them better use available resources in the short term and make needed policy changes for the long term.
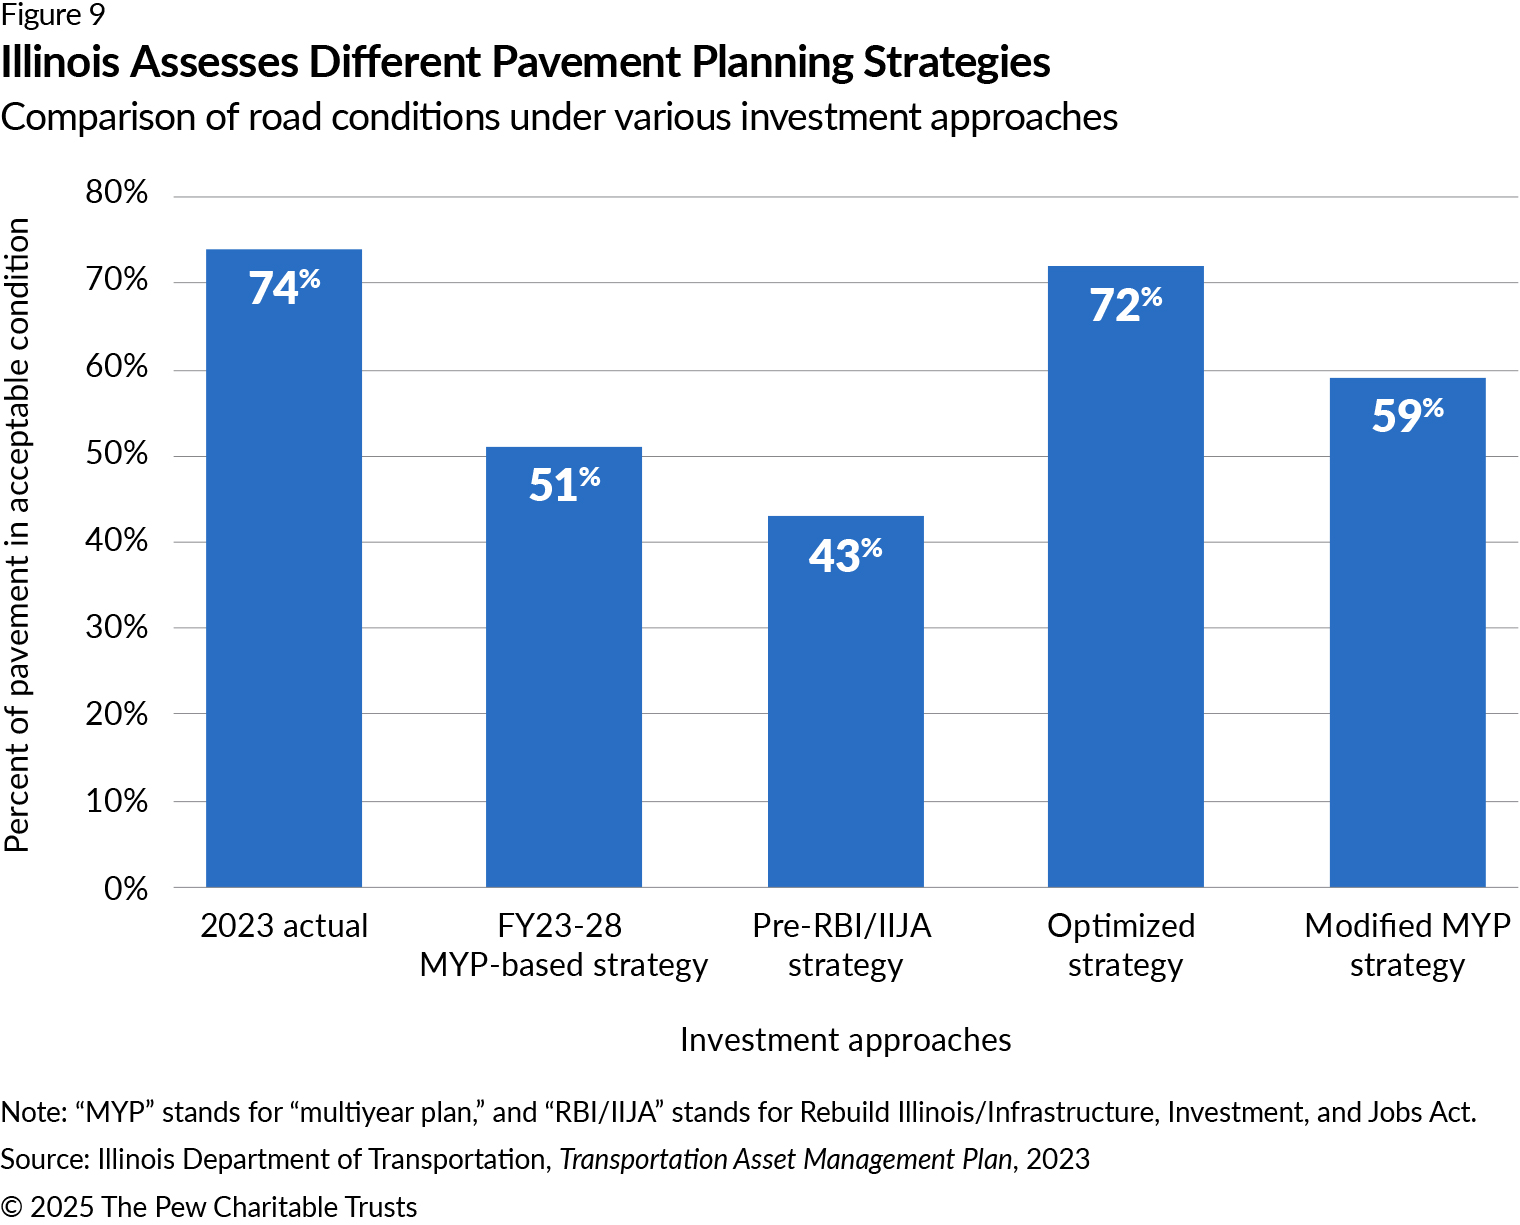
The Illinois DOT acknowledged in its 2023 TAMP the “reality of inadequate funding” and used the awareness of an ongoing condition gap to identify better ways to deploy its available resources. Illinois presented the effects of different investment strategies on pavement conditions. The analysis shows that extending the state’s existing fiscal 2023-28 Multi-Year Plan (MYP)-Based Strategy would reduce the share of roads in acceptable condition from 74% to 51% over 10 years, but a policy that optimized every dollar spent on road projects over the next decade would keep the share of pavement in acceptable condition relatively stable—72% compared with 74% in 2021. (See Figure 9.)
However, because the purely optimized strategy also ignores certain real-world constraints—such as projects already underway that need to be completed and state and federal requirements that certain projects be included in the state’s transportation planning—the Illinois TAMP also includes a modification to existing strategy that accounts for these factors. The modified strategy builds in some of the findings and results from optimizing transportation spending and would boost the expected share of roads in acceptable condition in 2032 by 8 percentage points to 59% compared with 51% in the existing plan.
Because states do not have unlimited resources, analyses such as Illinois’ can allow DOTs to evaluate and compare different approaches to managing roads and bridges, identify the most effective use of available transportation dollars, communicate to policymakers, stakeholders, and the public about the available options, and make state transportation policy more efficient, accountable, and transparent.
Conclusion
States face a challenging future for transportation funding, with an annual shortfall of at least $8.6 billion of what they collectively need for road and bridge maintenance and preservation. Based on their own goals and projections, most states do not expect to be able to keep key roads and bridges in a state of good repair.
To address these funding and condition gaps and ensure that future generations are not left paying the bills for crumbling infrastructure, states will need to effectively track and manage the condition of their roads and bridges and clearly communicate that information so that policymakers and the public can understand whether transportation investment policies are sustainable and make needed adjustments.
State DOTs have already begun improving their reporting since the first TAMPs were published. However, more can be done to promote transparency and effective planning and to adequately fund the maintenance and preservation of important transportation infrastructure. States that effectively use data to guide budgeting and capital investments will be best able to address deferred maintenance, keep roads and bridges in good repair, maintain their fiscal health, and provide residents with smoother and safer driving conditions.
Appendix A: Terms and abbreviations
Condition gap: The difference between the target state of infrastructure (e.g., in good repair) and the actual or projected state.
Deferred maintenance: The accumulated gap between what should have been invested to preserve, maintain, and repair public infrastructure and what was actually spent for those purposes.
Funding gap: The shortfall between the financial resources required to maintain infrastructure assets in a state of good repair and the funding available or allocated for those purposes.
Highway performance: A measure of how effectively highway systems meet transportation needs, including factors such as road conditions, safety, traffic flow, and freight efficiency.
Life cycle management: An approach to asset management that considers the total cost of ownership over an asset’s life span, including planning, construction, operation, maintenance, and eventual replacement or disposal.
National Highway System (NHS): A network of highways designated as significant to the U.S. economy and national defense under the National Highway System Designation Act of 1995.35
Non-NHS roads and bridges: Transportation infrastructure not included in the National Highway System.
Risk-based asset management: An approach that incorporates assessments of risks, such as potential asset failure, extreme weather events, or funding uncertainties, into infrastructure management to prioritize investments and ensure resilience.
State of good repair (SOGR): An infrastructure condition that ensures safety, functionality, and extended service life without adding to assets’ capacity or structural value.
Transportation Asset Management Plan (TAMP): A federally required document that states produce to outline how they assess and manage their transportation infrastructure.
Appendix B: State data
Table B.1
State Reporting on Road and Bridge Condition and Funding Gaps
| State | Roads | Bridges | ||
| Condition | Funding | Condition | Funding | |
| Alabama | Gap | $181 million | Gap | $590 million |
| Alaska | No gap | Did not report | Gap | Did not report |
| Arizona | No gap | Did not report | No gap | Did not report |
| Arkansas | Gap | $1.77 billion (roads and bridges) | Gap | $1.77 billion (roads and bridges) |
| California | Gap | $3.6 billion | Gap | $5.06 billion |
| Colorado | Gap | $1.4 billion | No gap | No gap |
| Connecticut | Gap | $2.2 billion | Gap | $7.97 billion |
| Delaware | Gap | No gap | No gap | No gap |
| Florida | No gap | No gap | No gap | No gap |
| Georgia | Gap | Did not report | No gap | Did not report |
| Hawaii | No gap | No gap | No gap | No gap |
| Idaho | No gap | No gap | No gap | No gap |
| Illinois | Gap | $1.76 billion | No gap | $529 million |
| Indiana | No gap | No gap | No gap | No gap |
| Iowa | Gap | $331 million | Gap | $784 million |
| Kansas | Gap | $60 million | No gap | No gap |
| Kentucky | Gap | $2.29 billion | Gap | $500 million |
| Louisiana | Gap | Did not report | Gap | Did not report |
| Maine | Did not report | No gap | No gap | No gap |
| Maryland | Did not report | $572 million | Did not report | $600 million |
| Massachusetts | Gap | $200 million | Gap | $1.6 billion |
| Michigan | Gap | $14.8 billion | Gap | $1 billion |
| Minnesota | No gap | No gap | Gap | $1.4 billion |
| Mississippi | No gap | No gap | No gap | No gap |
| Missouri | Did not report | Did not report | Did not report | Did not report |
| Montana | No gap | No gap | No gap | No gap |
| Nebraska | No gap | Did not report | Did not report | Did not report |
| Nevada | Gap | No gap | No gap | No gap |
| New Hampshire | Gap | $80 million | No gap | No gap |
| New Jersey | No gap | No gap | Gap | $360 million |
| New Mexico | Gap | $2.6 billion | Gap | $367 million |
| New York | Gap | $4.3 billion | Gap | $11.06 billion |
| North Carolina | Did not report | Did not report | Did not report | Did not report |
| North Dakota | No gap | Did not report | Gap reported | Did not report |
| Ohio | No gap | Did not report | No gap | Did not report |
| Oklahoma | Gap | $60 million | Gap | $300 million |
| Oregon | Gap | $1.87 billion | Gap | $2.93 billion |
| Pennsylvania | Gap | $8.15 billion (roads and bridges) | Gap | $8.15 billion (roads and bridges) |
| Rhode Island | No gap | $625 million | No gap | $1.14 billion |
| South Carolina | Did not report | Did not report | Did not report | Did not report |
| South Dakota | Gap | Did not report | No gap | Did not report |
| Tennessee | Gap | Did not report | No gap | Did not report |
| Texas | Gap | Did not report | Gap | Did not report |
| Utah | Did not report | Did not report | Did not report | Did not report |
| Vermont | Did not report | $75 million | Did not report | $370 million |
| Virginia | No gap | No gap | Gap | Did not report |
| Washington | Gap | $1.44 billion | Gap | $836 million |
| West Virginia | Did not report | No gap | Did not report | $419 million |
| Wisconsin | No gap | Did not report | No gap | Did not report |
| Wyoming | Did not report | Did not report | No gap | Did not report |
Source: Pew analysis of state Transportation Asset Management Plans
Endnotes
- “Moving Goods in the United States,” U.S. Department of Transportation Bureau of Transportation Statistics, 2025, https://data.bts.gov/stories/s/Moving-Goods-in-the-United-States/bcyt-rqmu/.
- National Association of State Budget Officers, “2024 State Expenditure Report: Fiscal Years 2022-2024,” 2024, https://higherlogicdownload.s3.amazonaws.com/NASBO/9d2d2db1-c943-4f1b-b750-0fca152d64c2/UploadedImages/SER%20Archive/2024_SER/2024_State_Expenditure_Report_S.pdf.
- “State and Local Governments Face Persistent Infrastructure Investment Challenges,” Fatima Yousofi and Susan Banta, The Pew Charitable Trusts, https://www.pewtrusts.org/en/research-and-analysis/articles/2023/02/03/state-and-local-governments-face-persistent-infrastructure-investment-challenges.
- U.S. Department of Transportation, “Transportation Asset Management Plan Development Processes Certification and Recertification Guidance,” 2018, https://www.fhwa.dot.gov/asset/guidance/certification.pdf. The NHS is a network of highways that Congress designated as significant to the U.S. economy and national defense under the National Highway System Designation Act of 1995.See: U.S. Congress, National Highway System Designation Act of 1995, 104-59 (1995), https://www.govinfo.gov/content/pkg/COMPS-1425/pdf/COMPS-1425.pdf.
- U.S. Department of Transportation, “Transportation Asset Management Plan Development Processes Certification and Recertification Guidance.”
- Pew calculations based on data from Michigan Department of Transportation, “Transportation Asset Management Plan,” 2022, https://www.tam-portal.com/wp-content/uploads/sites/12/2023/07/TAMP-Jul-2022.pdf.
- Pew calculations based on data from New York State Department of Transportation, “Transportation Asset Management Plan,” 2019, https://www.dot.ny.gov/programs/capital-plan/repository/Final%20TAMP%20June%2028%202019.pdf.
- Pew calculations based on data from Kansas Department of Transportation, “Transportation Asset Management Plan,” 2022, https://www.tam-portal.com/wp-content/uploads/sites/12/2024/03/Kansas_DOT_TAMP_Dec2022.pdf.
- Arkansas Department of Transportation, “2022 Transportation Asset Management Plan,” 2022, https://ardot.gov/wp-content/uploads/2022-TAMP.pdf. Pennsylvania Department of Transportation, “Transportation Asset Management Plan 2022,” 2022, https://www.tam-portal.com/document/pennsylvania-dot-tamp-2022/.
- Louisiana Department of Transportation, “2022 Federal NHS Transportation Asset Management Plan,” 2022, https://www.tam-portal.com/wp-content/uploads/sites/12/2024/03/LADOTD-TAMP-2022-Final-Issued.pdf.
- “Total Disbursements for Highways, All Units of Government, 2022,” Federal Highway Administration Office of Highway Policy Information, 2024, https://www.fhwa.dot.gov/policyinformation/statistics/2023/hf2.cfm.
- “States Adapt Transportation Funding Strategies to Meet Resource Challenges,” Ora Halpern, Eli Gullett, and Fatima Yousofi, June 18, 2025, https://www.pew.org/en/research-and-analysis/articles/2025/06/18/states-adapt-transportation-funding-strategies-to-meet-resource-challenges.
- Federal Highway Administration, “23 CFR Part 515—Asset Management Plans,” 2016, https://www.law.cornell.edu/cfr/text/23/part-515.
- Max Grogg, “Overview of Performance Measures: Pavement Condition to Assess the National Highway Performance Program” (presentation, Federal Highway Administration Highway Information Seminar, November 2017), https://www.fhwa.dot.gov/tpm/workshop/az/pavementworksheets.pdf.
- “Tables of Frequently Requested NBI Information,” Federal Highway Administration, United States Department of Transportation, July 22, 2024, https://www.fhwa.dot.gov/bridge/britab.cfm.
- New Mexico Department of Transportation, “2022 Transportation Asset Management Plan,” 2022, https://www.tam-portal.com/wp-content/uploads/sites/12/2023/02/NMDOT-TAMP-2022.pdf.
- Connecticut Department of Transportation, “2022 Highway Transportation Asset Management Plan,” 2022, https://portal.ct.gov/dot/-/media/dot/tam/transportation-asset-management-plan-fhwa-certified-9302022.pdf.
- Arkansas Department of Transportation, “2022 Transportation Asset Management Plan,” 2022, https://www.tam-portal.com/wp-content/uploads/sites/12/2024/02/Arkansas_TAMP_2022.pdf.
- New York State Department of Transportation, “Transportation Asset Management Plan.”
- Oklahoma Department of Transportation, “Transportation Asset Management Plan 2022-2031,” 2022, https://www.tam-portal.com/wp-content/uploads/sites/12/2024/04/Oklahoma_tamp_2022.pdf.
- Rhode Island Department of Transportation, “Transportation Asset Management Plan,” 2022, https://www.tam-portal.com/wp-content/uploads/sites/12/2023/01/RIDOT-TAMP-2022.pdf.
- Delaware Department of Transportation, “Delaware DOT Transportation Asset Management Plan 2022,” https://www.tam-portal.com/wp-content/uploads/sites/12/2023/01/DelDOT-2022-TAMP-Final_v1.1.pdf.
- Iowa Department of Transportation, “Iowa DOT Transportation Asset Management Plan 2023,” 2023, https://www.tam-portal.com/wp-content/uploads/sites/12/2023/03/IowaDOT-TAMP-2023.pdf.
- California Department of Transportation, “California Transportation Asset Management Plan,” 2022, https://www.tam-portal.com/wp-content/uploads/sites/12/2023/07/CA-2022-tamp-a11y.pdf.
- California Department of Transportation, “2025 State Highway System Management Plan,” 2025, https://dot.ca.gov/-/media/dot-media/programs/asset-management/documents/2025_shsmp_draft_02-21-25.pdf.
- “Transportation Asset Management,” Delaware Department of Transportation, 2025, https://deldot.gov/Programs/TAM/.
- Colorado Department of Transportation, “Transportation Asset Management Plan 2022,” 2022, https://www.tam-portal.com/wp-content/uploads/sites/12/2024/02/Colorado_TAMP_2022-remediated-1.pdf.
- Montana Department of Transportation, “Transportation Asset Management Plan,” 2019, https://www.tam-portal.com/wp-content/uploads/sites/12/2023/02/MontanaDT-TAMP-2019.pdf. Montana Department of Transportation, “Transportation Asset Management Plan,” 2022, https://www.tam-portal.com/wp-content/uploads/sites/12/2023/02/MDT-TAMP-2022.pdf.
- Illinois Department of Transportation, “Transportation Asset Management Plan,” 2023, https://www.tam-portal.com/wp-content/uploads/sites/12/2023/02/IDOT-2022-TAMP-FHWA-Certified-01-24-23-50b89122f53fa8b413a3779cc98623ab.pdf.
- New Jersey Department of Transportation, “New Jersey Transportation Asset Management Plan,” 2022, https://www.tam-portal.com/wp-content/uploads/sites/12/2024/04/NJTAMP-2022.pdf.
- Delaware Department of Transportation, “Delaware DOT Transportation Asset Management Plan 2022.”
- "Statewide Transportation Improvement Program (STIP),” Federal Transit Administration, Nov. 11, 2022, https://www.transit.dot.gov/regulations-and-guidance/transportation-planning/statewide-transportation-improvement-program-stip. “Long-Range Statewide Transportation Plan,” Federal Transit Administration, March 7, 2025, https://www.transit.dot.gov/regulations-and-guidance/transportation-planning/long-range-statewide-transportation-plan.
- Illinois Department of Transportation, “Transportation Asset Management Plan.”
- Illinois Department of Transportation, “Transportation Asset Management Plan.”
- U.S. Congress, National Highway System Designation Act of 1995, 104-59 (1995).

