How Large Are States’ Budget Shortfalls for Roadway Maintenance?
New metric helps estimate spending needed to adequately fund preservation
Many states are falling behind on roadway maintenance, as planned spending increasingly proves insufficient to meet ongoing needs and other fiscal pressures, such as rising construction costs, higher borrowing rates, and uncertainty around federal funding, exacerbate these challenges. Collectively, these trends present significant obstacles to states working to address the maintenance and repair of roads and bridges.
To assess these challenges, The Pew Charitable Trusts developed a new metric, the gap-to-expenditure (GTE) ratio, which calculates each state’s projected funding gap for maintenance, preservation, repair, and replacement of National Highway System and other roadway infrastructure as a share of its planned budget.
The GTE ratio offers policymakers a clear way to assess roadway maintenance challenges relative to planned spending that merely looking at the dollar amounts does not show. By representing funding gaps as a share of maintenance budgets, the GTE ratio highlights whether a state’s shortfall could be manageable within existing budgeting approaches or is likely to require significant changes in investment strategy.
What Is the Gap-to-Expenditure Ratio?
The GTE ratio shows how large a state’s projected shortfall is relative to its planned maintenance spending, expressed as a percentage. It is calculated by dividing a state’s projected 10-year funding gap by its planned 10-year highway maintenance expenditures as reported in states’ 2022 Transportation Asset Management Plans (TAMPs), the most recent available.
- “Planned expenditures” are the amount a state expects to spend on its existing roadway infrastructure.
- “Funding gaps” are the shortfalls between the financial resources required to maintain infrastructure assets in a state of good repair and the funding available or allocated for those purposes.
States where planned expenditures are sufficient to meet needs have no funding gap, and their ratios are zero.
Gap-to-expenditure ratios highlight potential budget pressure
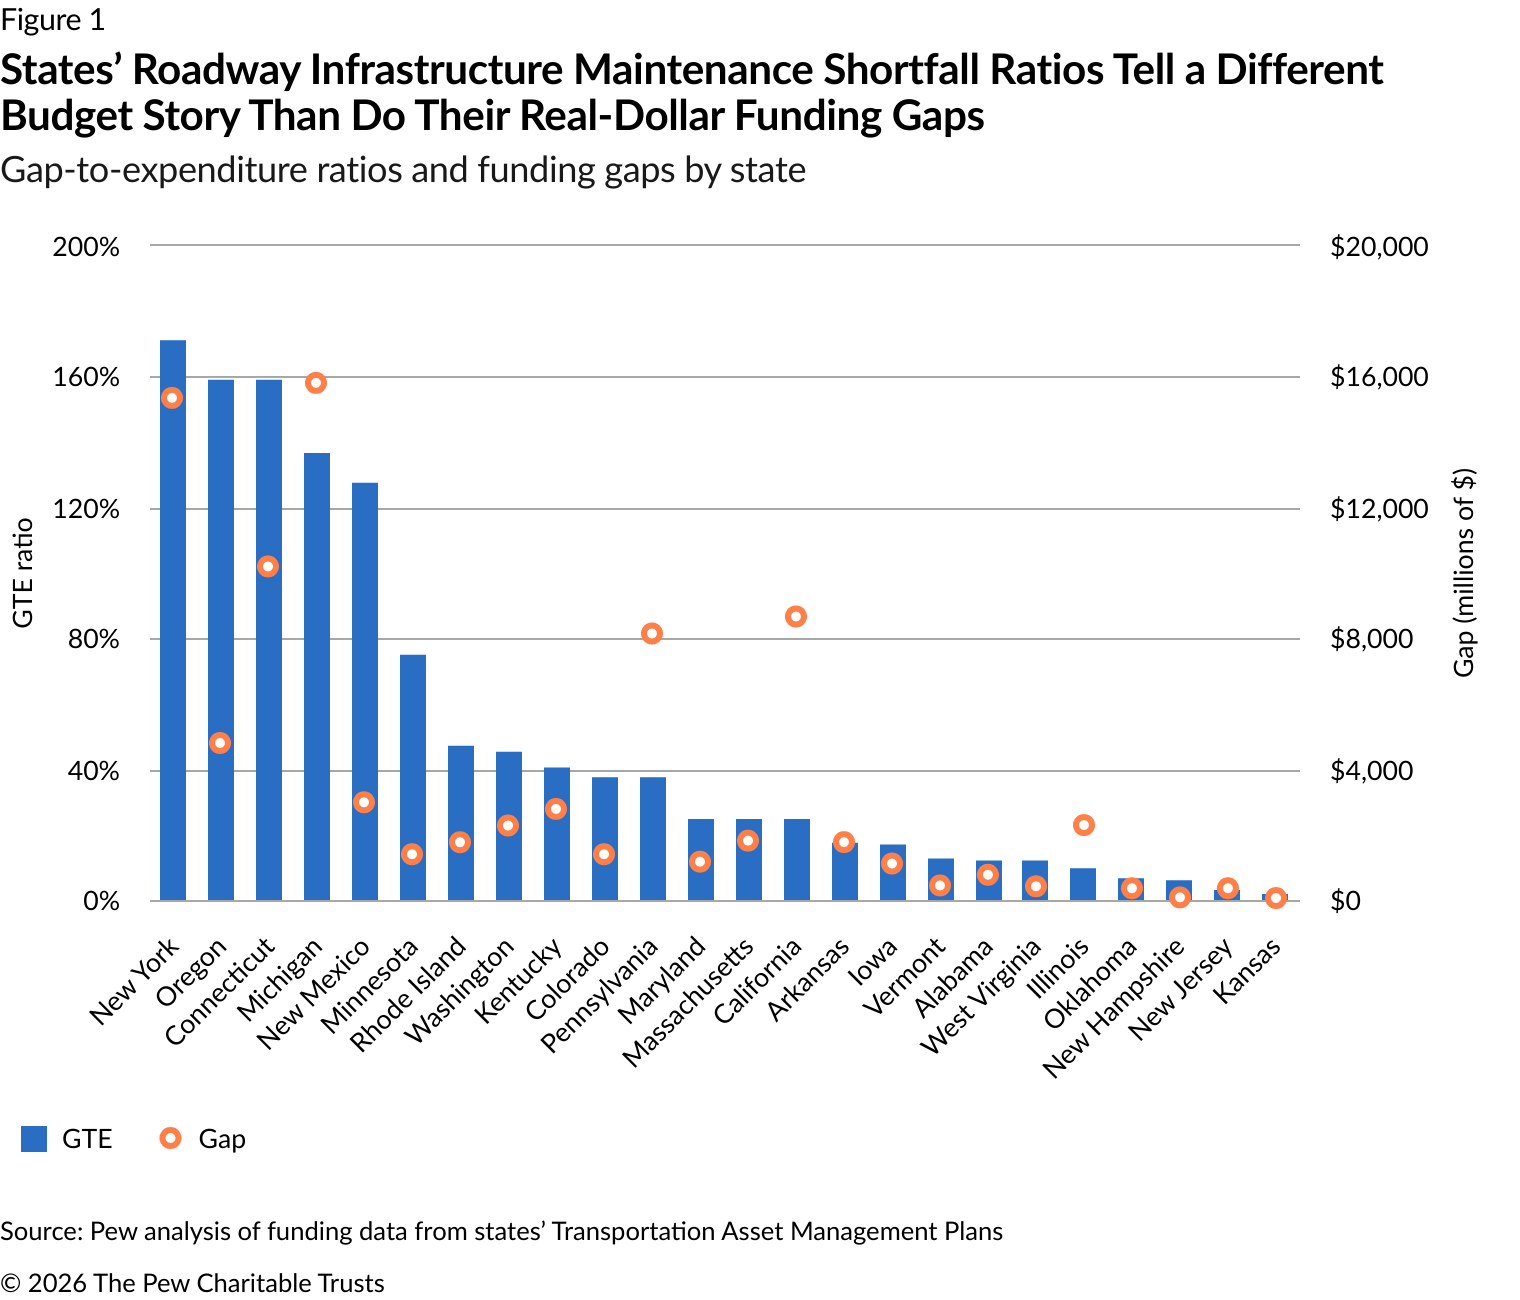
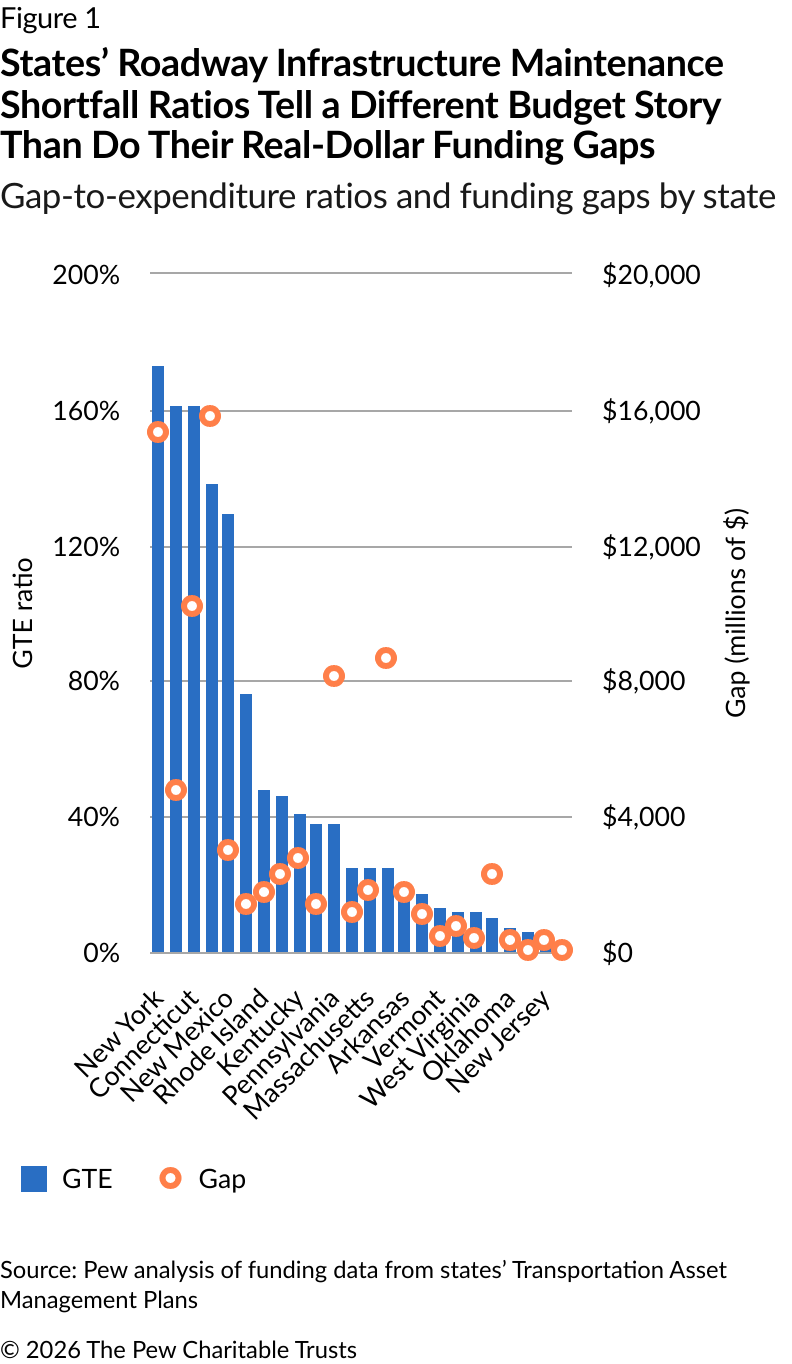
Thirty-three states provided sufficient data in their TAMPs to allow for calculation of the GTE ratio. Of those states, 24 projected funding shortfalls, but their ratios vary substantially, from 173% in New York to just 2% in Kansas. (See Figure 1.)
This variation helps explain how states with similar projected funding gaps, in real-dollar terms, can face very different levels of budget pressure. For example, Minnesota and Colorado both reported funding gaps of about $1.4 billion, but their GTE ratios are 76% and 38%, respectively, meaning that despite their nearly identical shortfalls, Minnesota will probably need to make a much larger adjustment to its planned spending than Colorado will. Importantly, this disparity may reflect more than budgeting differences. Factors such as the scale of each state’s transportation network, which roadways they include in their TAMPs, and the relative ambition of the maintenance and condition targets they set for their roads and bridges can also influence the scale of budget shortfalls.
The ratio also illuminates the reverse pattern: States with vastly different gaps in dollar terms can experience similar levels of budget stress as a result of those shortfalls. California, Massachusetts, and Maryland all have ratios of 25%, even though their projected gaps were about $8.7 billion, $1.8 billion, and $1.2 billion, respectively, demonstrating that larger states can have larger gaps without experiencing greater fiscal pressure than smaller states.
These examples show why dollar gaps alone cannot tell a complete story. A larger gap does not necessarily indicate greater budget pressure if a state’s planned expenditure is also large, while a smaller gap can represent a substantial burden when spending levels are more limited.
Roadway maintenance exerts budget pressure on states
States’ GTE ratios reveal a wide spectrum of budget pressures throughout the country. Among the 24 states with shortfalls, five have GTE ratios above 100%, meaning that their funding gaps exceed their total planned expenditures: New York (173%), Oregon (161%), Connecticut (161%), Michigan (138%), and New Mexico (129%). (See Table 1.) To close their gaps, these states will need to more than double what they have budgeted for roadway maintenance, and as a result, are unlikely to meet their road and bridge condition targets without potentially significant policy changes or reallocation of other capital investment priorities. Absent such action, these states may face growing maintenance backlogs and higher repair costs over time. New York, for instance, not only has the nation’s highest GTE ratio, but also its largest non-interstate pavement condition gap: The state projects that nearly 28% of its lane miles will be in poor condition after 10 years—more than three times the state’s target of 8%.
By contrast, the four states with the lowest GTE ratios—Kansas (2%), New Jersey (3%), New Hampshire (6%), and Oklahoma (7%)—would need to increase planned expenditures by less than 10% to meet roadway maintenance needs, suggesting that modest budget adjustments might be sufficient to address reported shortfalls.
The remaining 15 states have GTE ratios ranging from 10% to 76%, which indicates that although they are not facing the most intense budget pressures, many would still need to meaningfully increase planned spending to satisfy maintenance requirements.
The GTE ratio shows that roadway maintenance funding challenges exist along a continuum, enabling policymakers to calibrate their investments, while also providing an early warning of possible future problems to support long-term planning.
Table 1
States’ GTE Ratios Reveal Funding Gap Severity That Dollar Totals Can Obscure
Budgeted and needed funding, shortfall, and gap-to-expenditure ratio, by state, in millions of dollars
|
State |
Budget |
Need |
Gap |
GTE ratio |
|
Michigan |
$11,473 |
$27,287 |
$15,814 |
138% |
|
New York |
$8,895 |
$24,250 |
$15,355 |
173% |
|
Connecticut |
$6,349 |
$16,550 |
$10,201 |
161% |
|
California |
$35,130 |
$43,800 |
$8,670 |
25% |
|
Pennsylvania |
$21,585 |
$29,735 |
$8,150 |
38% |
|
Oregon |
$2,976 |
$7,777 |
$4,801 |
161% |
|
New Mexico |
$2,322 |
$5,310 |
$2,988 |
129% |
|
Kentucky |
$6,755 |
$9,540 |
$2,785 |
41% |
|
Illinois |
$22,451 |
$24,742 |
$2,291 |
10% |
|
Washington |
$4,902 |
$7,179 |
$2,277 |
46% |
|
Massachusetts |
$7,323 |
$9,138 |
$1,815 |
25% |
|
Arkansas |
$10,055 |
$11,825 |
$1,770 |
18% |
|
Rhode Island |
$3,649 |
$5,416 |
$1,767 |
48% |
|
Minnesota |
$1,843 |
$3,243 |
$1,400 |
76% |
|
Colorado |
$3,662 |
$5,062 |
$1,400 |
38% |
|
Maryland |
$4,708 |
$5,880 |
$1,172 |
25% |
|
Iowa |
$6,492 |
$7,607 |
$1,115 |
17% |
|
Alabama |
$6,240 |
$7,011 |
$771 |
12% |
|
Vermont |
$3,317 |
$3,762 |
$445 |
13% |
|
West Virginia |
$3,630 |
$4,049 |
$419 |
12% |
|
Oklahoma |
$5,392 |
$5,752 |
$360 |
7% |
|
New Jersey |
$11,155 |
$11,515 |
$360 |
3% |
|
New Hampshire |
$1,258 |
$1,338 |
$80 |
6% |
|
Kansas |
$2,831 |
$2,891 |
$60 |
2% |
|
Delaware |
$2,437 |
$2,437 |
$0 |
0% |
|
Florida |
$4,525 |
$4,525 |
$0 |
0% |
|
Hawaii |
$200 |
$200 |
$0 |
0% |
|
Idaho |
$1,938 |
$1,938 |
$0 |
0% |
|
Indiana |
$3,283 |
$3,283 |
$0 |
0% |
|
Maine |
$1,000 |
$1,000 |
$0 |
0% |
|
Mississippi |
$2,437 |
$2,437 |
$0 |
0% |
|
Montana |
$1,228 |
$1,228 |
$0 |
0% |
|
Nevada |
$2,518 |
$2,518 |
$0 |
0% |
Notes: States that did not report sufficient annual data to calculate a GTE ratio were excluded. A GTE of zero means the state has no funding gap.
Source: Pew analysis of funding data from states’ Transportation Asset Management Plans
Emma Wei is a manager, Elijah Gullett is a senior associate, and David Draine is a principal officer with The Pew Charitable Trusts’ state fiscal policy project.
People