Over a Third of Older Philadelphians’ Income Comes From Wages
Although most older households receive retirement income such as Social Security, many residents are working past age 65

Overview
In Philadelphia, the number of residents 65 and older has been growing in recent years, increasing by 22% since 2013, to 235,772 individuals in 2023.1 And this population will continue to expand—the U.S. Census Bureau estimates that 1 in 5 U.S. residents will be 65 or older by 2030; and by 2034, older residents will outnumber those under age 18.2
Yet this growing population faces economic insecurity and related challenges. Recent research by The Pew Charitable Trusts found that 35% of Philadelphia’s older residents had low incomes, meaning their incomes fell below the Census Bureau’s poverty threshold (23%) or just slightly above it (12%); the threshold represents an income of $14,330 or less for an older individual. These rates are higher than the national averages and those in many comparison cities.3 The findings led Pew to take a closer look at the types of income this population relies on, which are detailed below.
For this brief, Pew analyzed the income sources of Philadelphia’s 153,694 older households using the Census Bureau’s American Community Survey Public Use Microdata Sample five-year estimates from 2019 through 2023. An older household was defined as one in which the “householder”—most frequently the individual who owns or rents the housing unit—was 65 or older.4

Older households often rely on multiple types of income. Social Security was the top income source, with 84% of senior households receiving the benefit; it was the largest source of household income for 45% of households. The second most frequently reported type of income was retirement funds, which include personal and employer-sponsored retirement accounts—IRAs, Roth IRAs, 401(k)s, and 403(b)s—as well as pension plans and survivor and disability income. Overall, 50% of older households received income from these sources, with 17% citing them as the largest source of income.5 The third main source was wages, with 36% of older households reporting earned income, including 24% for which it was the largest income source.
Other key takeaways from this research:
- Income from three sources—Social Security, other retirement funds, and wages—made up 83% of all older households’ cumulative income. (The rest came from interest, dividends, and net rental income; self-employment; Supplemental Security Income; public assistance; and other sources, as reported in the American Community Survey.) Wages represented the largest share, at 36%; an estimated 54,577 households received income from wages.
- Older households’ median income ($39,412) was 59% of that for younger households ($67,289).
- There were significant differences among older households based on race: Non-Hispanic Black or African American households had a median income of $30,931, compared to $54,428 for their non-Hispanic White counterparts.
- Social Security income made up 62% of the total household income of older households with incomes below the median level, and it kept a quarter of older households above the federal poverty line.
When looking at the population of older households in Philadelphia, sample sizes present certain constraints, particularly for some racial and ethnic groups. As a result, some parts of this analysis show findings by race for non-Hispanic White and non-Hispanic Black and African American households, but the survey samples were too small to report findings for Hispanic and Asian households.6
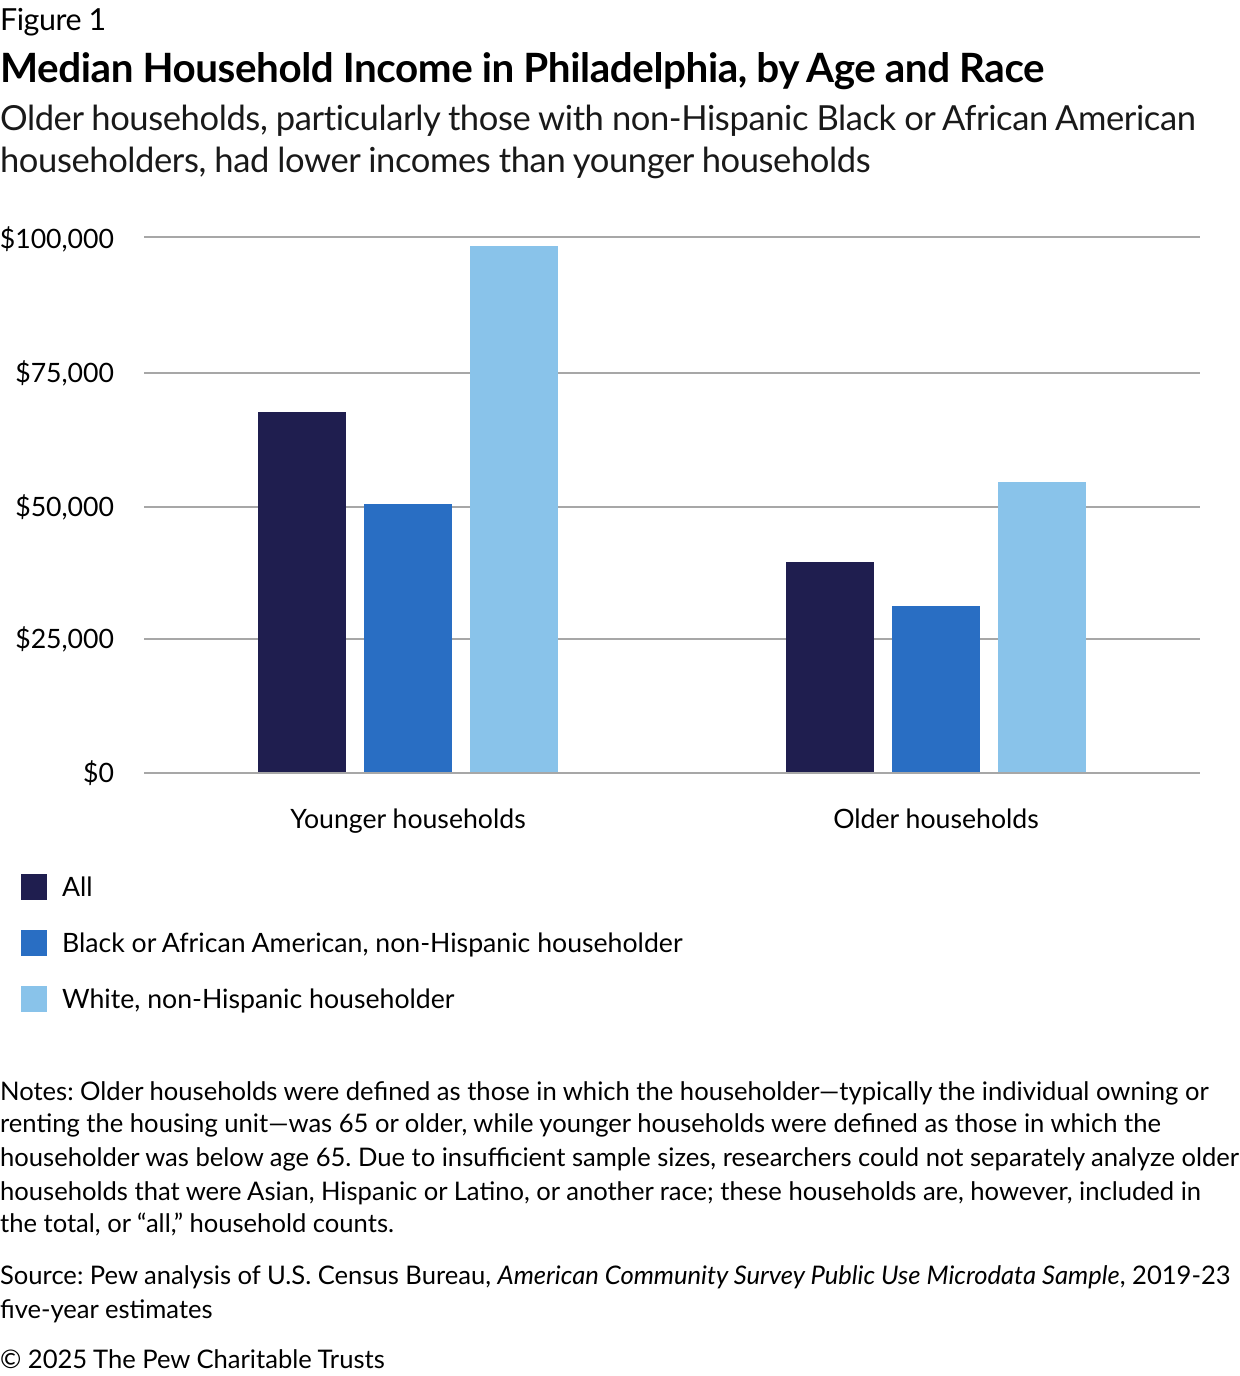
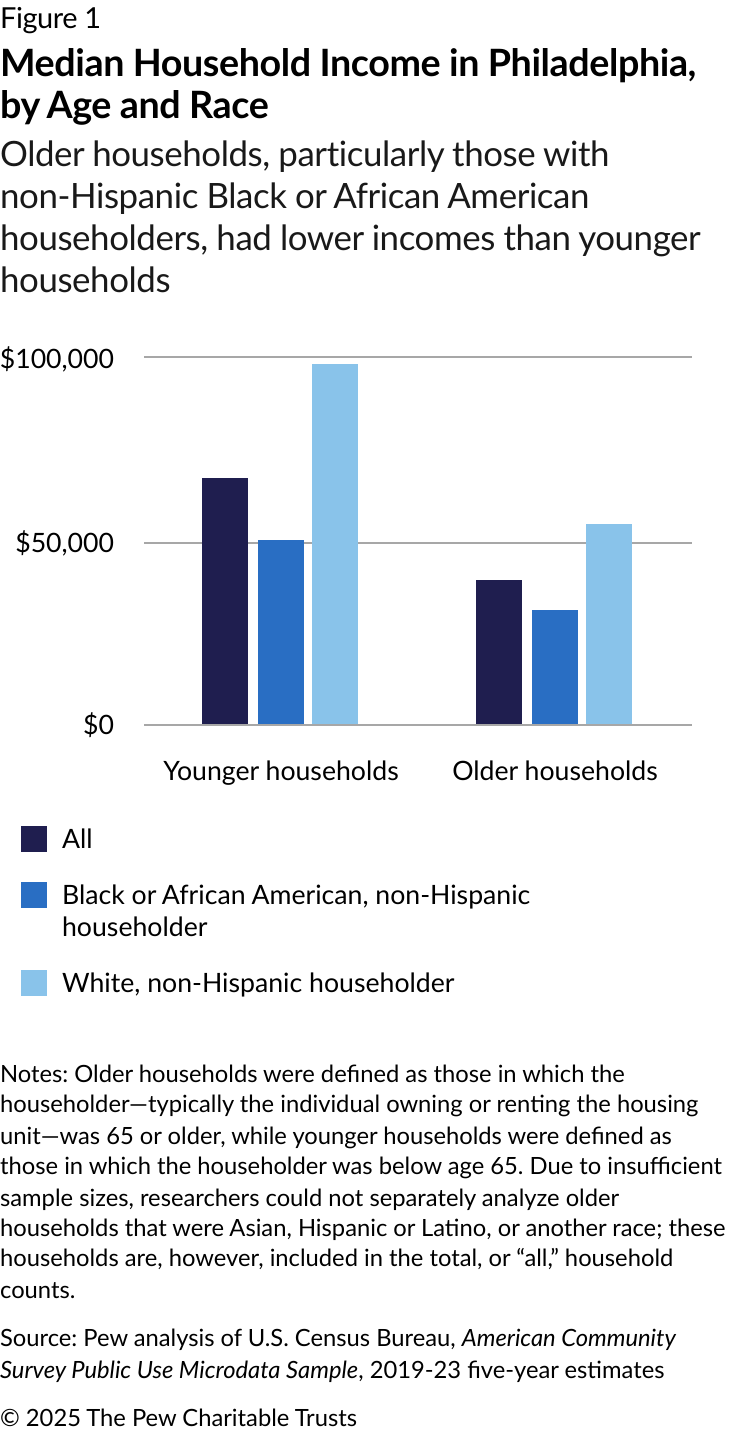
Older households in Philadelphia had lower incomes than younger ones
In Philadelphia, older households had a median income ($39,412) that was 59% of the median level for younger households ($67,289). Younger households are defined as those with householders below age 65. As was the case with households of all ages, older non-Hispanic Black or African American households had a lower median income ($30,931) than White, non-Hispanic households ($54,428). (See Figure 1.)
Sources of income varied depending on total household income and age
In 2023, older households in Philadelphia had a cumulative income of $10.3 billion, 17% of the total household income in Philadelphia. Even though many individuals in these households were at or approaching retirement age, wages were the largest source of income for older households: $3.7 billion, or 36%. And although a larger share of older households received income from Social Security than from wages, only about 25% of cumulative income, or $2.7 billion, came from Social Security. Over 20%, or $2.2 billion, came from retirement funds. (See Figure 2.)
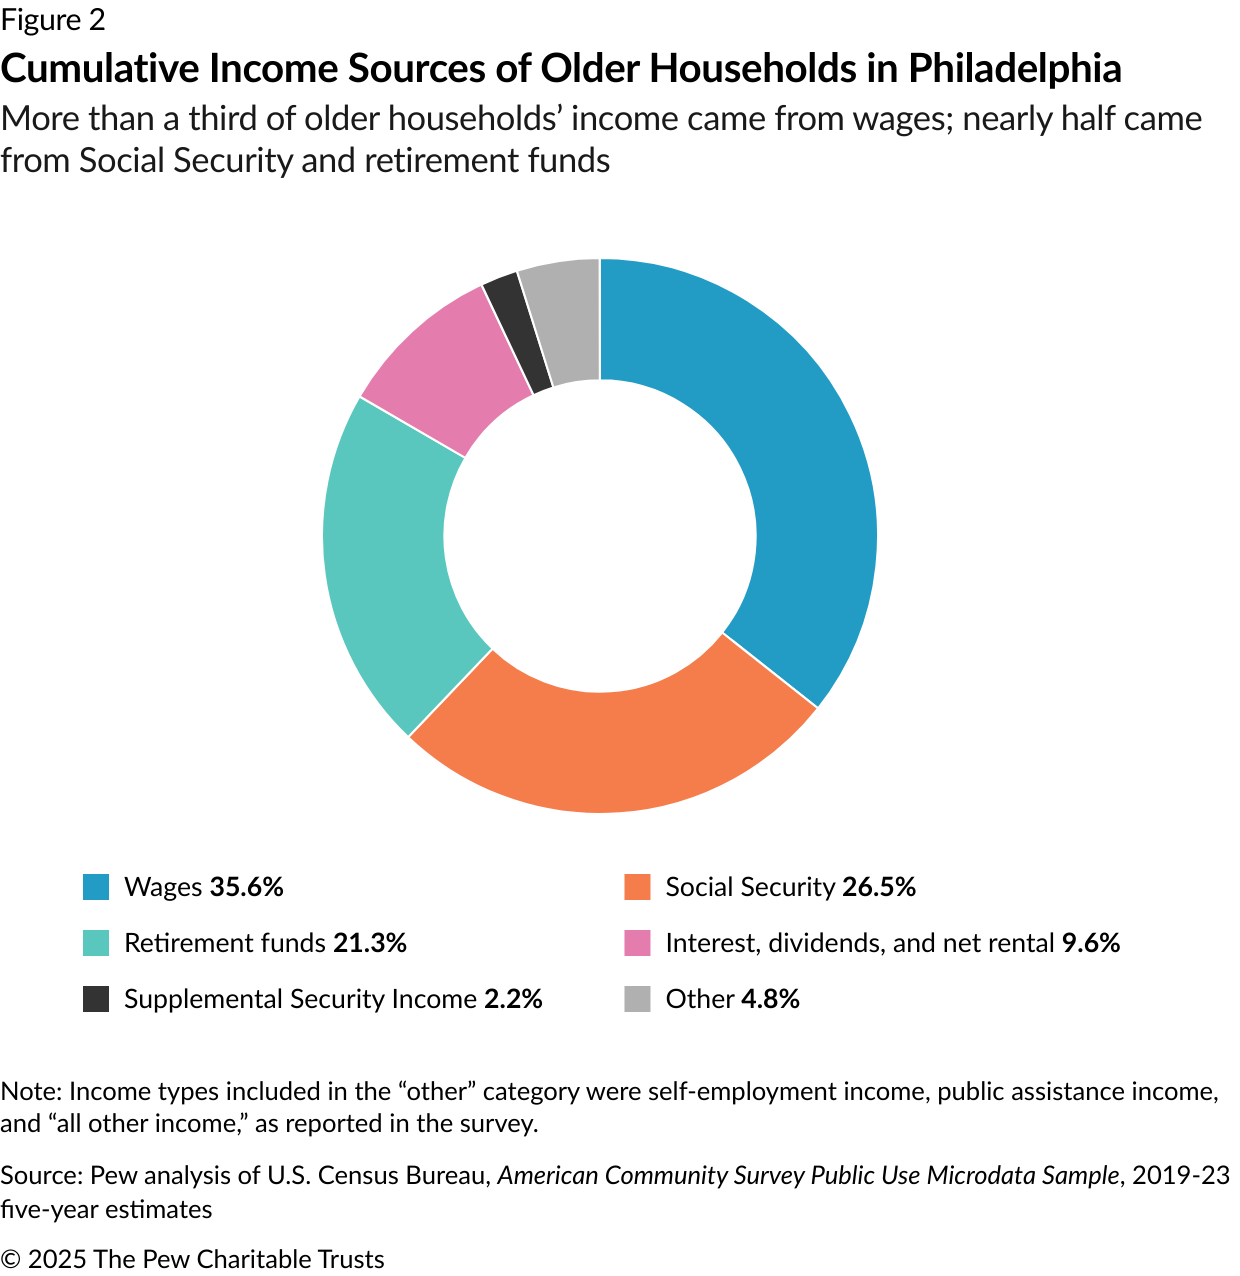
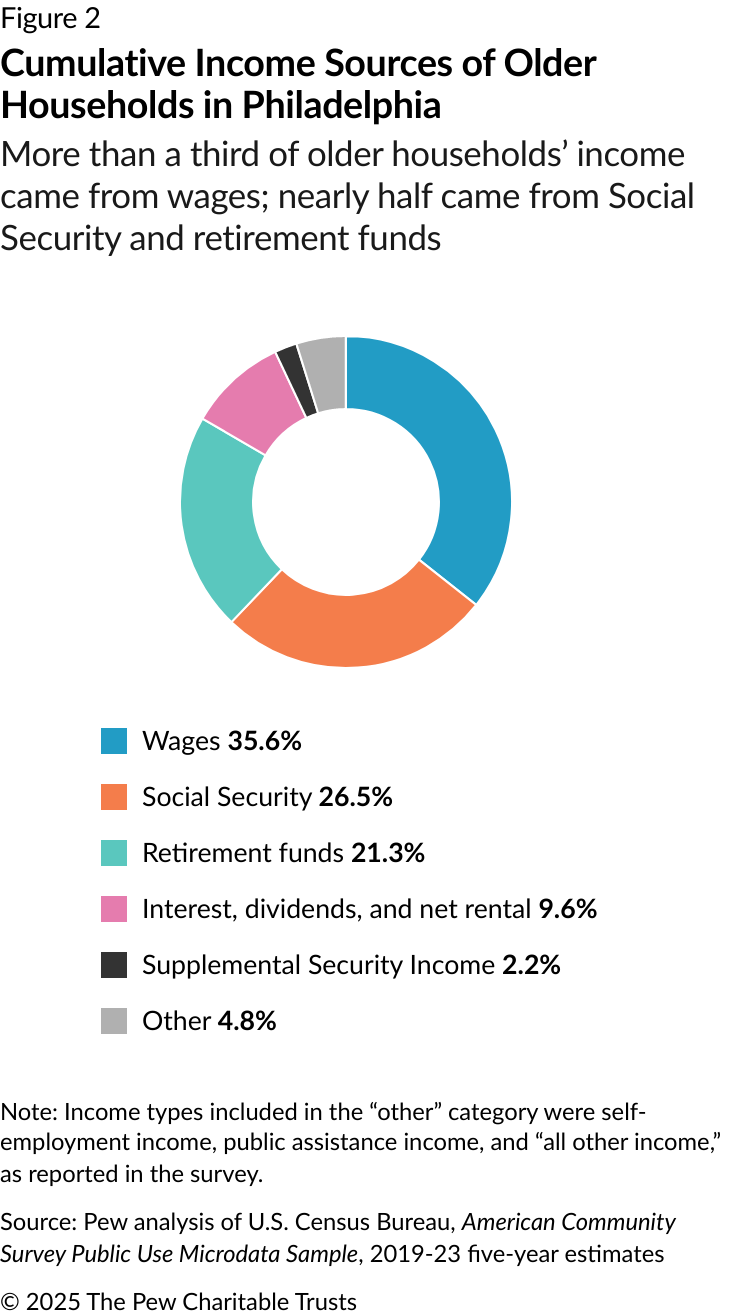
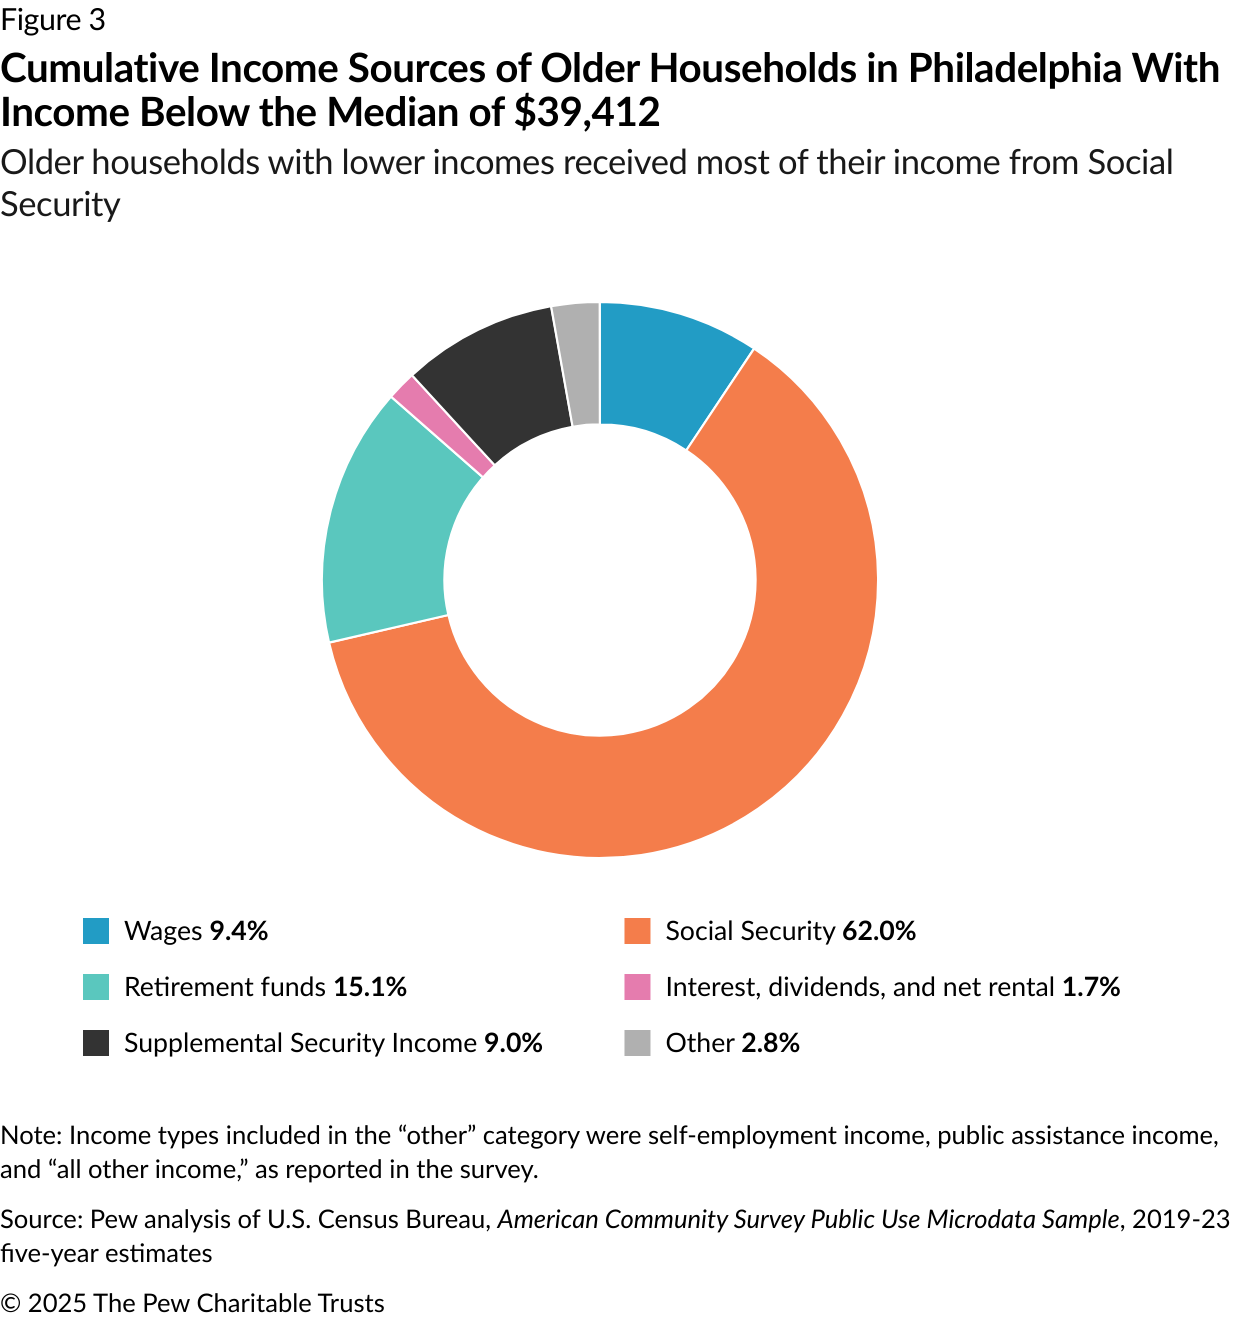
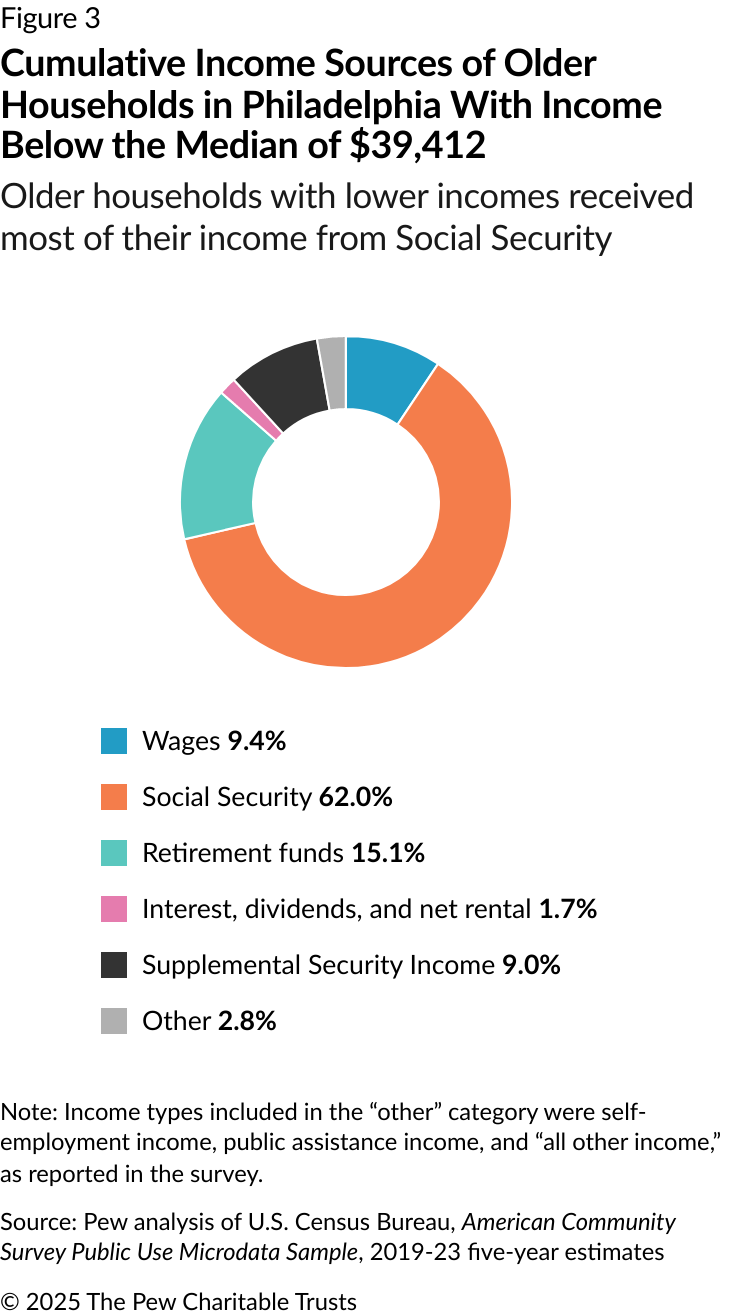
Of the $10.3 billion cumulative total income for older households, just 14%, or $1.5 billion, was generated by the 50% of households living below the $39,412 median household income level. And for these lower-income households, the income source breakdown differed widely from those for all older households. (See Figure 2.)
Social Security was the largest source of income for lower-income households, at 62%, followed by retirement funds, at 15%. Supplemental Security Income (SSI), a program that provides funds to older and disabled individuals with limited income and resources, made up 9% of income sources, as did wages.7 (See Figure 3.)
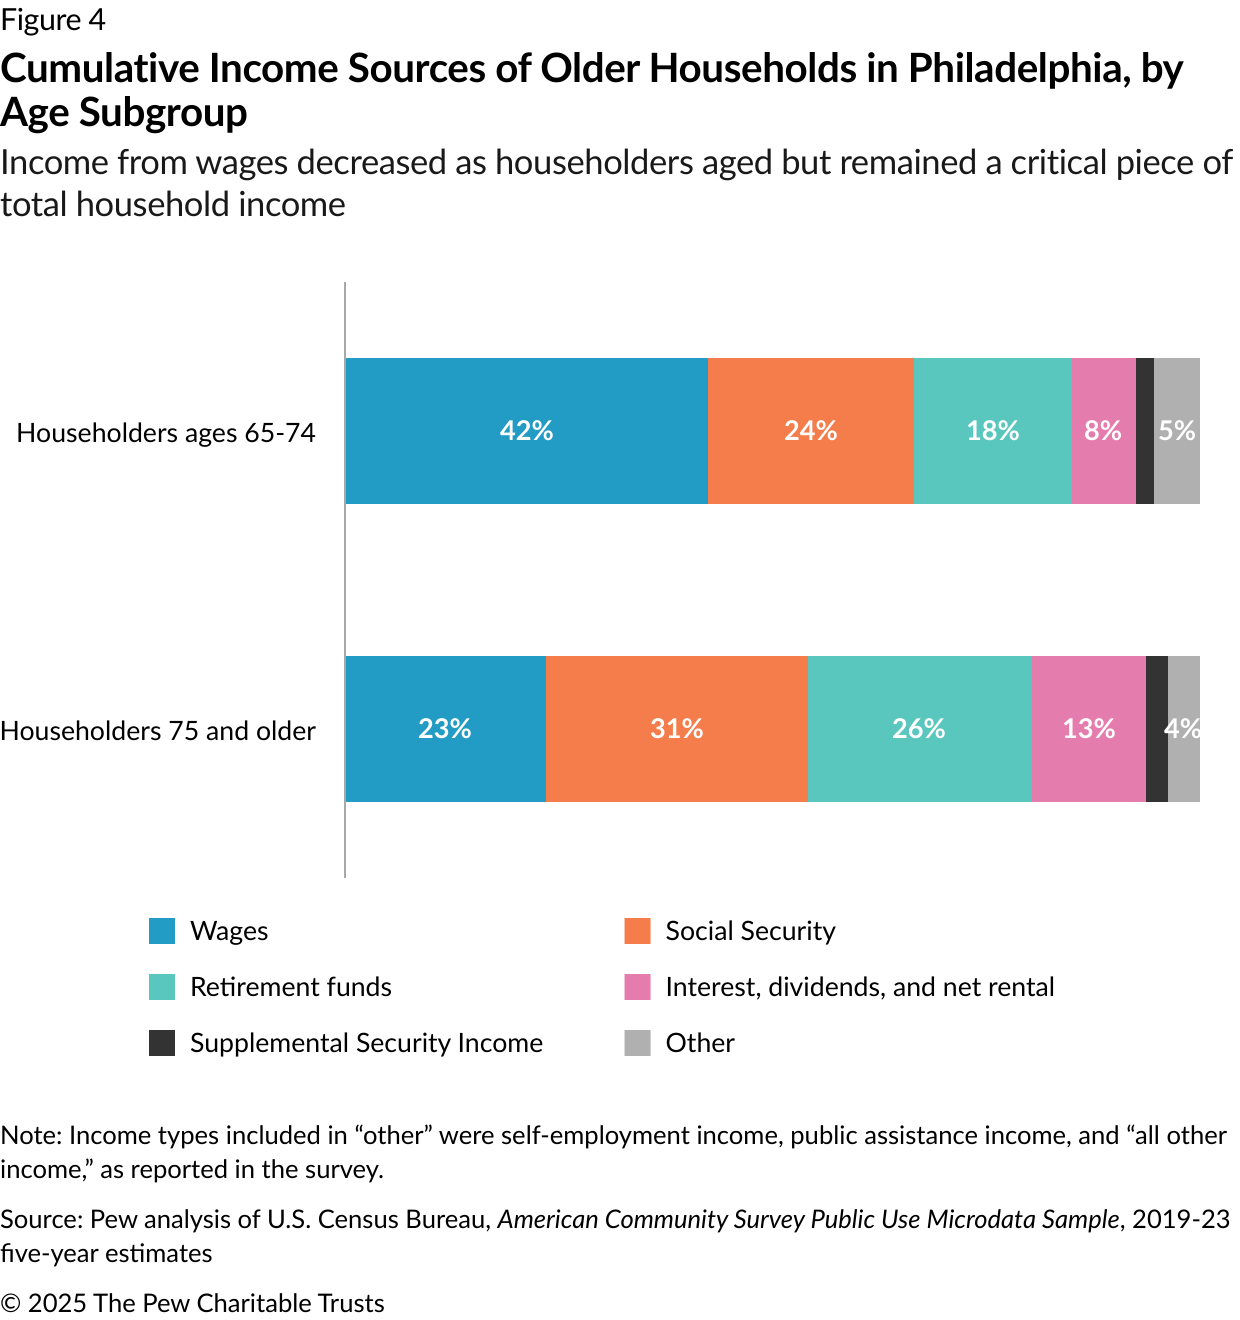
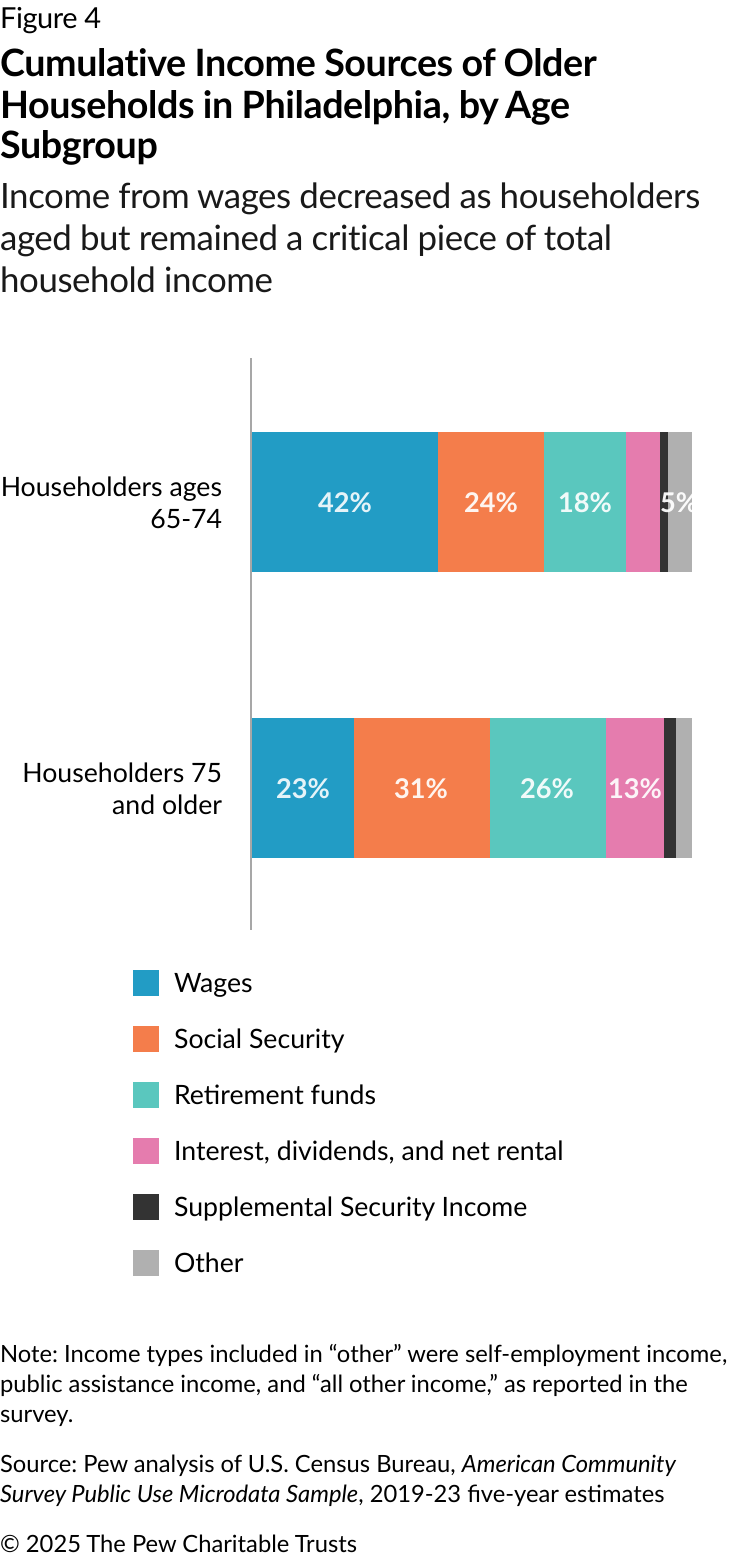
The percentages of the income sources also varied by household age—the younger the senior household, the larger the wage percentage. For households led by someone ages 65-74, 42% of total household income was derived from wages; about 45% of these households reported earned income. Households led by individuals 75 or older received 23% of total household income from wages, with 21% of these households reporting earned income. (See Figure 4.) These households may have some income earned by other, younger household members. However, many households in this age group consisted of single individuals. In any event, the data indicates that many Philadelphians are working well into their 70s.
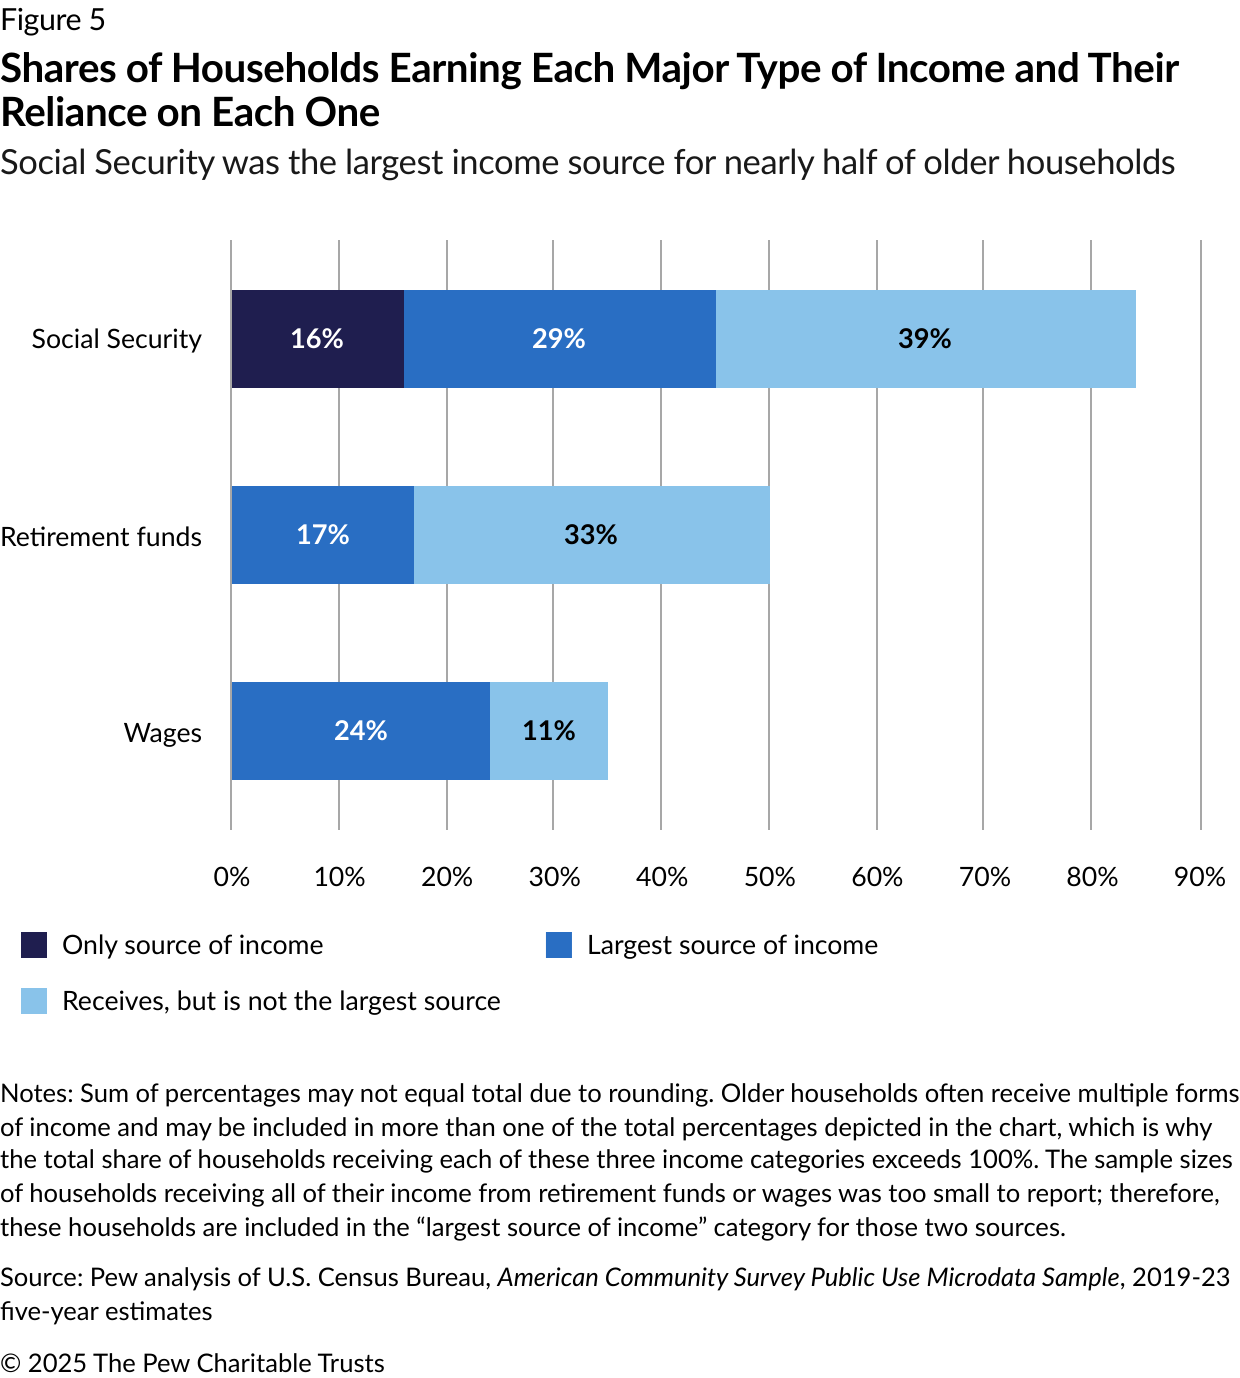
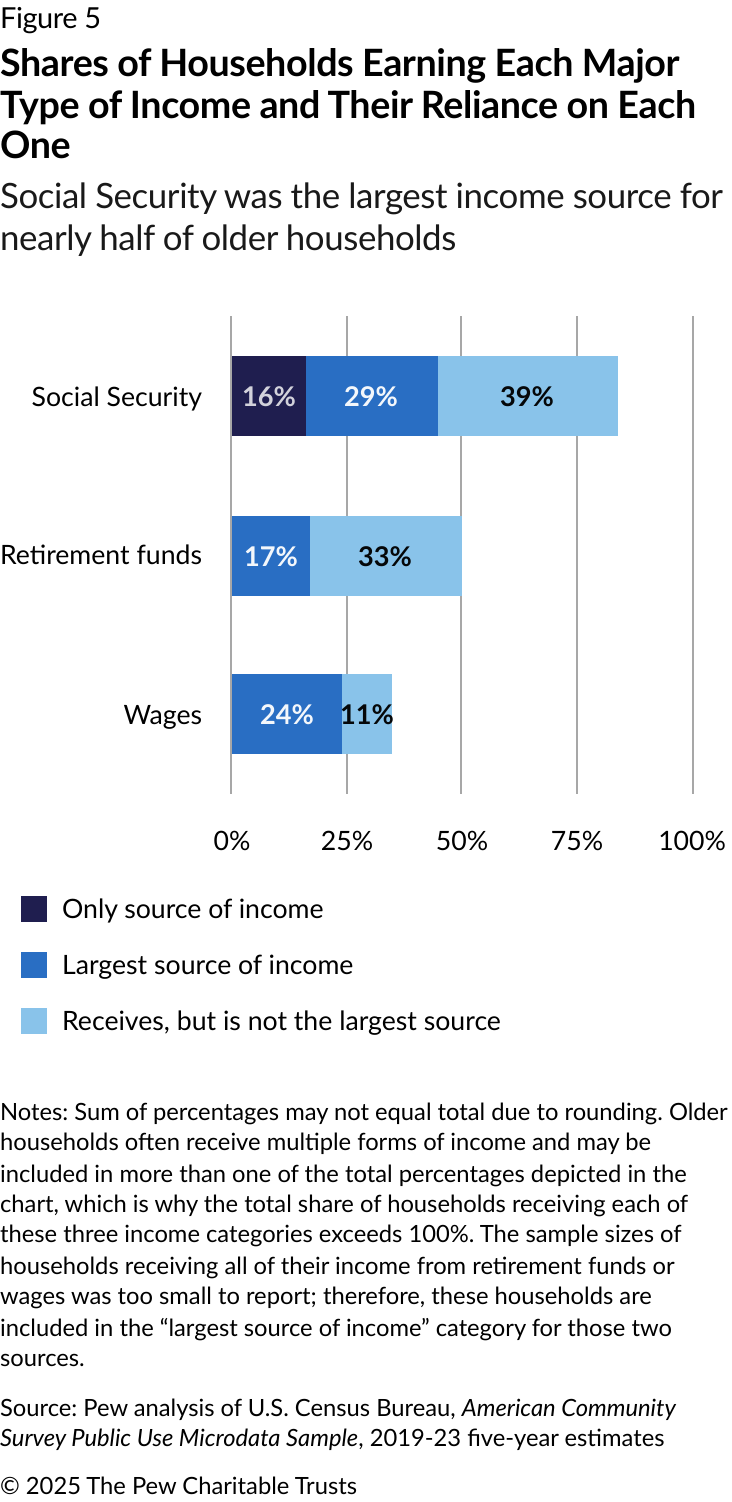
How much older households relied on various income sources
For older households, 84% received Social Security, 50% had income from retirement funds excluding Social Security, and 36% earned wages. For all senior households, 16% reported that all of their household income was from Social Security, while an additional 29% cited Social Security as their largest (though not only) source; 24% said wages were their largest source, and 17% cited retirement funds. (See Figure 5.) For the other 14%, income came primarily from SSI; interest, dividends, and net rental income; “other” income; self-employment income; and public assistance income. And 2% of older households reported no income.
Because many older households received income from multiple sources, Pew analyzed the median share that each major income source—Social Security, retirement funds, and wages—made up of total household income. For those receiving Social Security, the median share from that source was 50%, including households that received all of their income from Social Security, and the median amount was $18,840. Households receiving other retirement funds got about 33% of their median income from that source, with a median amount of $15,417. And among households earning wages, those earnings accounted for the majority of total household income, with a median share of 60% and a median amount of $41,550.

The differences in the share and amount of total income led to significant differences in overall household income levels as well. Of the three major sources of income, older households receiving any amount of Social Security had the lowest median total household income ($41,676). This includes households for which Social Security was the only source of income, which had a median total income of just $15,301. Older households receiving any amount of retirement fund income (alone or with other sources, including Social Security) had a higher median income ($57,970), while older households receiving wages (alone or with other sources) had the highest median income ($78,503). (See Table 1.)
Table 1
Median Older Household Income in Philadelphia, by Income Source
| Income Source | Median Total Household Income |
|---|---|
| Social Security | $41,676 |
|
Social Security only |
$15,301 |
| Retirement funds (other than Social Security) | $57,970 |
| Wages | $78,503 |
| Notes: For the table rows labeled “Social Security,” “retirement funds (other than Social Security),” and “wages,” the median household income calculation includes households receiving any dollar amount from that source, whether that source made up 100% of total income or included other forms of income. Therefore, households that received more than one of these income sources are included in multiple rows. For example, a household receiving some income from Social Security, retirement funds, and wages would be included in the calculation for median total household income in each of the rows. The households in the row “Social Security only” received all household income from that source. The number of households receiving 100% of household income from retirement funds or wages was too small to report separately. Source: Pew analysis of U.S. Census Bureau, American Community Survey Public Use Microdata Sample, 2019-23 five-year estimates |
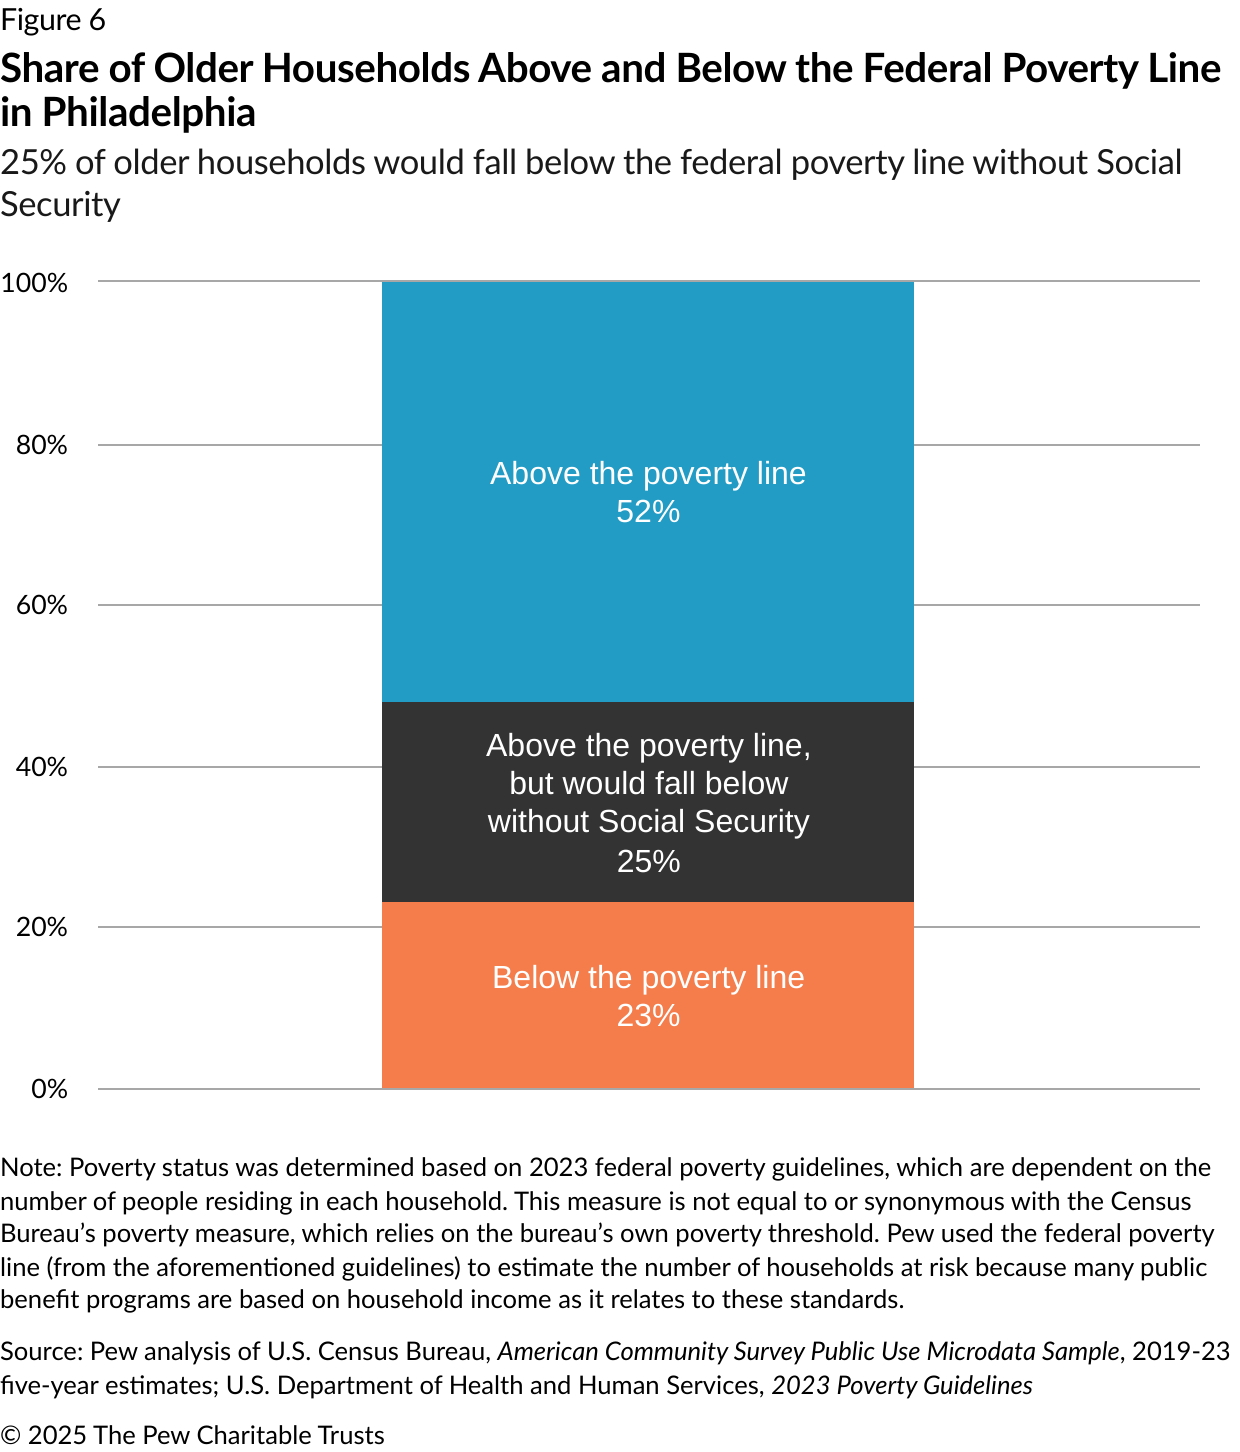
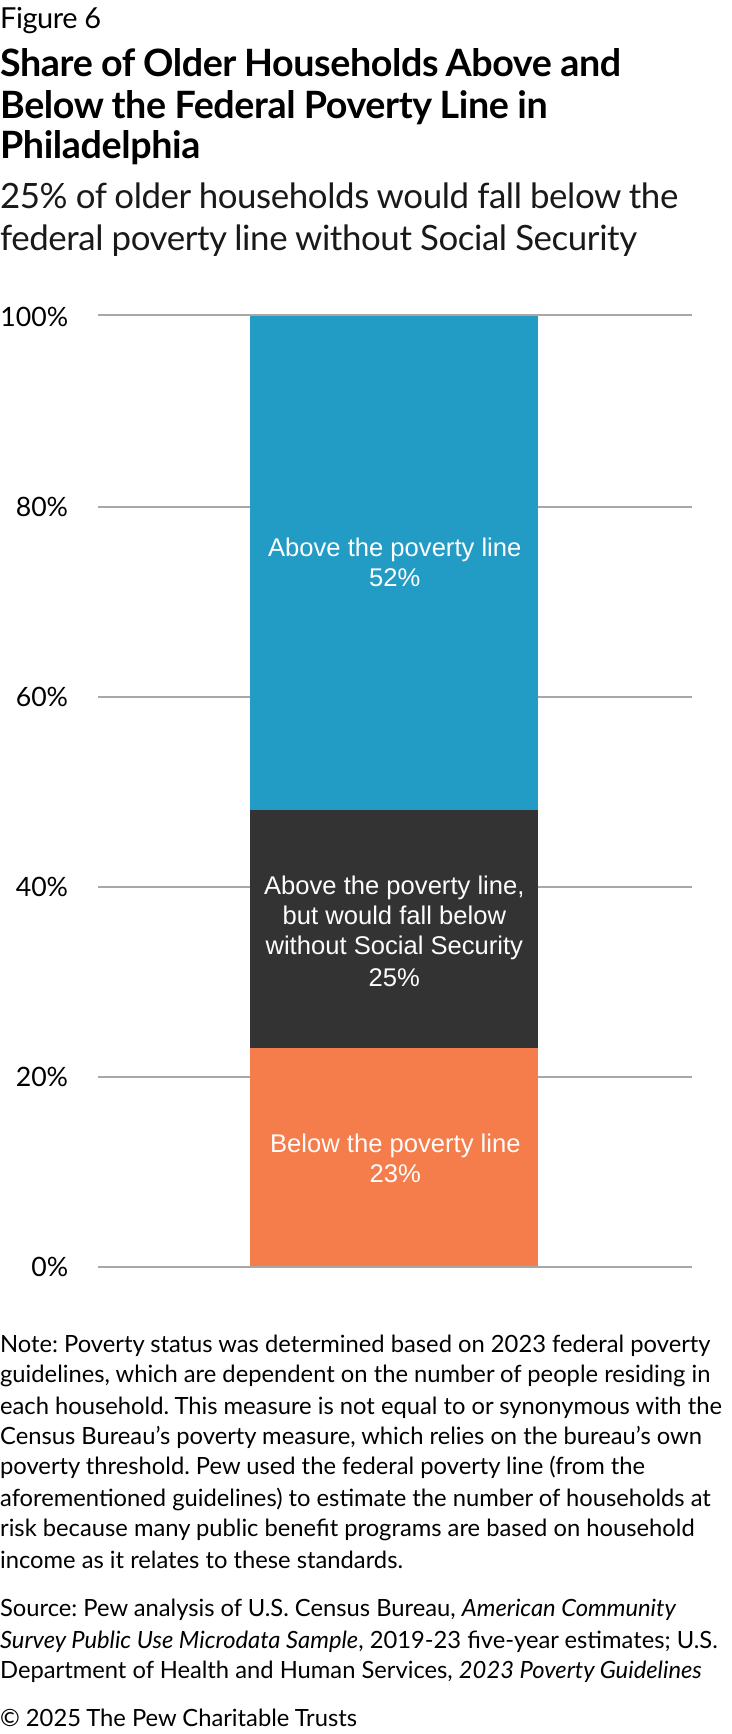
Social Security helped keep a quarter of older households above the poverty line
Approximately 23% of all older households in Philadelphia had household incomes below the federal poverty line. Without Social Security, that percentage would be much higher. Most older households received some amount of Social Security income, and Pew found that this income kept 25% of older households above the poverty line. (See Figure 6.) If many households were to stop receiving income from Social Security, or if the amount in those checks were reduced, they might rely more heavily on wages or assistance from other federal programs, which could also affect their poverty status. So, the 25% figure should be viewed as an upper-bound estimate of older households’ reliance on Social Security to keep them out of poverty.8
Conclusion
Many households rely on multiple types of income, but the income sources available for older households can be more limited, especially for those over age 65 who are unable or unwilling to work. In addition, many older households live near or below the poverty line. Likely due in part to these concerns, a number of older households still rely on wages.

As the city, like the rest of the country, continues to skew older, it is increasingly important to pay attention to the financial health and reliability of Social Security and other retirement funds—and how they affect older Philadelphians.
Methodology
The data in this issue brief was derived from the U.S. Census Bureau’s American Community Survey Public Use Microdata Sample five-year estimates for 2019 through 2023. Because this data represents a sample of the population, it includes household-level weights, which Pew used to calculate citywide estimates. So as not to report unreliable data due to insufficient sample sizes, the analysis had a margin of error threshold of plus-or-minus 10% of survey estimates.
Endnotes
- “American Community Survey Table S0103: Population 65 Years and Over in the United States,” U.S. Census Bureau, https://data.census.gov/table/ACSST1Y2023.S0103?q=s0103.
- U.S. Census Bureau, “Older People Projected to Outnumber Children for First Time in U.S. History,” news release, March 13, 2018, https://www.census.gov/newsroom/press-releases/2018/cb18-41-population-projections.html#:~:text=%E2%80%9CBy%202034%20(previously%202035),decade%20for%20the%20U.S.%20population.
- The Pew Charitable Trusts, “35% of Older Philadelphians Live Below or Near the Poverty Line,” 2025, https://www.pew.org/en/research-and-analysis/issue-briefs/2025/06/35-percent-of-older-philadelphians-live-below-or-near-the-poverty-line.
- American Community Survey and Puerto Rico Community Survey 2023 Subject Definitions,” U.S. Census Bureau, https://www2.census.gov/programs-surveys/acs/tech_docs/subject_definitions/2023_ACSSubjectDefinitions.pdf. According to the Census Bureau’s American Community Survey, “one person in each household is designated as the householder. In most cases, this is the person or one of the people in whose name the home is owned, being bought, or rented and who is listed on line one of the survey questionnaire. If there is no such person in the household, any adult household member 15 years old and over could be designated as the householder.” In total, 86% of the city’s older residents were represented among the households included in this analysis. Older residents not included were those living in households with householders under age 65 (11%) and those living in group quarters (3%).
- “American Community Survey and Puerto Rico Community Survey 2023 Subject Definitions,” U.S. Census Bureau.
- “American Community Survey and Puerto Rico Community Survey 2023 Subject Definitions,” U.S. Census Bureau. In defining how race variables are reported, “the U.S. Census Bureau collects race data in accordance with guidelines provided by the U.S. Office of Management and Budget (OMB), and these data are based on self-identification.” Pew categorized households into the following groups, based on the race and ethnicity of the householder: non-Hispanic White, non-Hispanic Black, non-Hispanic Asian, Hispanic or Latino of any race, and other. Therefore, not all individuals within a household unit necessarily fall under the same racial and ethnic group by which the household as a whole was categorized.
- “Supplemental Security Income (SSI),” Social Security Administration, https://www.ssa.gov/ssi.
- Center on Budget and Policy Priorities, “Social Security Lifts More People Above the Poverty Line
Than Any Other Program,” 2025, https://www.cbpp.org/research/social-security/social-security-lifts-more-people-above-the-poverty-line-than-any-other. This analysis adapts the methodology from the Center on Budget and Policy Priorities report cited by using the Census Bureau’s American Community Survey Public Use Microdata Sample instead of the Census Bureau’s Current Population Survey and by focusing on the impact of Social Security in Philadelphia.
People


