More Employment Opportunities in Philadelphia, Especially in Higher-Income Occupations
Data shows disparities among neighborhoods such as Cobbs Creek and Brewerytown in availability of better-paying jobs

The employment picture for Philadelphians looks quite different from the way it did before the COVID-19 pandemic; in fact, it has gotten better by some metrics.
The most recent data from the U.S. Census Bureau shows a higher percentage of city residents age 16 and older in the labor force, meaning they were employed or actively looking for work. Nearly two-thirds (64%) were actively in the labor force, according to 2020-24 census data, up from 61% in the 2015-19 data. The earlier five-year data span includes the last year before the pandemic arrived. In addition, a higher share reported being employed, 58.4% in the most recent data compared with 55% in the earlier period. The percentage improved across numerous demographic categories including race, disability, sex, and age groups.1
To gain insight into the city’s jobs numbers, researchers for The Pew Charitable Trusts focused on two neighborhoods with higher employment increases than the citywide rate—Brewerytown and Cobbs Creek. (See Figure 1.)
The growth in the jobs held by Philadelphians was primarily concentrated in two high-wage categories—computer, engineering, and science occupations; and management, business, and financial fields. The number of residents working in positions near the bottom of the income ladder declined slightly. (See Table 1.) In this dataset, jobs are classified by the nature of the work itself, rather than by the employer’s industry sector.2
Table 1
Changes in Employment by Occupation in Philadelphia
Comparison of data for 2015-19 and 2020-24
| Occupations | Number Employed (2015–19) | Number Employed (2020–24) | Percentage Change in Employment | Median Earnings (2020–24) |
|---|---|---|---|---|
| Computer, engineering, and science occupations | 36,593 | 56,146 | 53% | $81,693 |
| Management, business, and financial occupations | 97,125 | 123,832 | 27% | $79,423 |
| Healthcare practitioners and technical occupations | 51,331 | 56,283 | 10% | $77,768 |
| Education, legal, community service, arts, and media occupations | 90,721 | 99,525 | 10% | $56,165 |
| Natural resources, construction, and maintenance occupations | 40,727 | 36,125 | -11% | $48,044 |
| Sales and office occupations | 140,949 | 131,407 | -7% | $40,596 |
| Production, transportation, and material moving occupations* | 84,795 | 84,291 | -1% | $35,316 |
| Service occupations* | 159,864 | 159,194 | 0% | $29,446 |
Note: Asterisks denote those instances where the differences between the number of those employed from 2015-19 and 2020-24 are not statistically significant.
Sources: U.S. Census Bureau, “American Community Survey Table S2301: Employment Status,” 2015-19 and 2020-24; U.S. Census Bureau, “American Community Survey Table S2411: Occupation by Sex and Median Earnings in the Past 12 Months (in 2024 inflation-Adjusted Dollars) for the Civilian Employed Population 16 Years and Over,” 2020-24
These shifts occur as educational attainment, a key to accessing many employment opportunities, also has been rising in Philadelphia. Among residents ages 25 to 64, the share with a four-year college degree or higher rose from 32% to 39% over the same period.
Most of the numbers provided here reflect the employment of city residents, regardless of whether they work in Philadelphia or somewhere else, and not the number of jobs specifically located in the city, which may or may not be held by residents. The 2020-24 five-year dataset includes two years in which the pandemic greatly impacted employment. Rates were highest in areas around Center City and in pockets of North Philadelphia and lower Kensington. Most areas of the city recorded employment rates between 50% and 75%.
Pew examined whether employment gains also resulted in increases in higher-paying occupations. Brewerytown and Cobbs Creek reflect aspects of the broader changes.

Despite more residents being employed in both neighborhoods in the more recent five-year period, residents of Brewerytown recorded a greater increase in higher-paying occupations than did those in Cobbs Creek. The differences in neighborhood demographics, especially in educational attainment, contribute to the differences in share of higher-paying occupations.
Cobbs Creek
The Cobbs Creek neighborhood in West Philadelphia borders Cobbs Creek to the west, North 52nd Street to the east, Market Street to the north, and Baltimore Avenue to the south.3 It is home to several notable landmarks, including the Malcolm X Memorial, a park near the eastern border on 52nd Street, the Cobbs Creek Community Environmental Center and Park that borders the neighborhood to the west, and the Blanche A. Nixon library.
“Cobbs Creek has beautiful architecture and is very transit accessible. Most neighbors are 60-and-over households—families that had moved from Mantua, which was called the Black Bottom at the time people were moving here,” said Monica Allison, co-founder of Cobbs Creek Neighbors, a civic group. Most people live in rowhomes, where nearly 9 in 10 residents (87%) are Black or African American.
Roughly one-quarter (24%) of residents ages 25 to 64 have a bachelor’s degree, a lower share than the 39% citywide. Compared with the previous five-year census data, there had been no significant changes in educational attainment.4
From 2015-19 to 2020-24, the employment rate for the neighborhood increased by 6 percentage points, from 49% to 55%, which was greater than the citywide increase. Even so, the employment rate was 3 percentage points below the citywide number.

According to Allison, initiatives to encourage the hiring of residents are having an impact. “There are large employers and workforce development organizations in the area like [Children’s Hospital of Philadelphia], [the University of Pennsylvania], Community College of Philadelphia, Southwest [Community Development Center], the Enterprise Center, Skills Initiative, and others that have been intentionally hiring locally and connecting people to employment opportunities,” she said.
In Cobbs Creek, 29% of those employed work in service occupations, followed by sales and office with 21%. Other occupations include education, legal, community services, arts, and media occupations (14%) and production, transportation, and material moving (13%). Higher-paying occupations—those in management, business, and financial occupations (9%) and computer, engineering, and science occupations (4%)—represented a smaller share.
Within the service category, the largest growth came in healthcare support jobs, which include home health aides, nursing assistants, and medical assistants. The number of residents employed in this occupation category increased from 1,370 to 2,000. These positions accounted for 12% of all jobs held by residents.
Employment rates ranged from 39% to 68% across the neighborhood. As shown in Figure 3, the northwest tract, near Market Street and the park, had some of the lowest levels of employment. Educational attainment may have played a factor; 84% of residents 25 to 64 in that tract did not have a college degree. The highest employment rate was in the southeast corner, the tract containing an area known as Cedar Park. Half of residents there had a bachelor’s degree or higher. And when it comes to jobs, that area had the highest share of those working in higher-paying occupations—those in finance, management, business, and computer engineering and science—compared to other areas of the neighborhood. (See Figure 2.)

Brewerytown
The North Philadelphia neighborhood of Brewerytown is bordered by West Glenwood Avenue to the west, West Girard Avenue to the south, North 25th Street to the east, and West Diamond Street to the north.5 It earned its name because of the abundance of breweries there in the late 19th and early 20th centuries.6
Talmadge Belo, vice president of the Brewerytown Sharswood Community Association, said his neighborhood is “a lot different than 26 years ago [when] it was single-family units with working-class residents. Now it’s leaning more towards smaller apartment-type constructions with more younger residents of mixed professional backgrounds.” The neighborhood has experienced some demographic shifts in recent years. As of the 2019-24 census data, this neighborhood had 25% White residents and 72% Black or African American, compared with the earlier 2015-2919 period, when 16% of residents were White and 81% Black or African American.
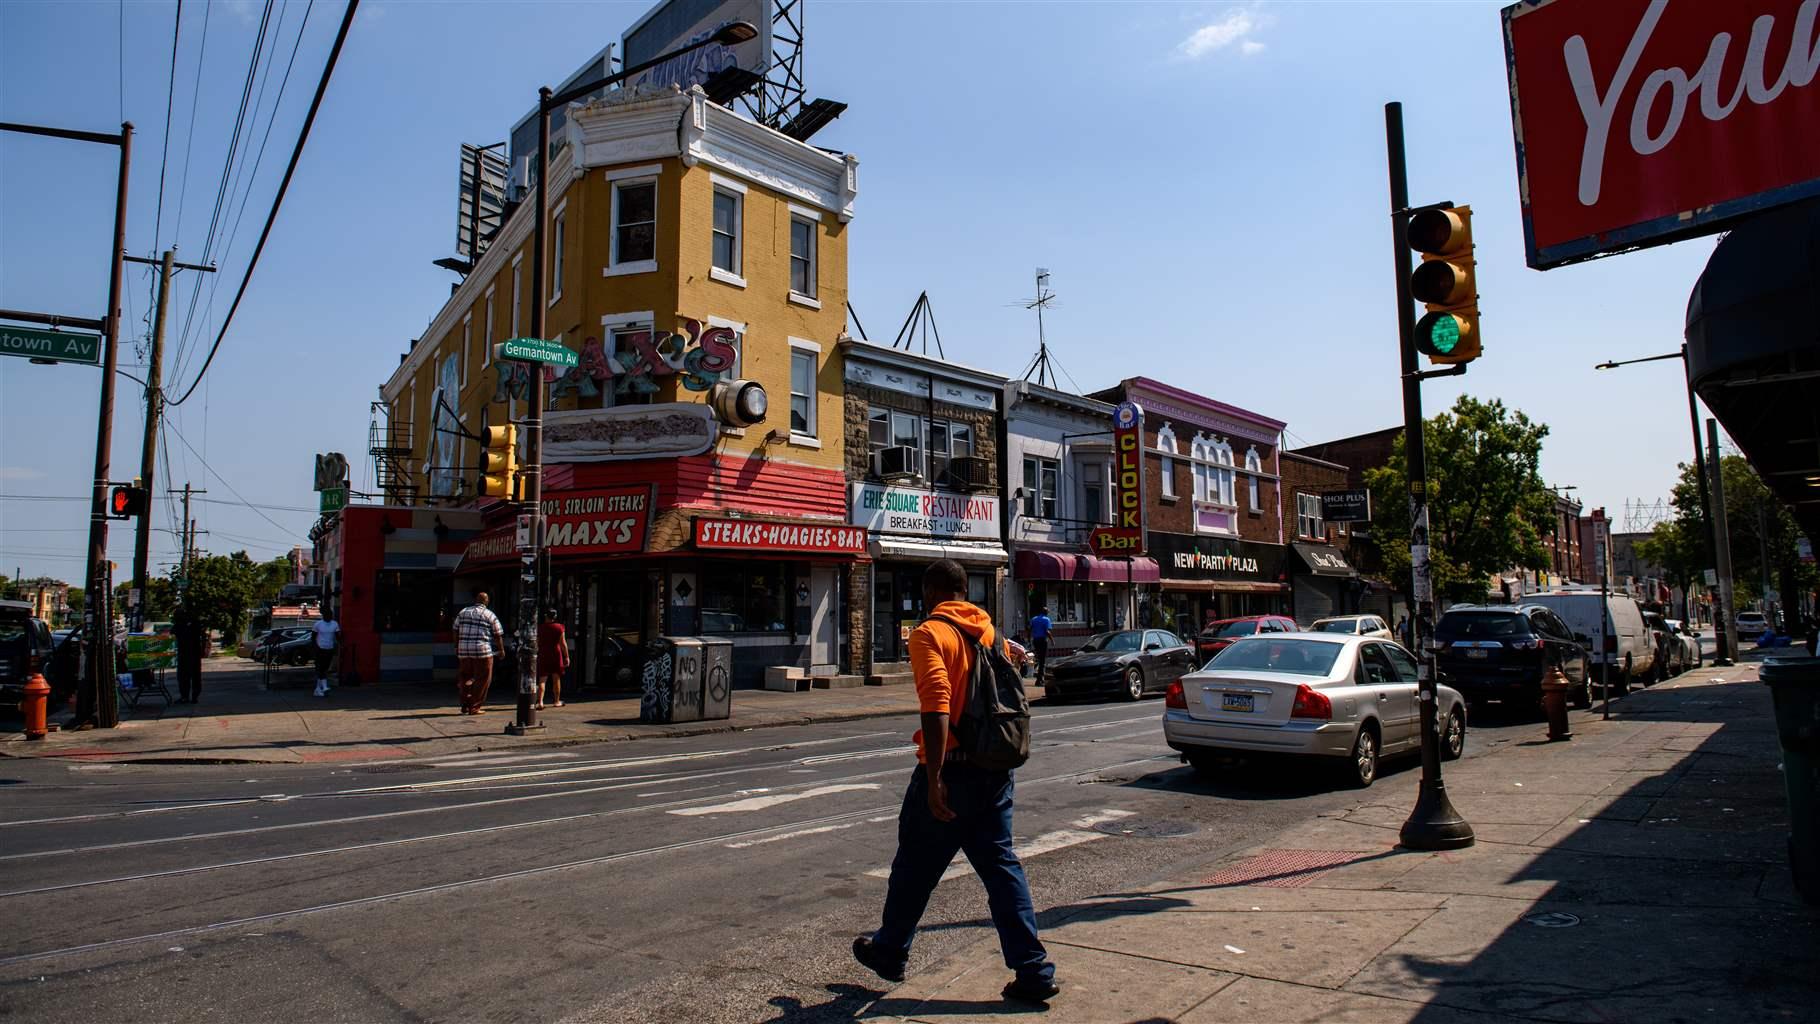
In this neighborhood, half of the adults (49%) have a college degree or higher. The same period showed the employment rate increasing by 12 percentage points, from 47% to 59%. The most common occupations for those employed are in management, business, and financial roles, which represent 20% of those employed, service occupations at 17%, and sales and office occupations, also at 17%.
Employment in management, business, and financial roles increased the most over the past five years—from 14% to 20% of those employed. Other occupations with increased shares were in computer, engineering, and science fields. These increased from 5% to 11% of those employed.
Employment varies across the neighborhood. The northernmost census tract had an employment rate of 34%, while in the southwest tract, the rate was 80%. This southwest tract, bordering Fairmount Park and Girard Avenue, also saw the greatest demographic changes.7 From 2015-19 to 2020-24, the percentage of Black residents in this tract fell from 66% to 51% and the share of residents ages 25 to 64 with a college degree or higher increased from 48% to 67%. As in Cobbs Creek, the tract that had the highest educational attainment also had the highest share of those employed in higher-paying occupations in management, business, and finance as well as technical and scientific jobs. (See Figure 3.)

Conclusion
Cobbs Creek and Brewerytown have each shared in the citywide trend of increased employment in recent years. But high-income jobs were much less prevalent in Cobbs Creek. There, the employment increase was greatest among service occupations, which generally have earnings below the citywide median income. Brewerytown, on the other hand, has undergone significant changes both in demographics and in educational attainment in recent years. Employment trends there show that jobs in management, business, and finance increased the most—occupations in the highest-earning category.
As the makeup of neighborhoods and employment trends shift, long-standing ties and communities are also changed. Speaking of the evolving Brewerytown, Belo said he would not want to lose characteristics that make his neighborhood a good place to live. “My biggest hope,” he said, “is that some of the old—how would you say?—camaraderie, some socialization that we enjoyed, continues.”
Endnotes
- “American Community Survey Table S2301: Employment Status,” U.S Census Bureau, https://data.census.gov. Employment across multiple demographics increased from 2015-19 to 2020-24. Employment for residents with any disability increased from 28% to 38%. Employment for males increased from 68% to 72% and for females from 66% to 70%. Age ranges were categorized by those 16-24, 25-54, 55-64, and 65-plus. Across all age categories, employment increased with those ages 25 to 54 increasing the most, from 73% to 77%. In terms of race and ethnicity, employment increased, ranging from White, non-Hispanic residents increasing by 2 percentage points to Black or African American residents increasing by 3 percentage points.
- “About Occupation,” U.S. Census Bureau, https://www.census.gov/topics/employment/industry-occupation/about/occupation.html.
- Cobbs Creek consists of Philadelphia census tracts 80, 81.01, 81.02, 82, 83.01, 83.02, 84, and 85.
- “Statistical Testing Tool,” U.S. Census Bureau, https://www.census.gov/programs-surveys/acs/guidance/statistical-testing-tool.html. The differences in educational attainment for those ages 25-64 in Cobbs Creek was not statistically different from 2015-19 to 2020-24. This was tested using the U.S. Census Bureau’s statistical testing tool.
- Brewerytown is composed of Philadelphia census tracts 137.01, 137.02, 138, 149, and 151.02.
- Hira Qureshi, “Explore Brewerytown: What to Eat, Drink, and Do,” The Philadelphia Inquirer, https://www.inquirer.com/philly-tips/brewerytown-philadelphia-neighborhood-guide-things-to-do-20230523.html.
- In 2015-19, the census tract referenced was Philadelphia census tract 137, and in 2020-24, the census tract was split into 137.01 and 137.02. To compare, we summed up measures of employment; race and ethnicity; and occupation of 137.01 and 137.02 to compare with census tract 137.
People


