People walking underneath and admiring a large floral installation made of colorful fabric and flowers that stretches across the ceiling of an exhibition space.
Attendees walk beneath a floral installation on the opening day of the Philadelphia Horticultural Society’s 2026 Flower Show at the Pennsylvania Convention Center.
Rob Cardillo

Overview

This is a year of celebration and remembrance for the United States. Commemorations for the nation’s 250th anniversary are taking place throughout 2026, nationwide and in Philadelphia and the metro region. Events include art installations and performances, TED Democracy speakers, museum exhibitions, and parades. In addition, Philadelphia and the surrounding area will be hosting major sporting events, including the FIFA World Cup tournament, the Major League Baseball All-Star Game, and the PGA Championship. It is a busy and exciting year for Philadelphians.

It’s a time to point to notable progress that the city has made on many of the most challenging issues facing its residents, including reductions in homicides and shootings, overdose deaths, and the poverty rate. But there are also troubling signs, including stagnating educational attainment, median income, and population. These metrics, which had been bright spots for the city in recent decades, have been impeded since the COVID-19 pandemic and pose a long-term risk to the city’s success.

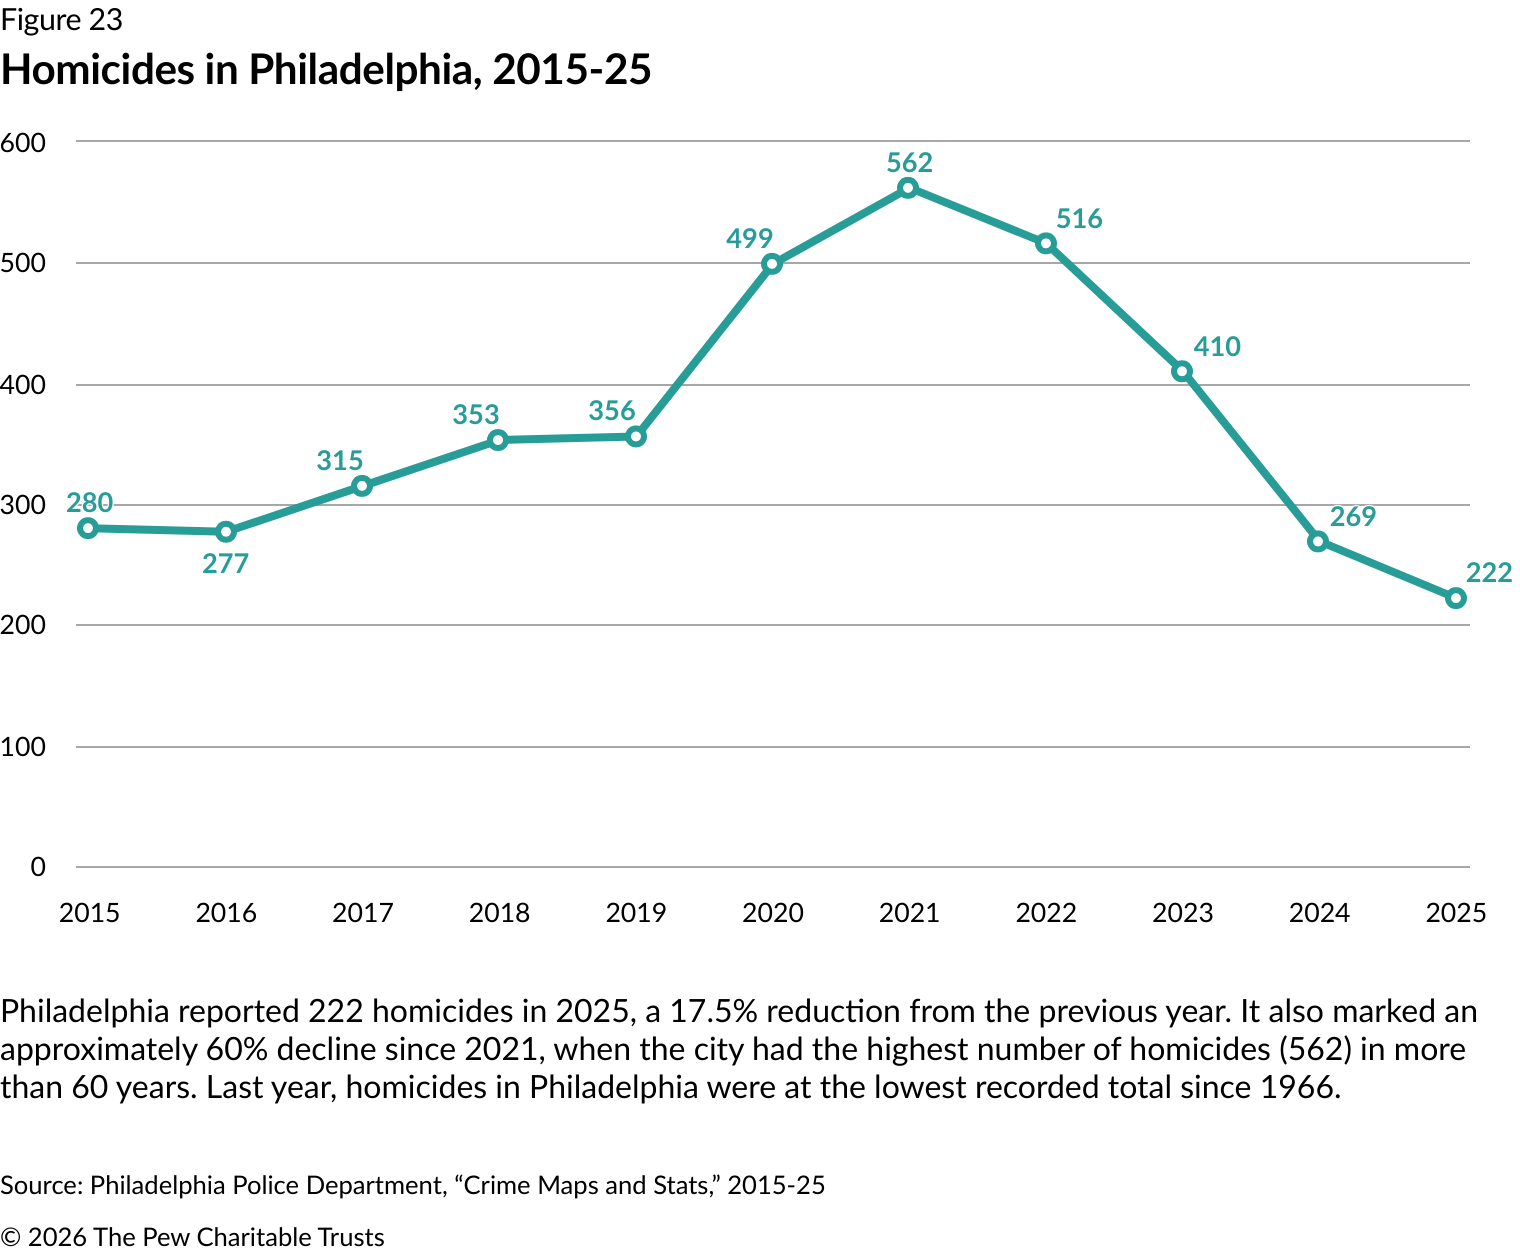
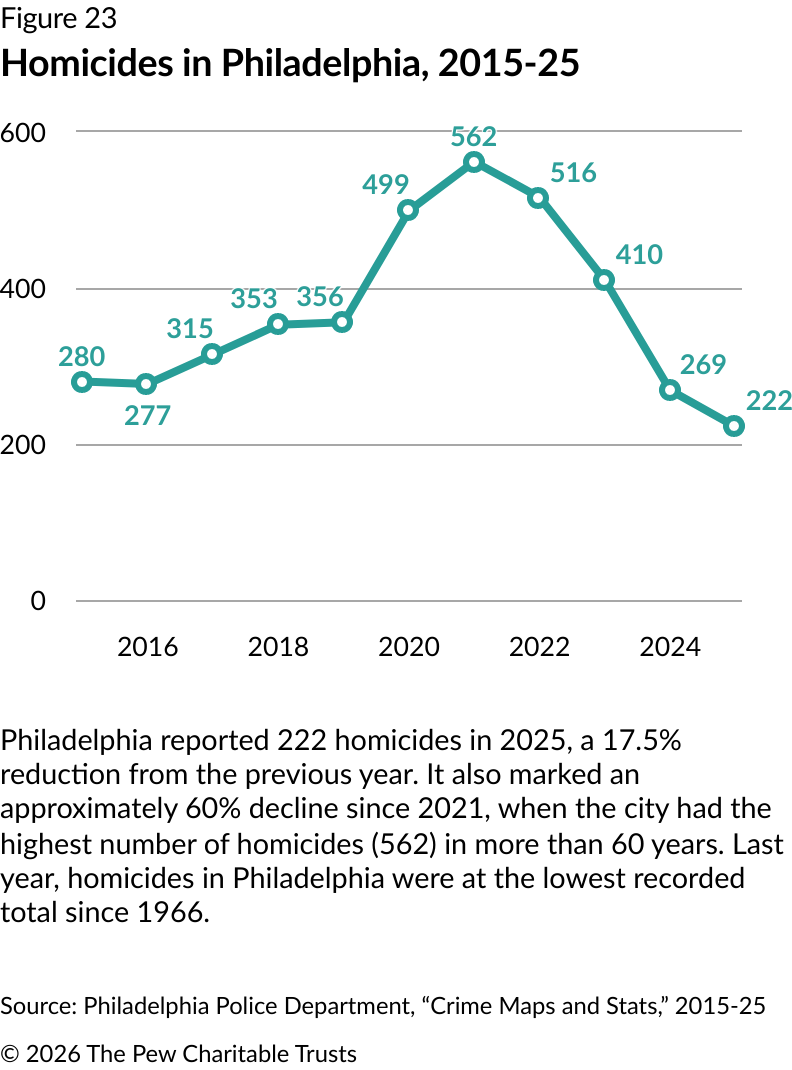
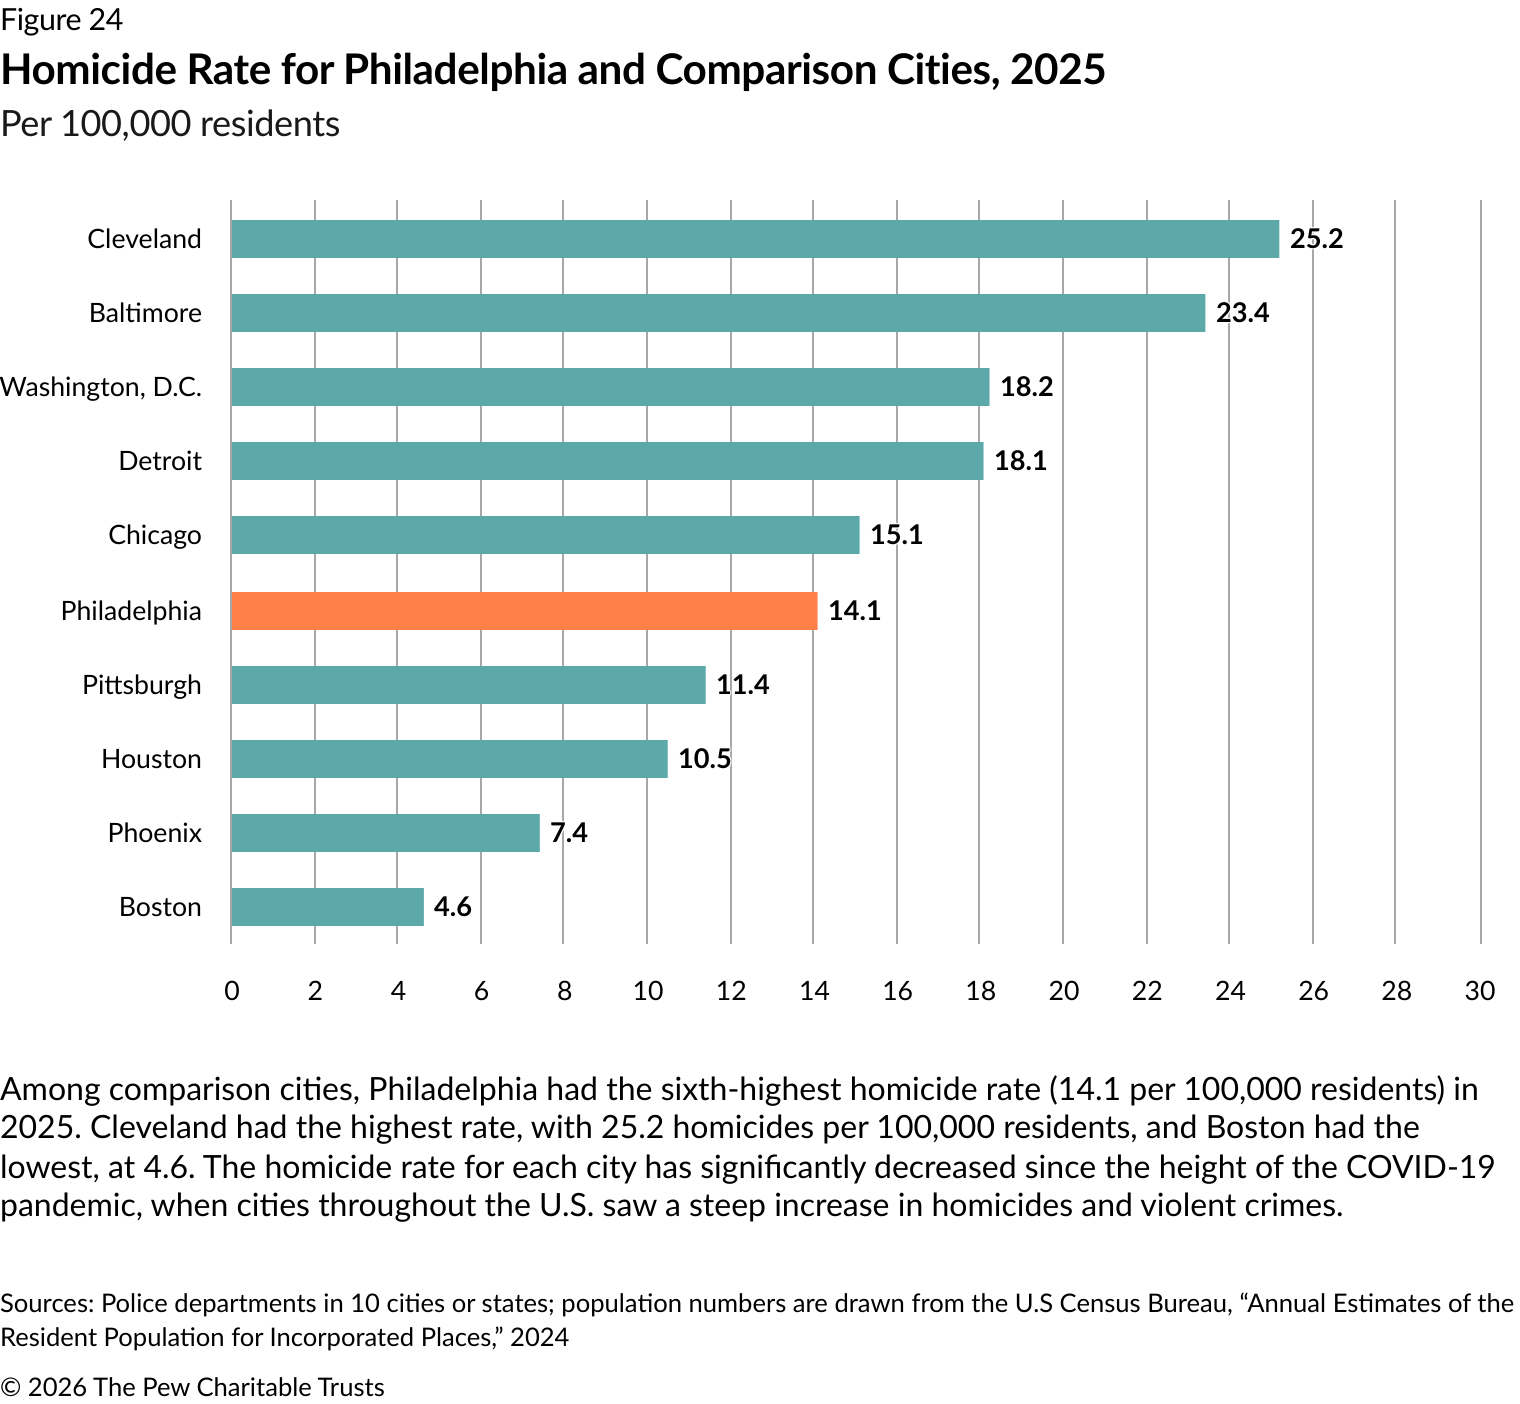
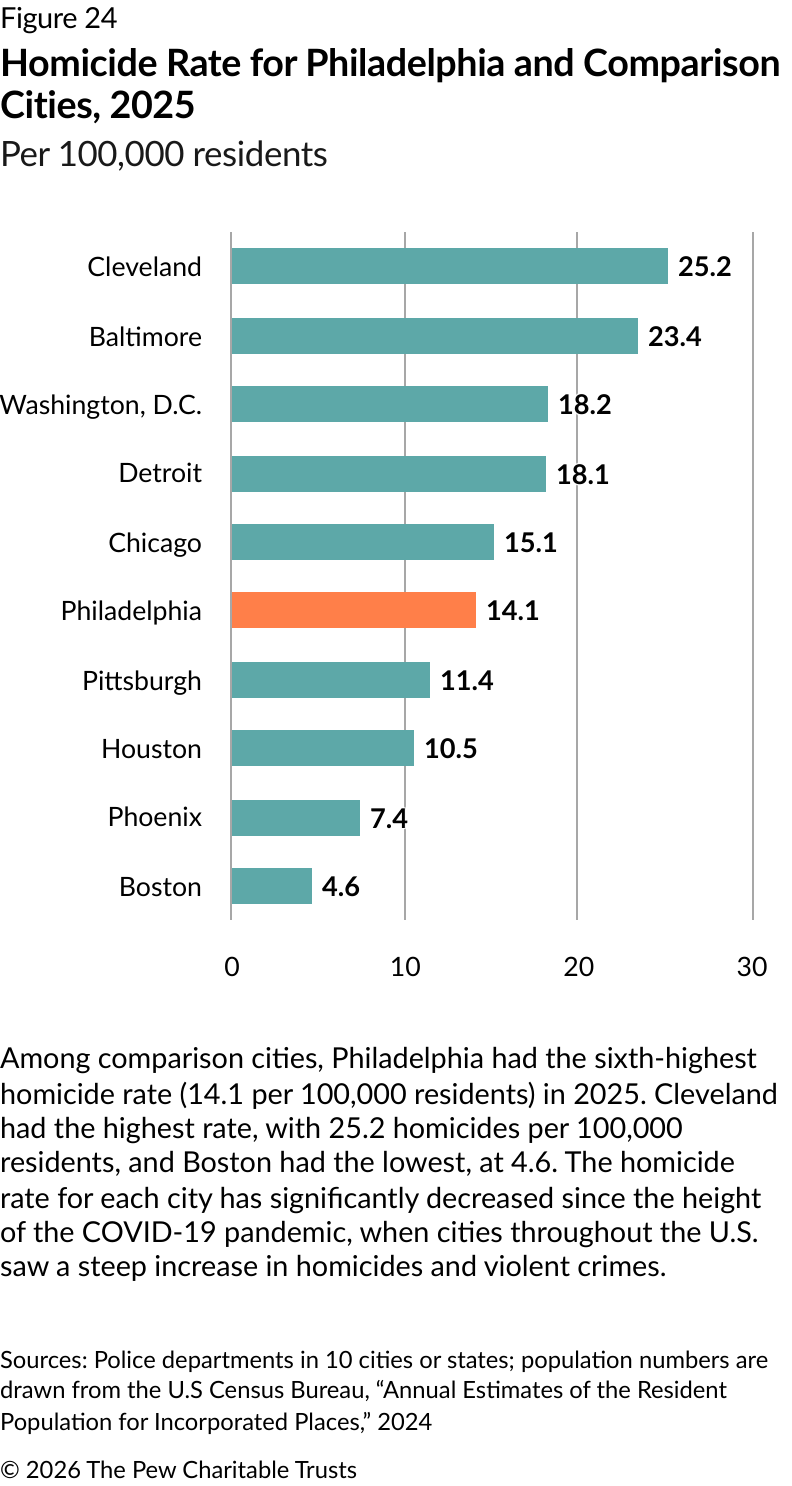
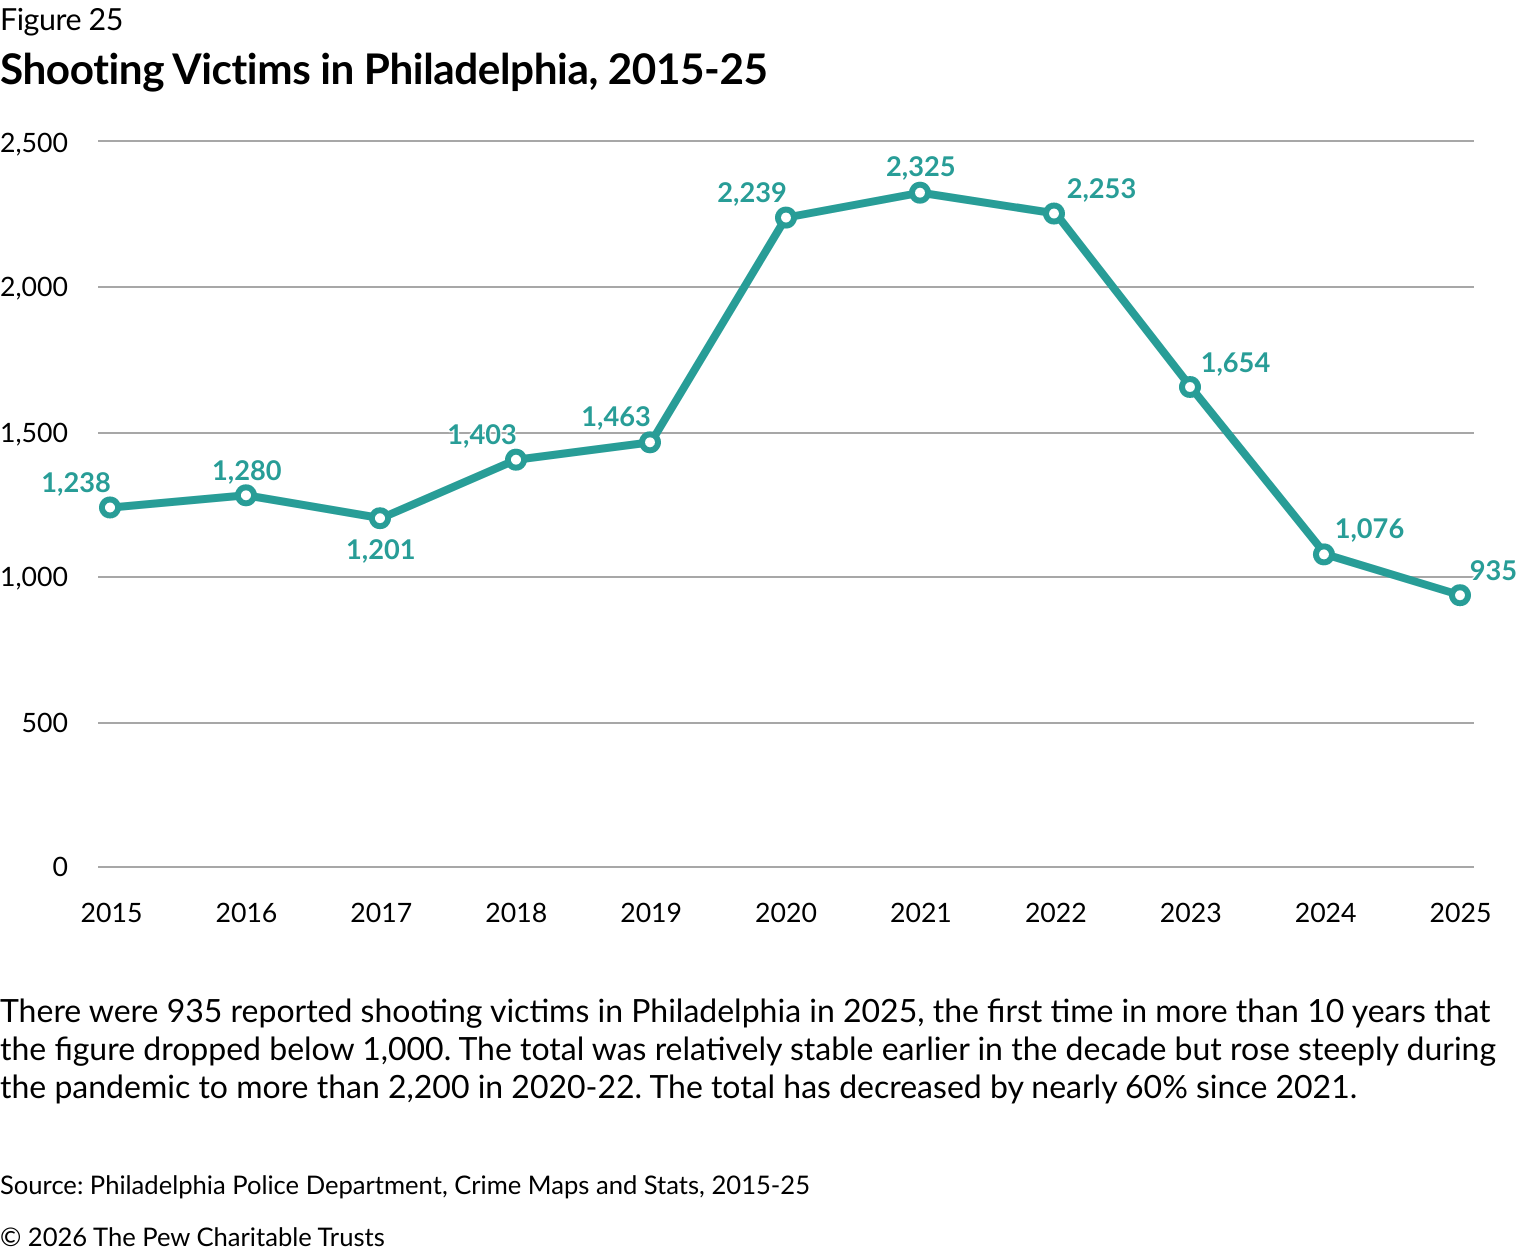
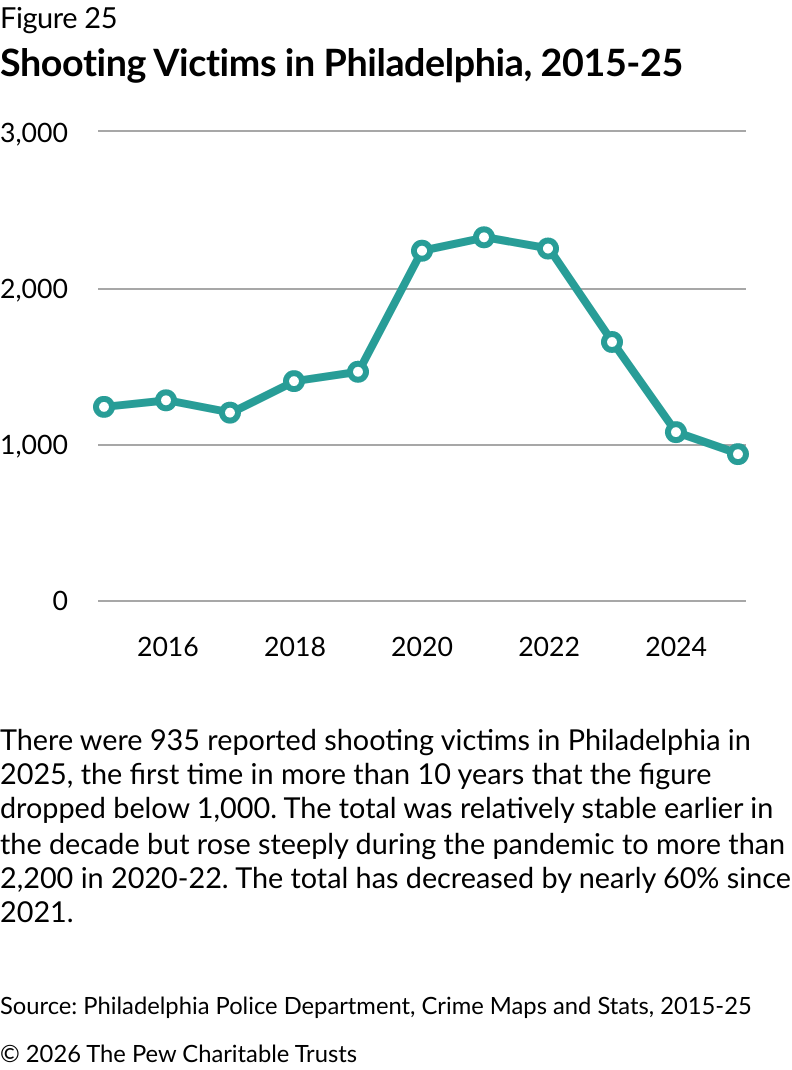
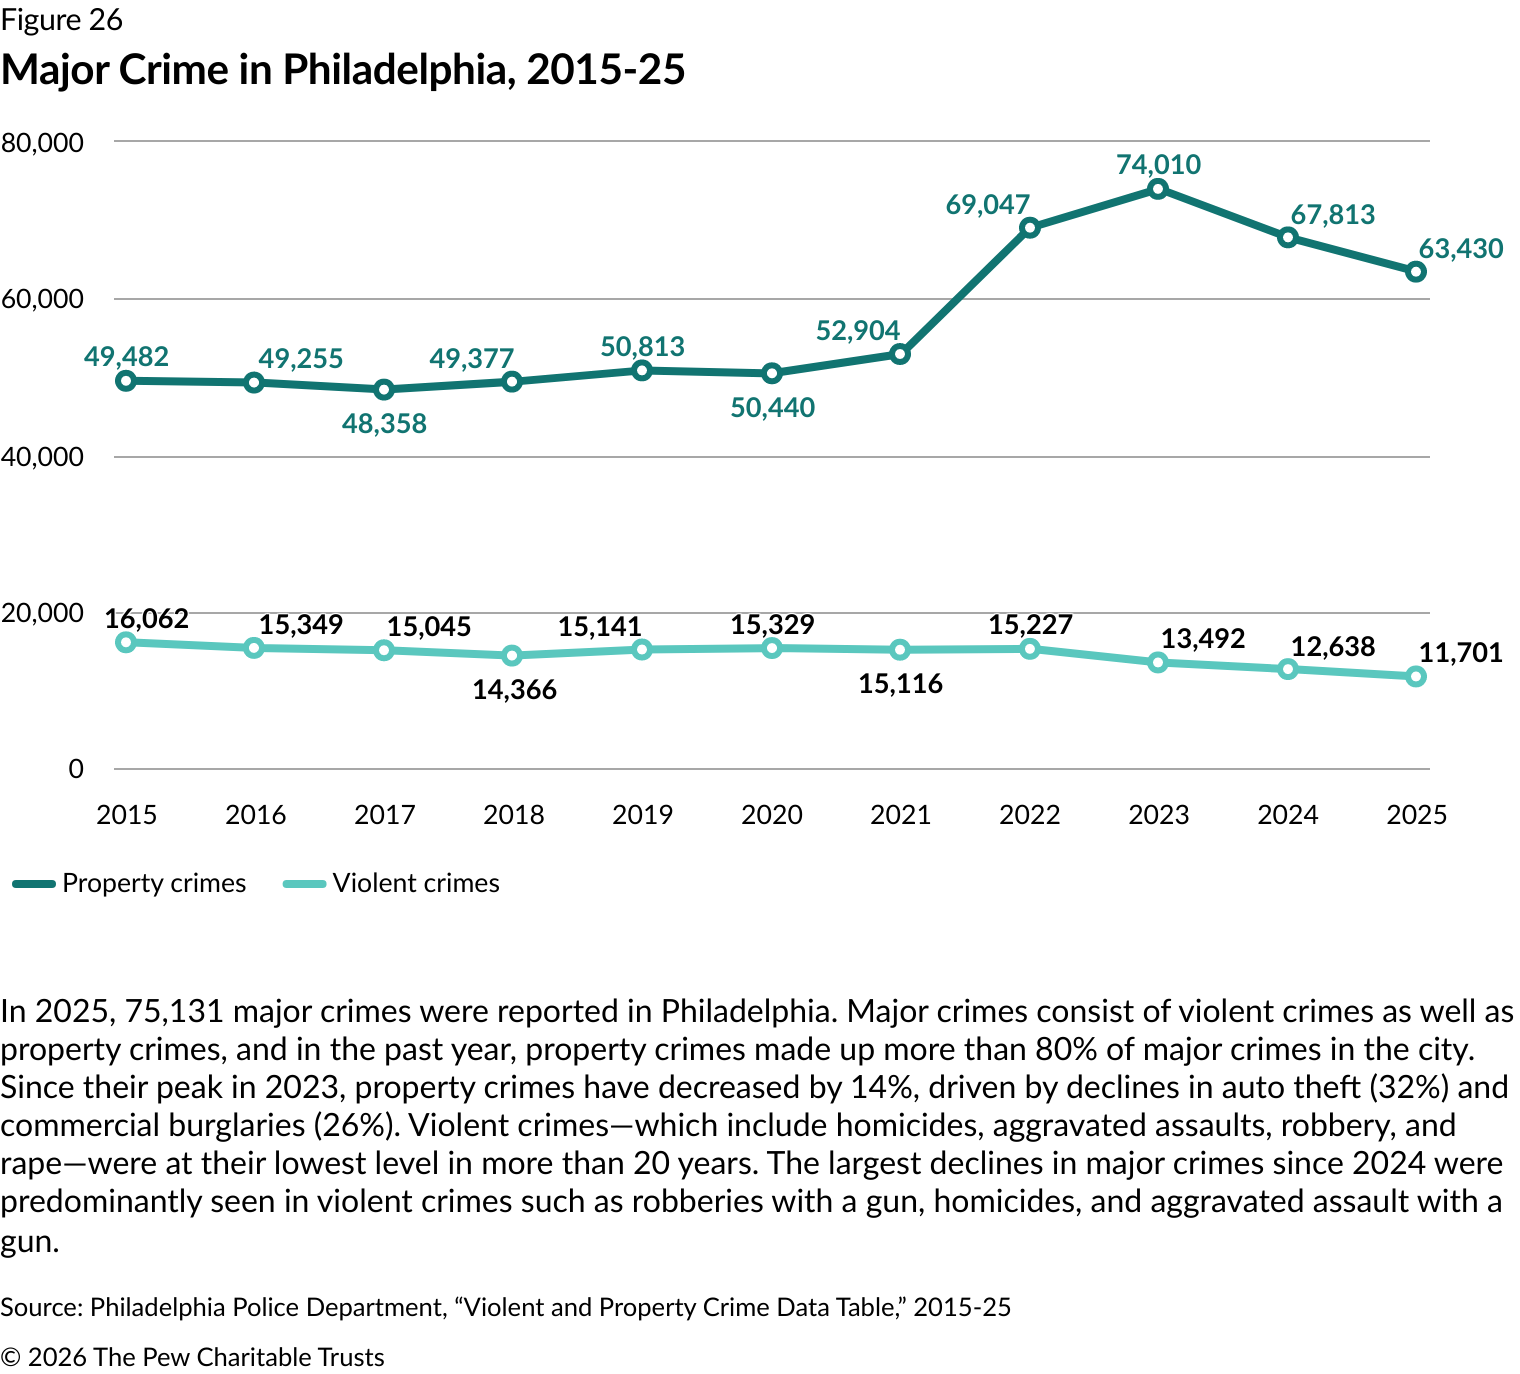
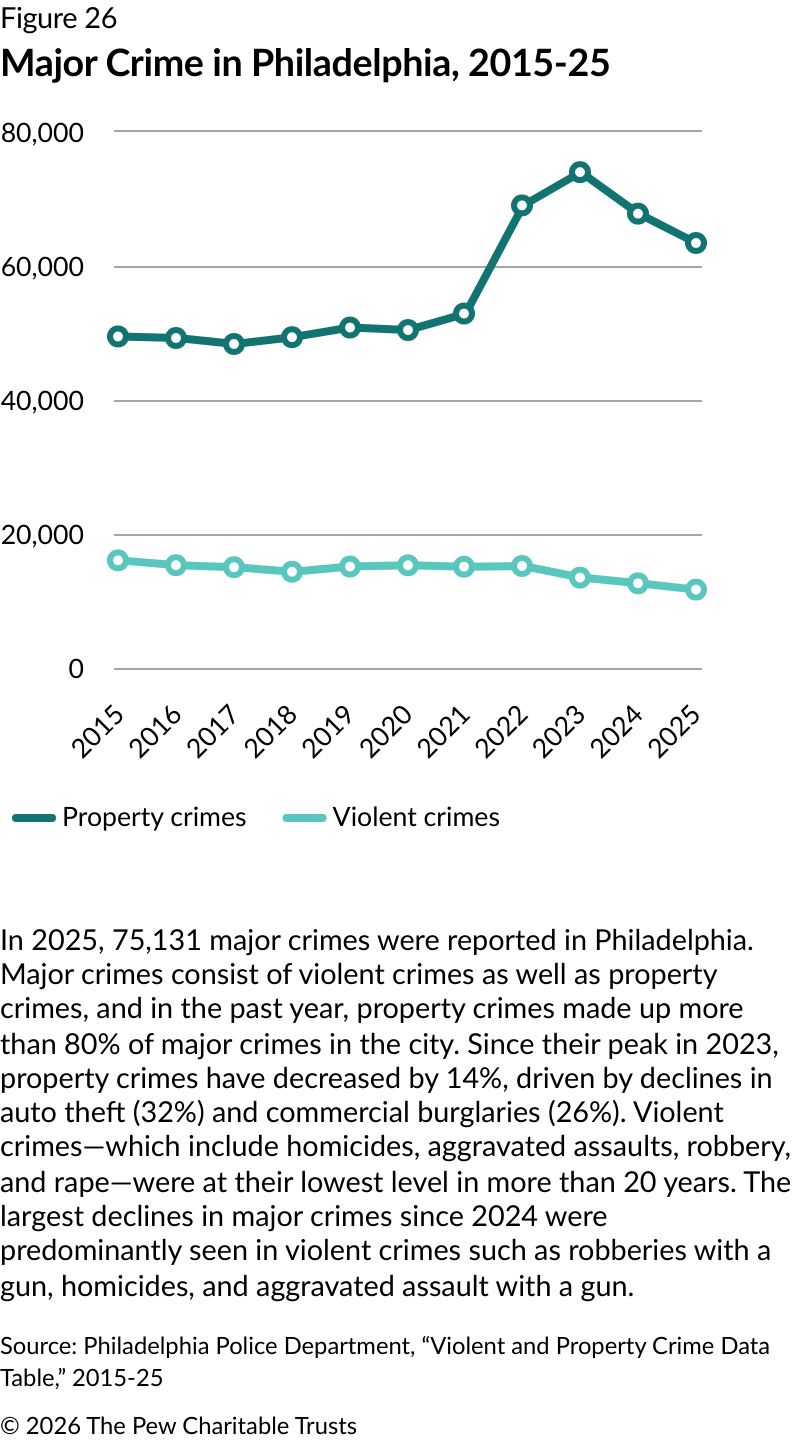
Public safety concerns—such as those relating to increased gun violence during the pandemic—have stabilized, and the 2020 through 2023 surge is looking more like an exception rather than the new normal. In 2025, Philadelphia recorded 222 homicides—the lowest total since 1966 and a 17.5% decline from the previous year— and total shootings dropped below 1,000 for the first time in more than 20 years. These decreases were part of a national trend, with most large U.S. cities recording meaningful declines in homicides and shootings. But the progress may also reflect the investment in and attention to public safety from Mayor Cherelle Parker and Police Commissioner Kevin Bethel.

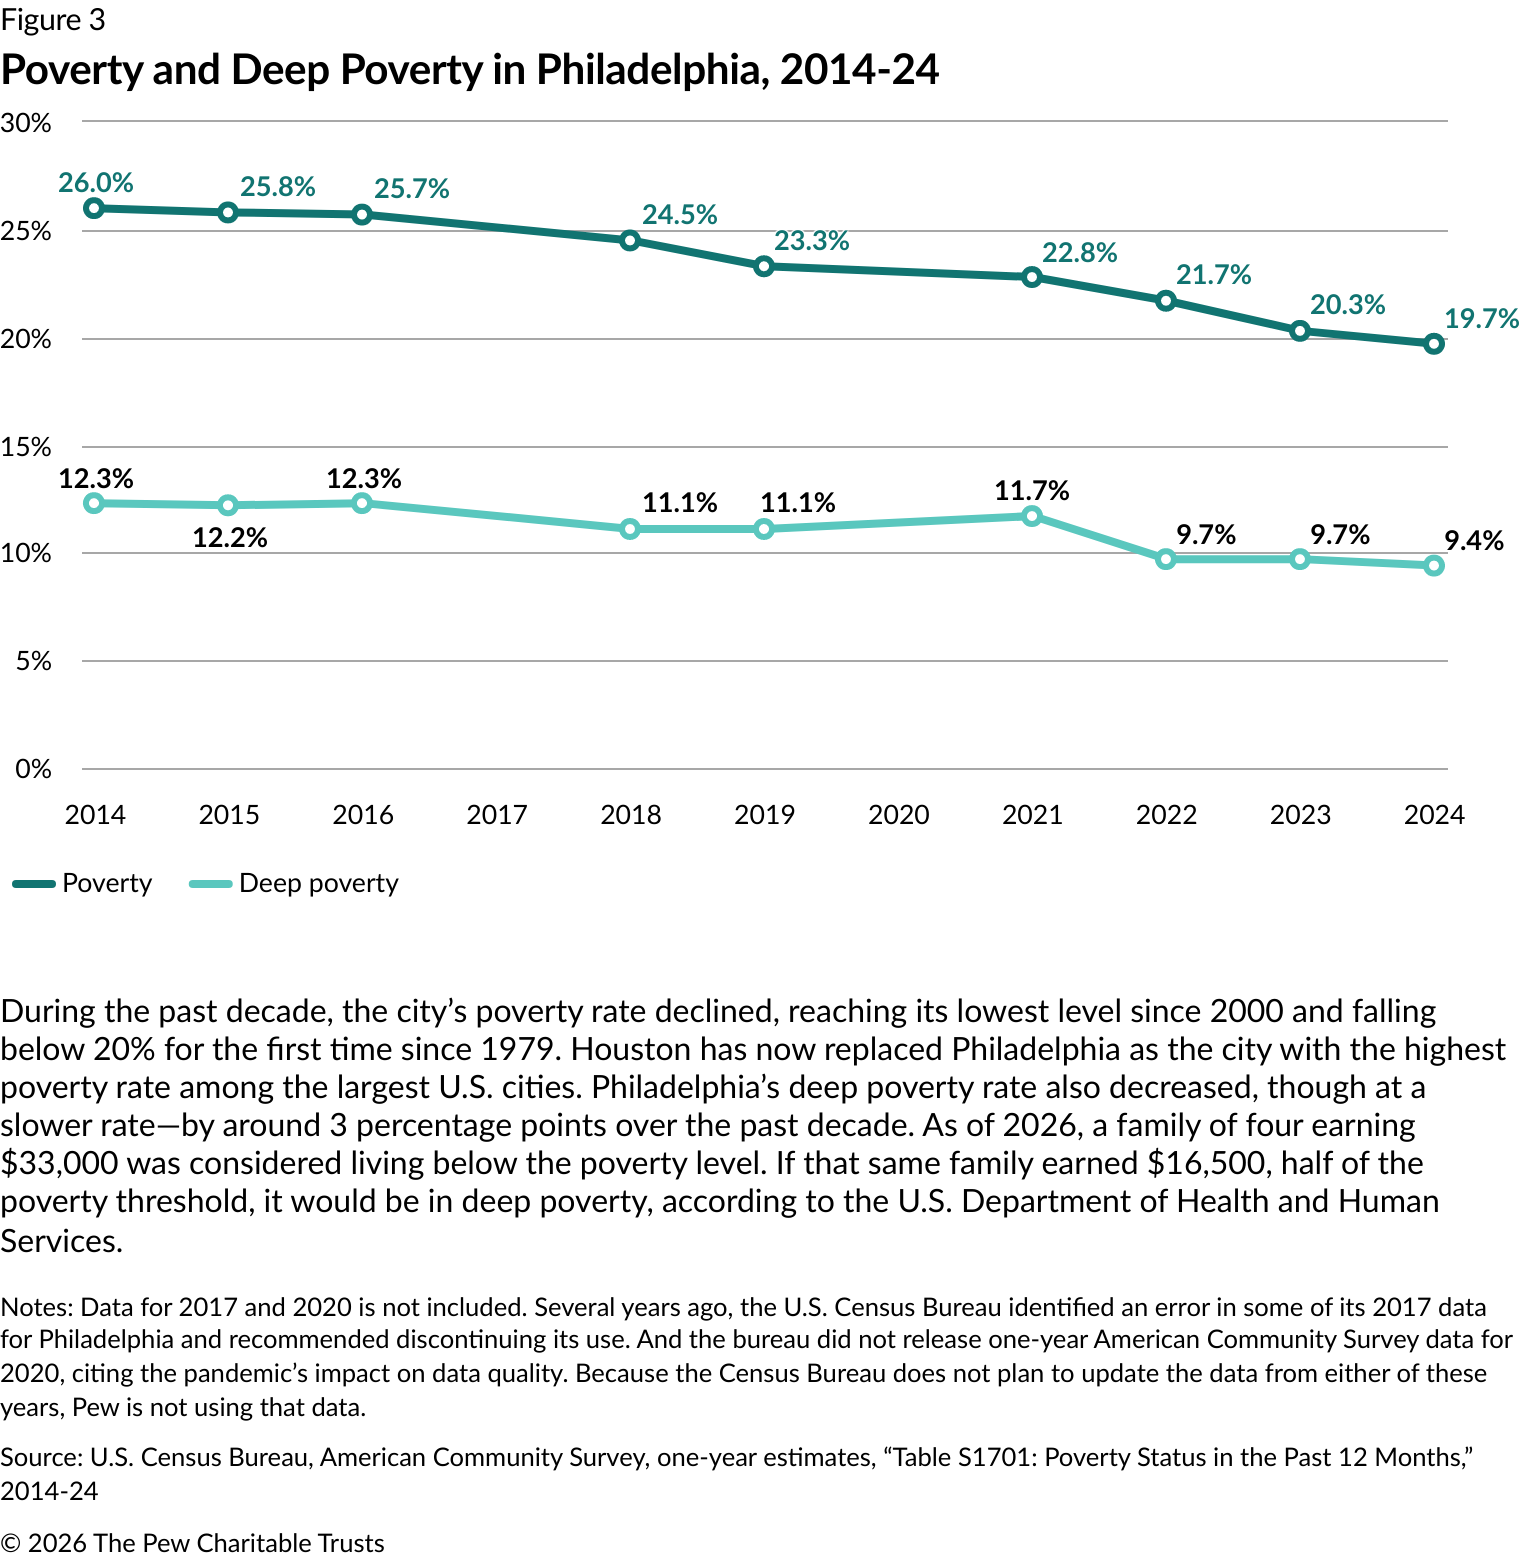
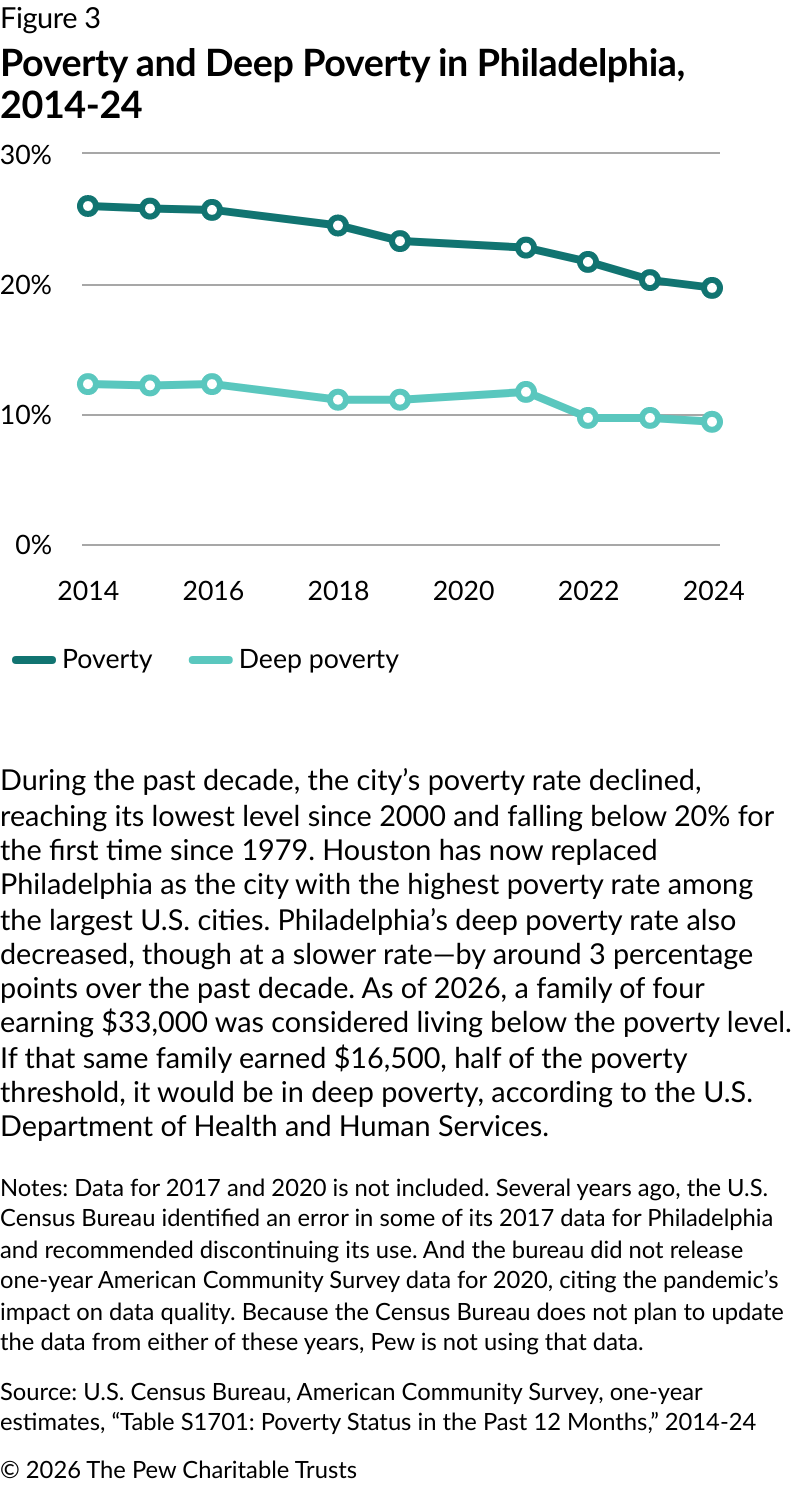
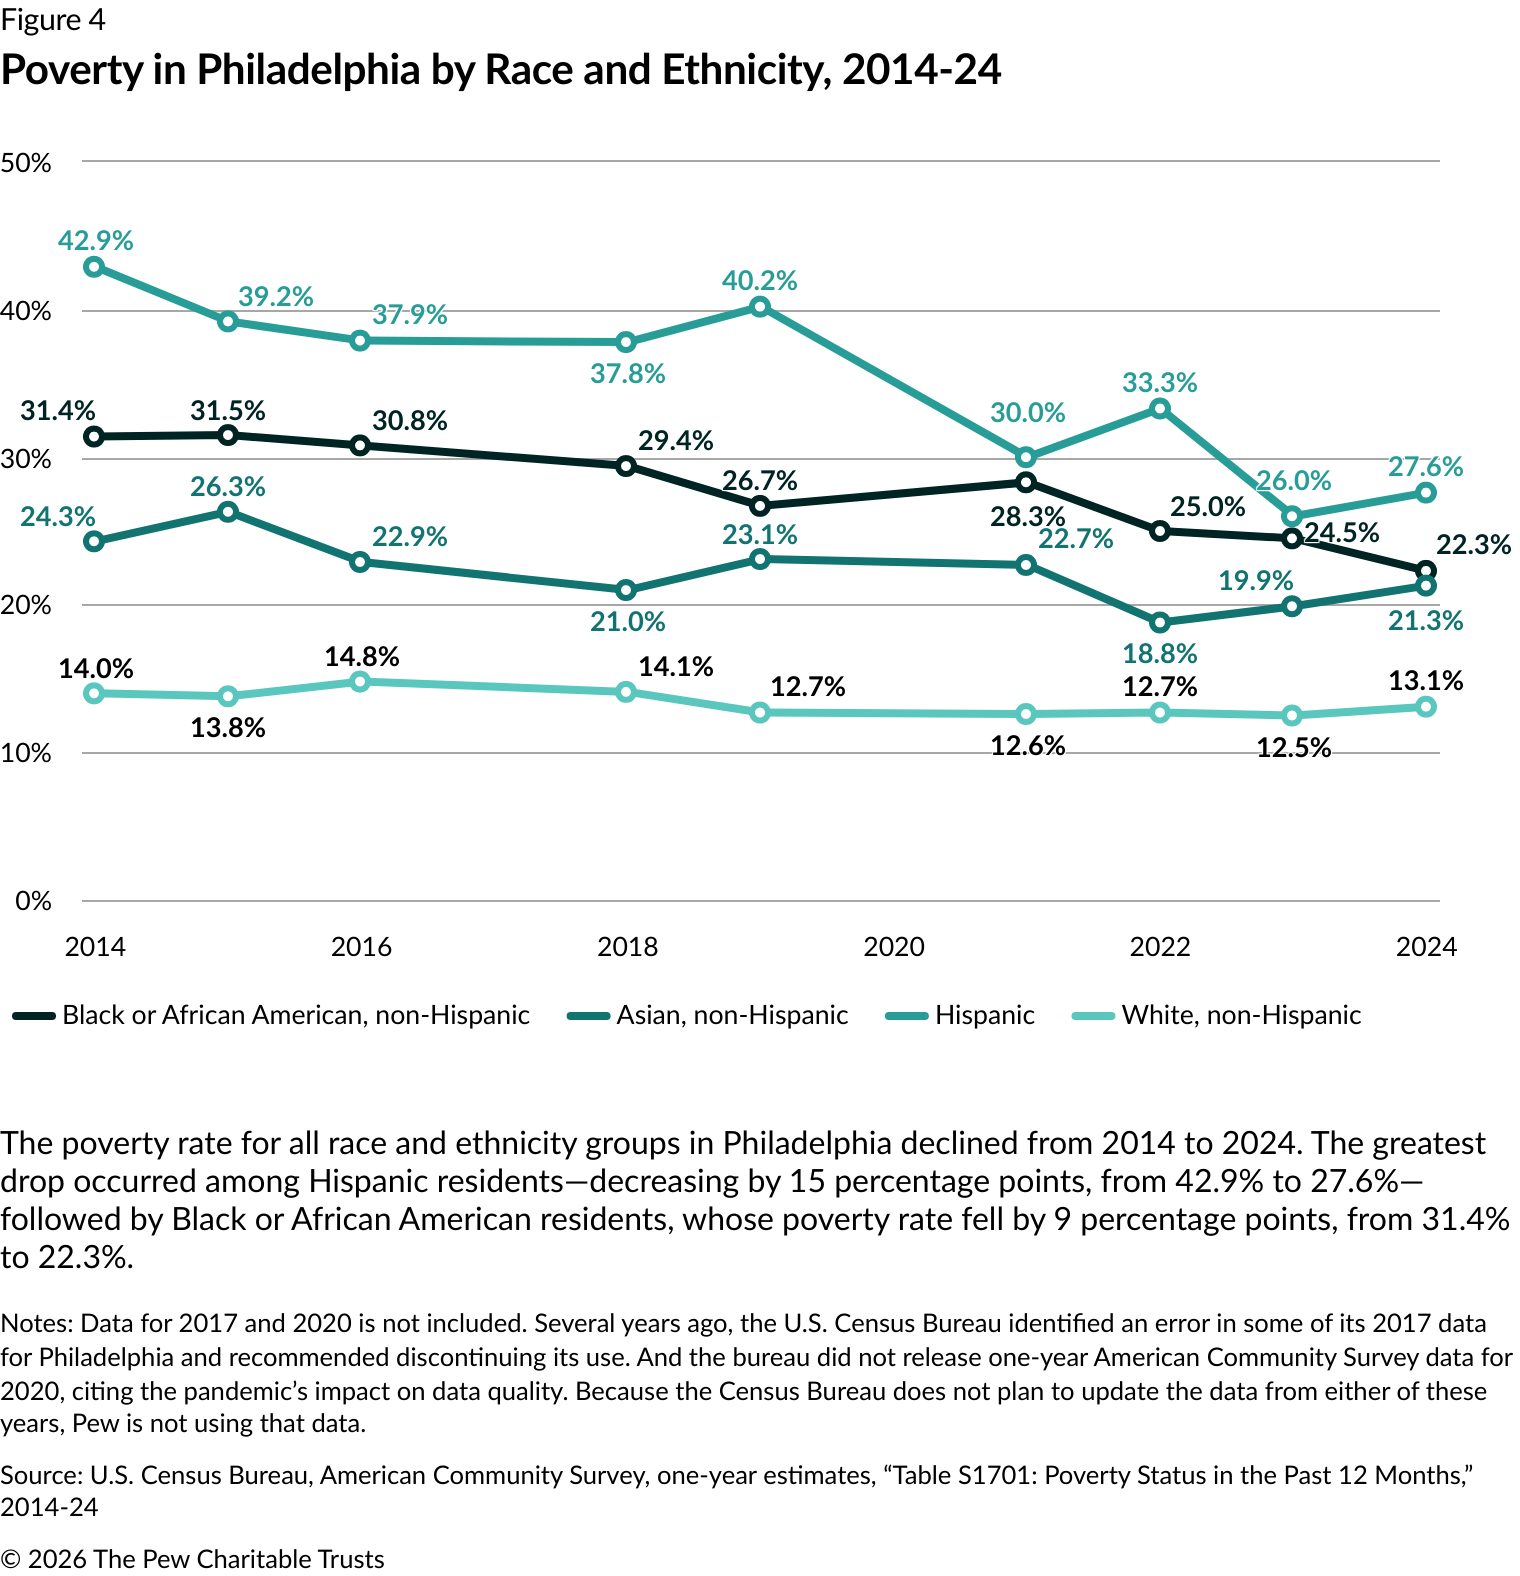
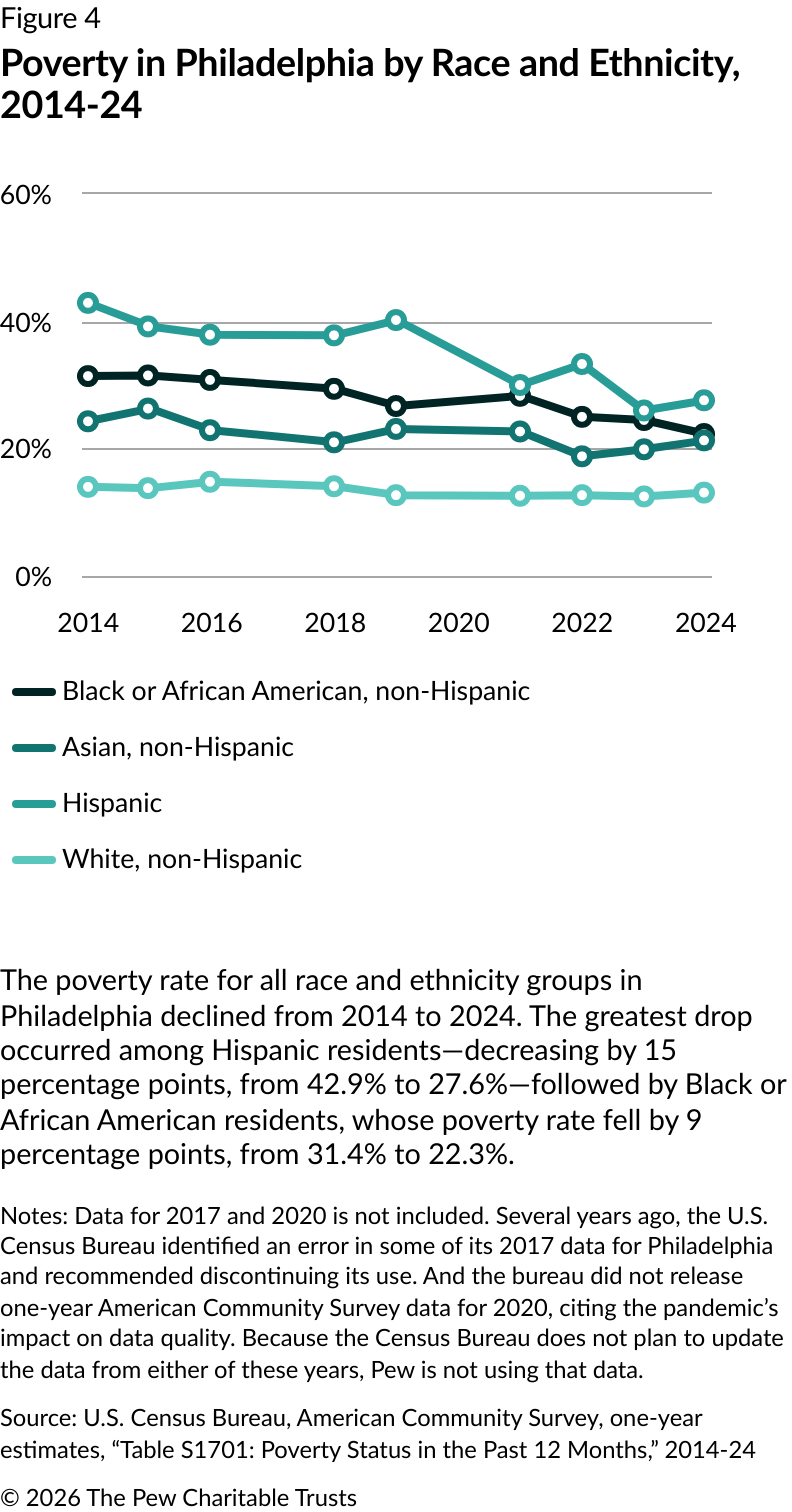
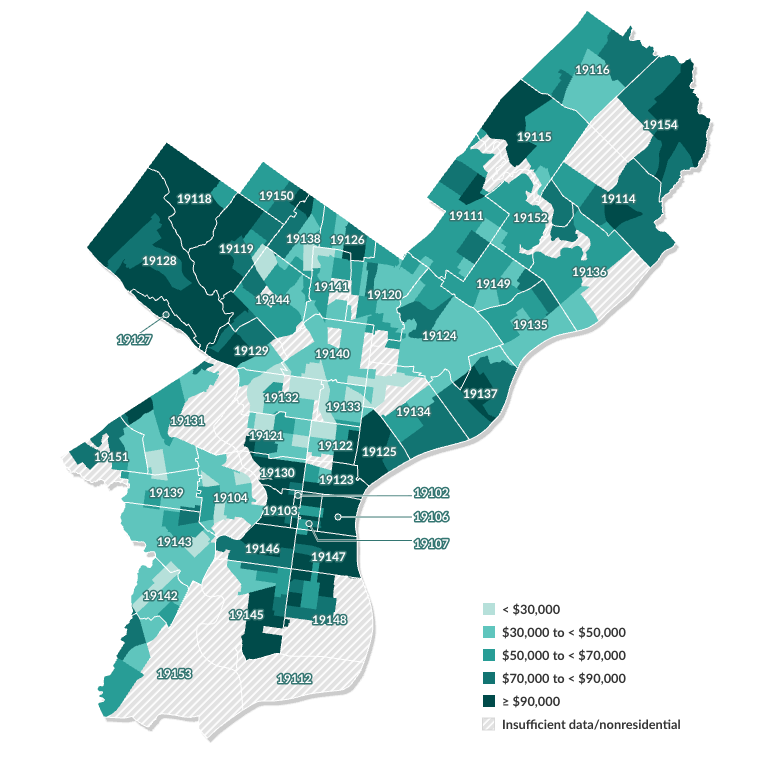
The city’s poverty rate continued its incremental, steady decline, moving below 20% as of 2024. This reduction was marked by Philadelphia no longer having the highest percentage of residents living in poverty among the largest U.S. cities. However, poverty rates remain high for Philadelphia, with more than 300,000 residents who have incomes of $33,000 or less for a family of four.

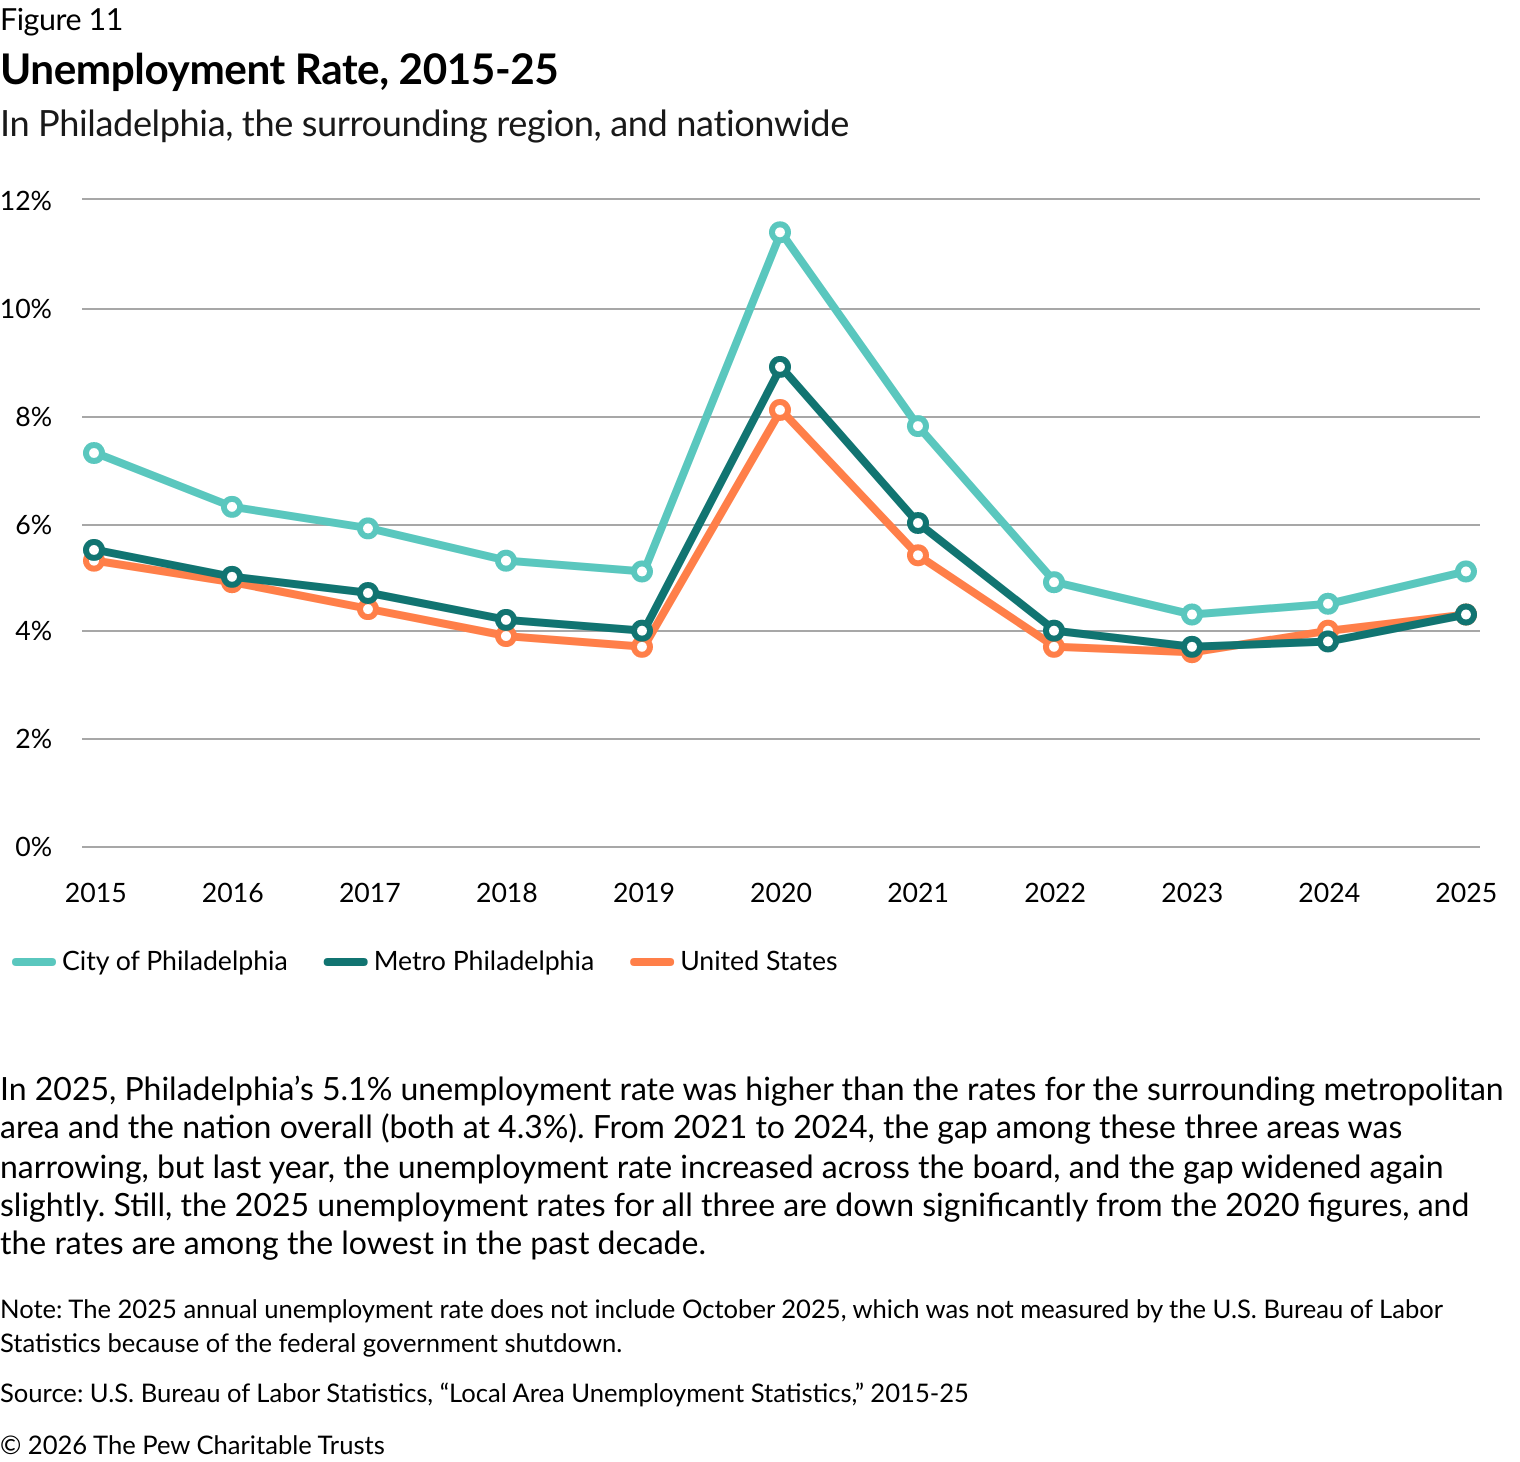
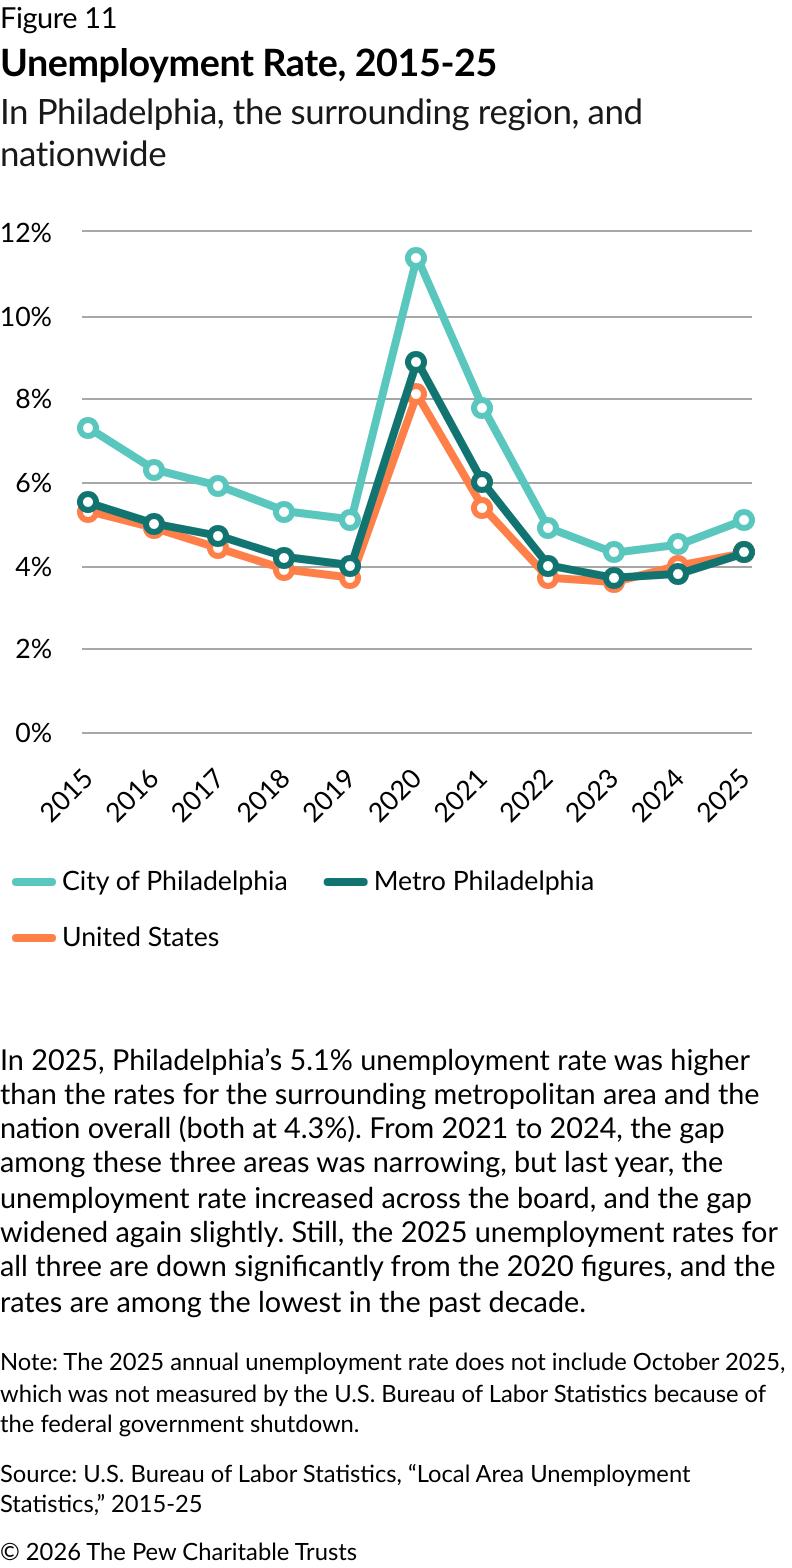
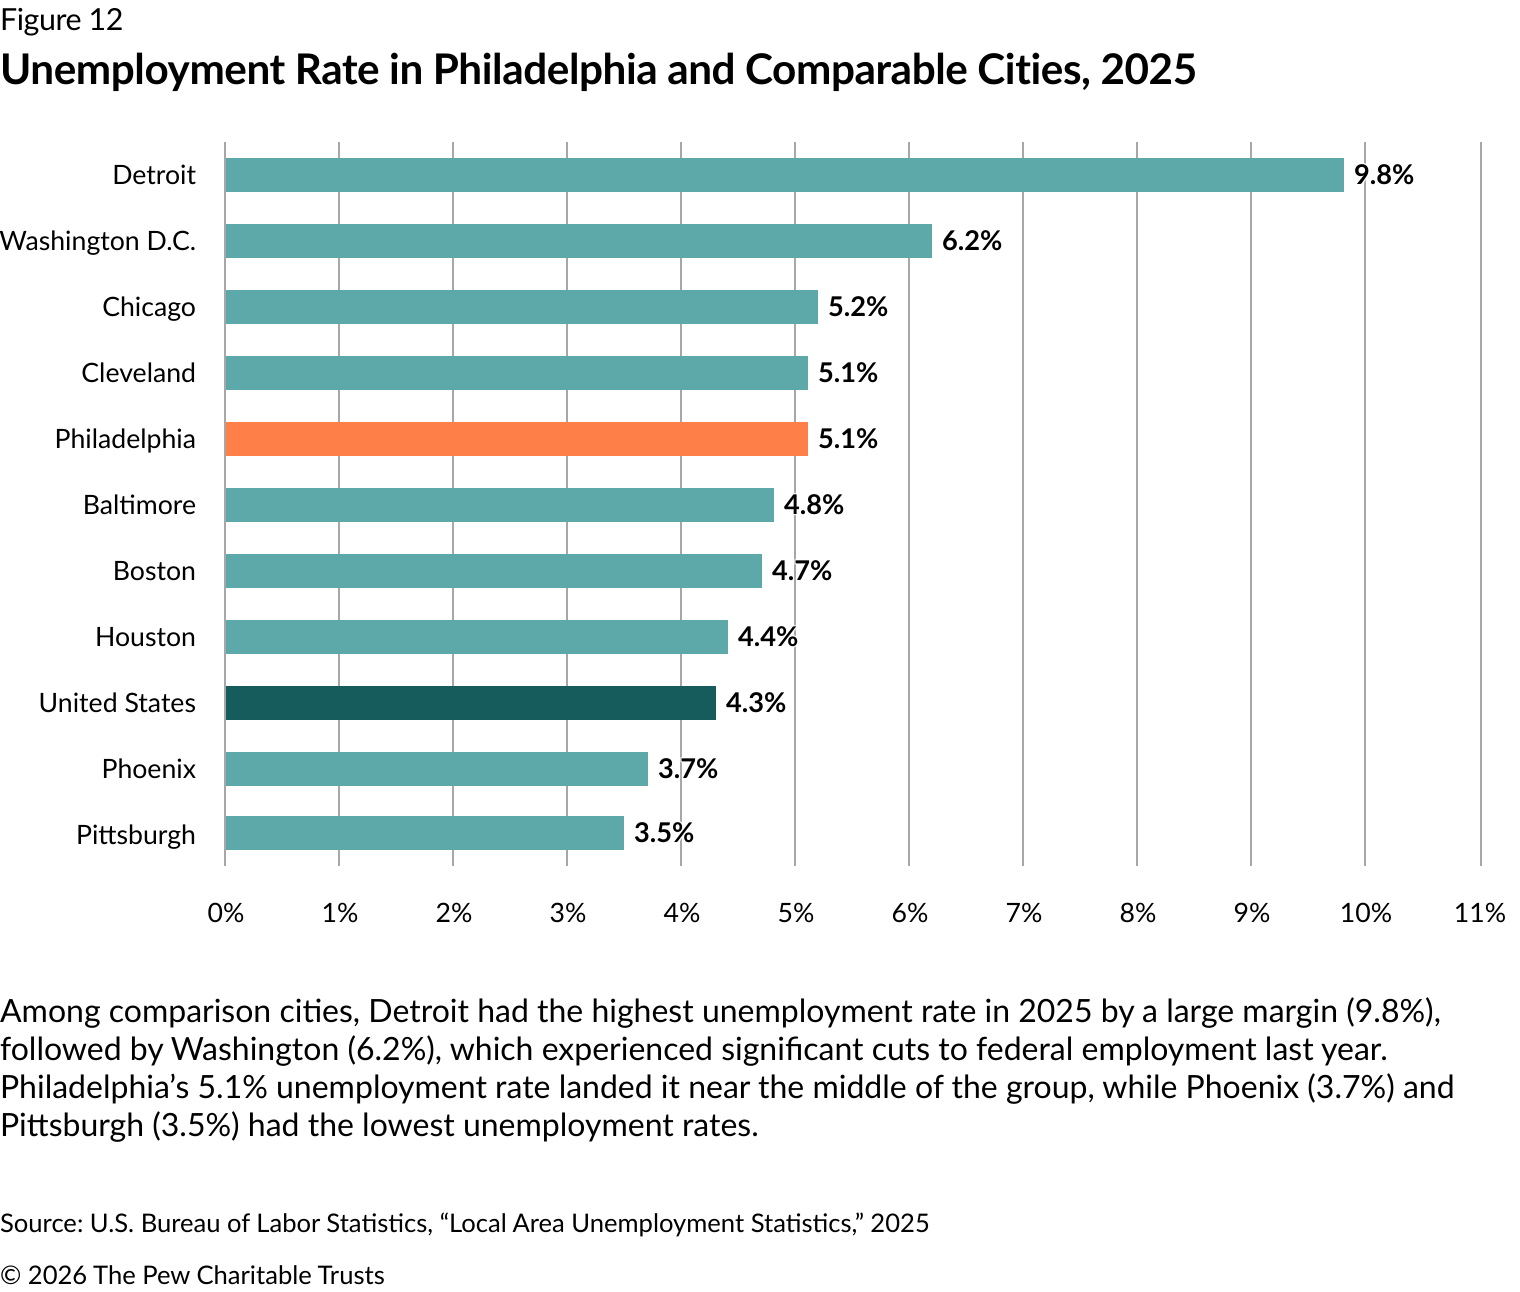
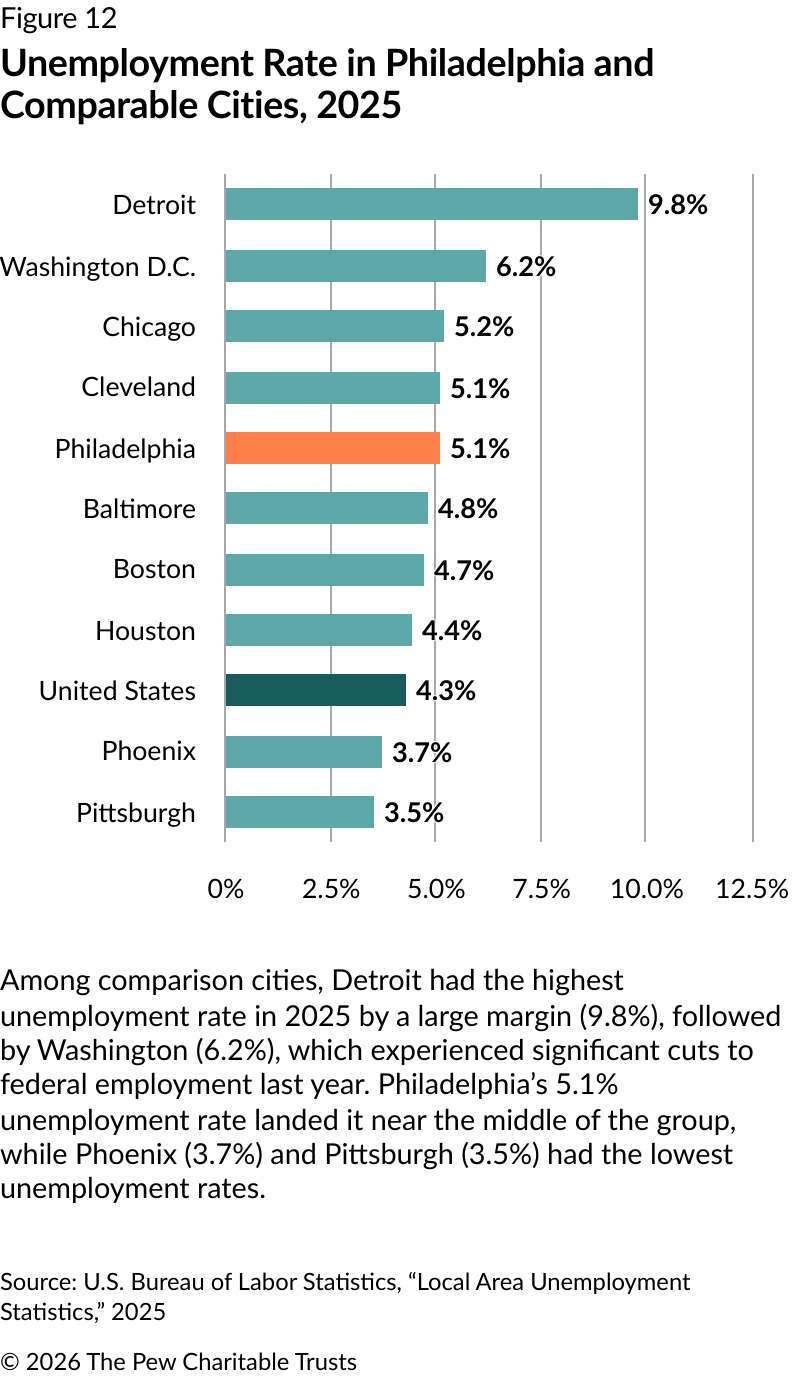
Meanwhile, the unemployment rate rose to 5.1% in 2025—the city’s highest since 2021. Still, that percentage is lower than those in the years following the Great Recession of 2007-09. Last year, the unemployment rate in the metro area and nationwide also rose, to 4.3%.

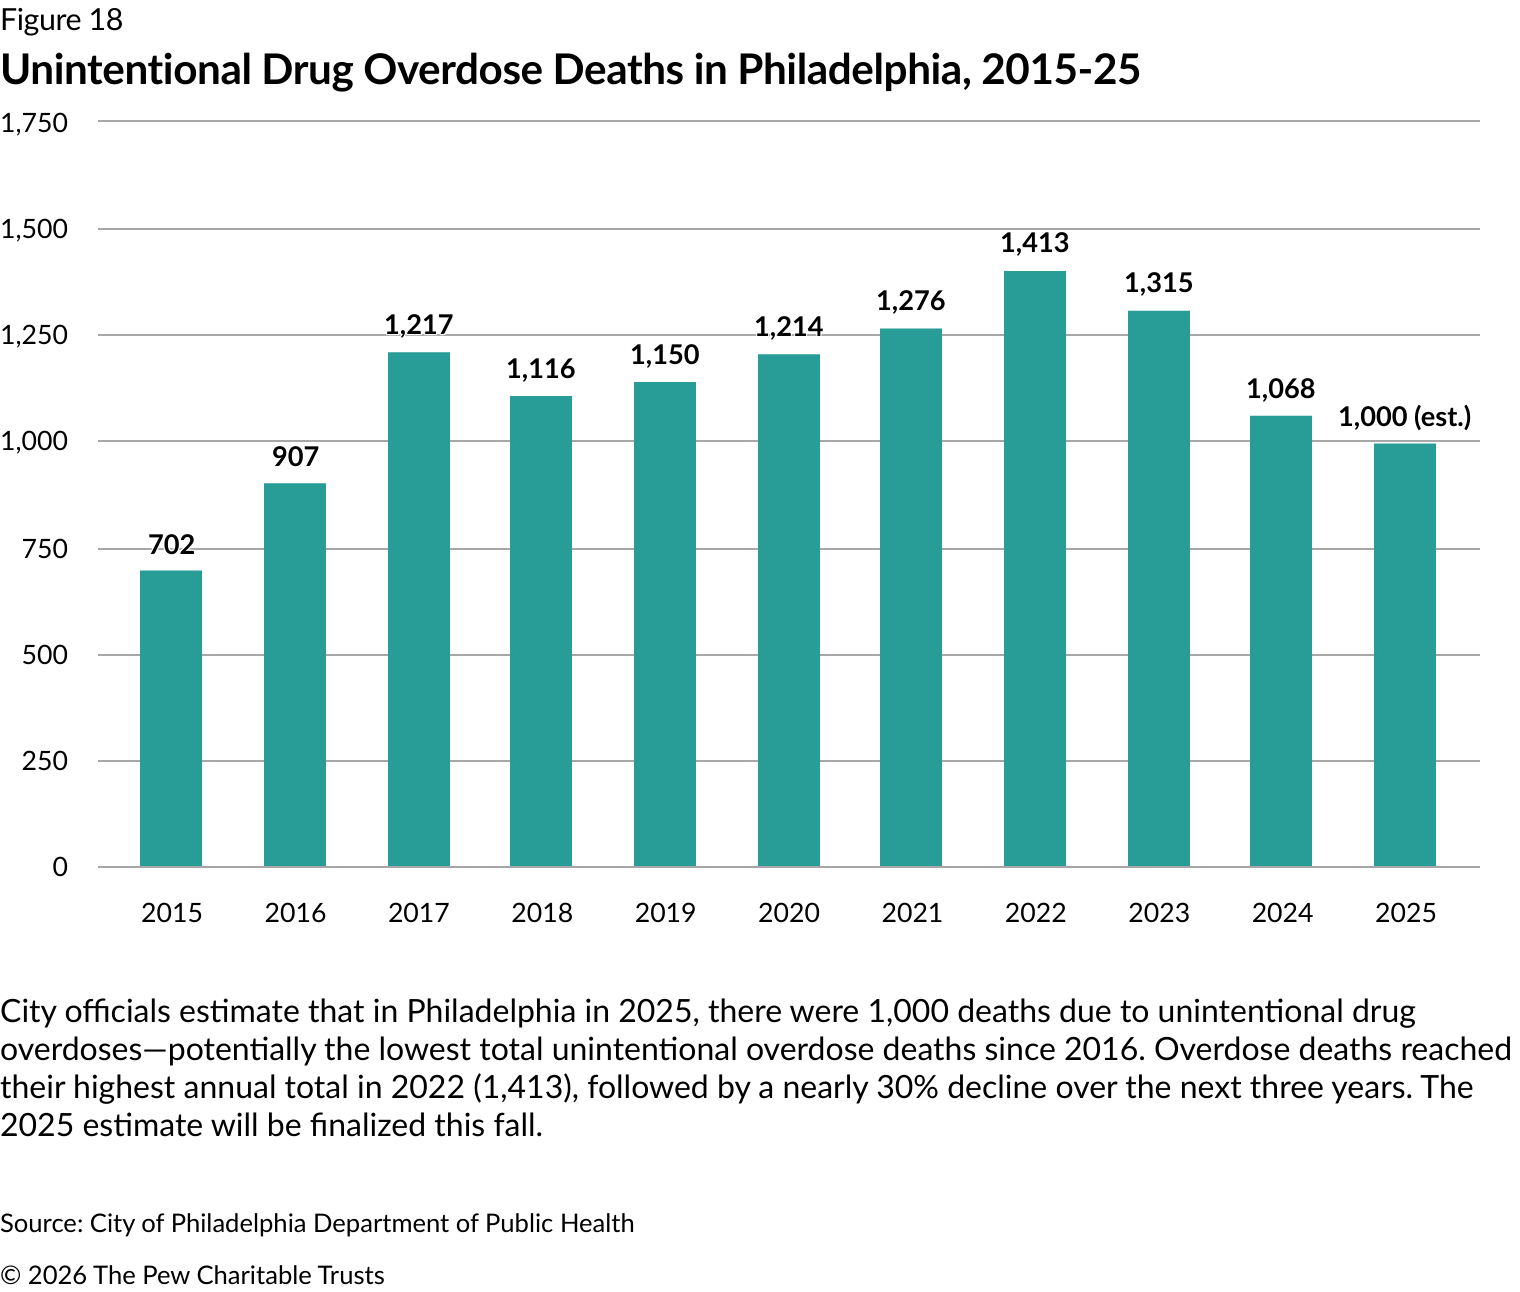
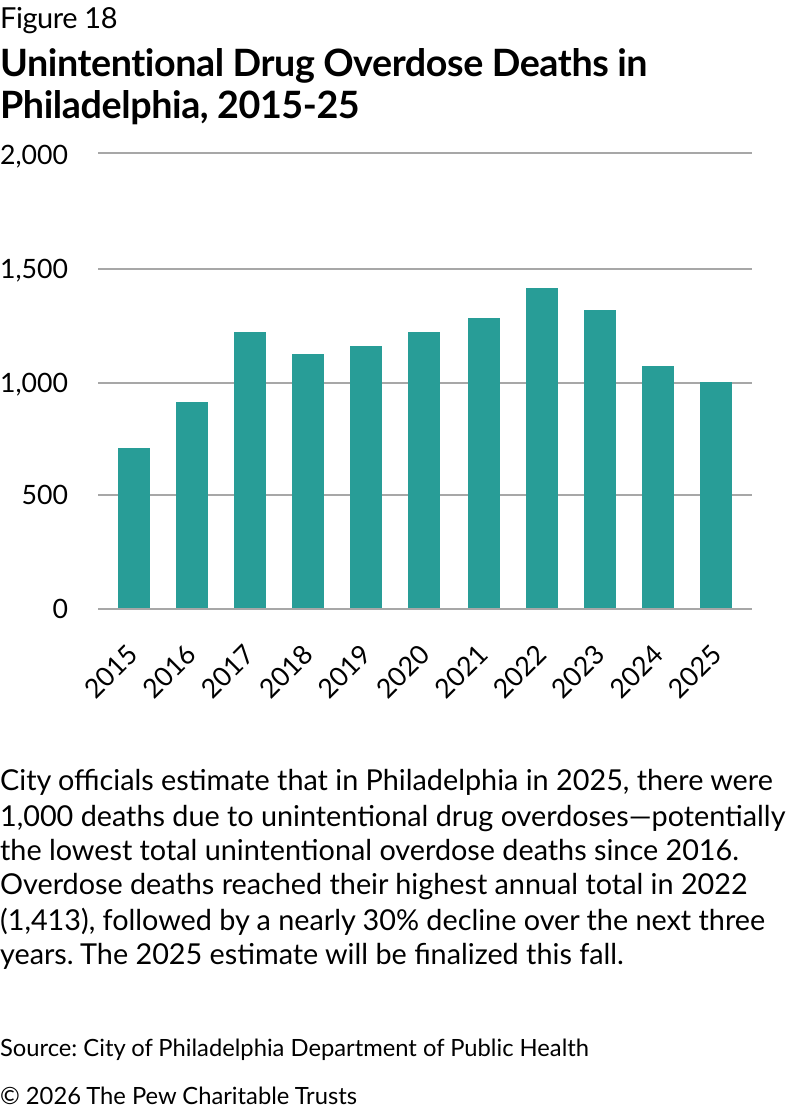
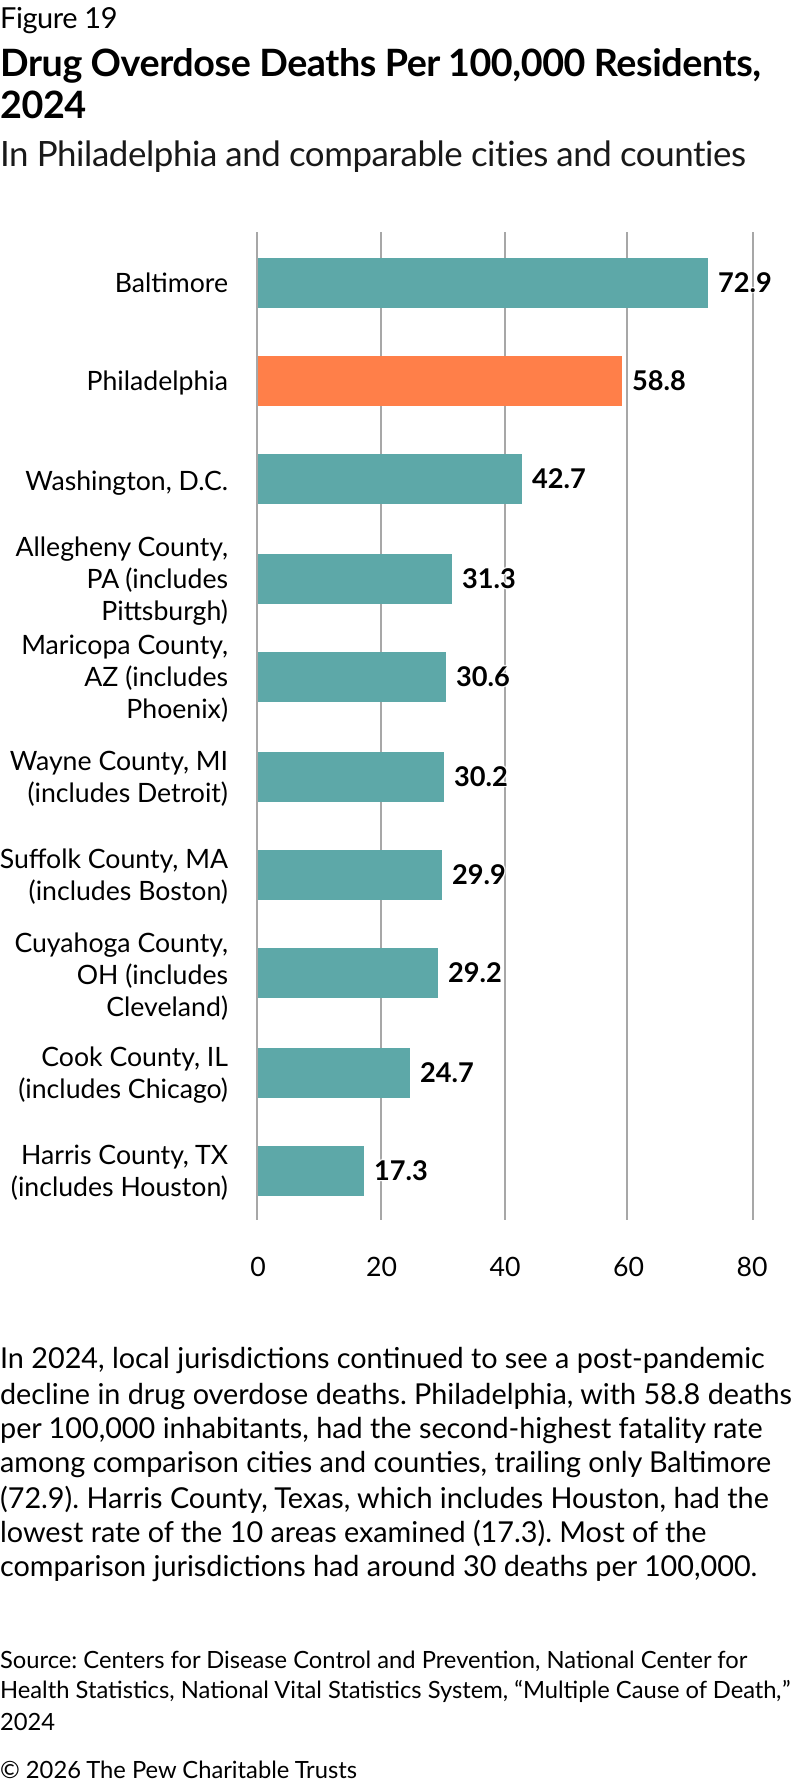
Remarkably, the city’s unintentional overdose deaths continued to decline, falling to an estimated 1,000. The city made multiple investments to reduce overdose deaths, including the January 2025 opening of Riverview Wellness Village, a facility providing housing and treatment for individuals transitioning out of substance use rehabilitation and detox. These efforts were paired with ramped-up drug enforcement patrols and arrests, particularly focused in the Kensington neighborhood, the city’s epicenter of the opioid epidemic. The Pew Charitable Trusts’ 2025 polling found that 1 in 3 Philadelphians personally know someone who has died from an overdose. The epidemic, even as it seems to be exiting its most acute period, continues to devastate Philadelphians and their families.

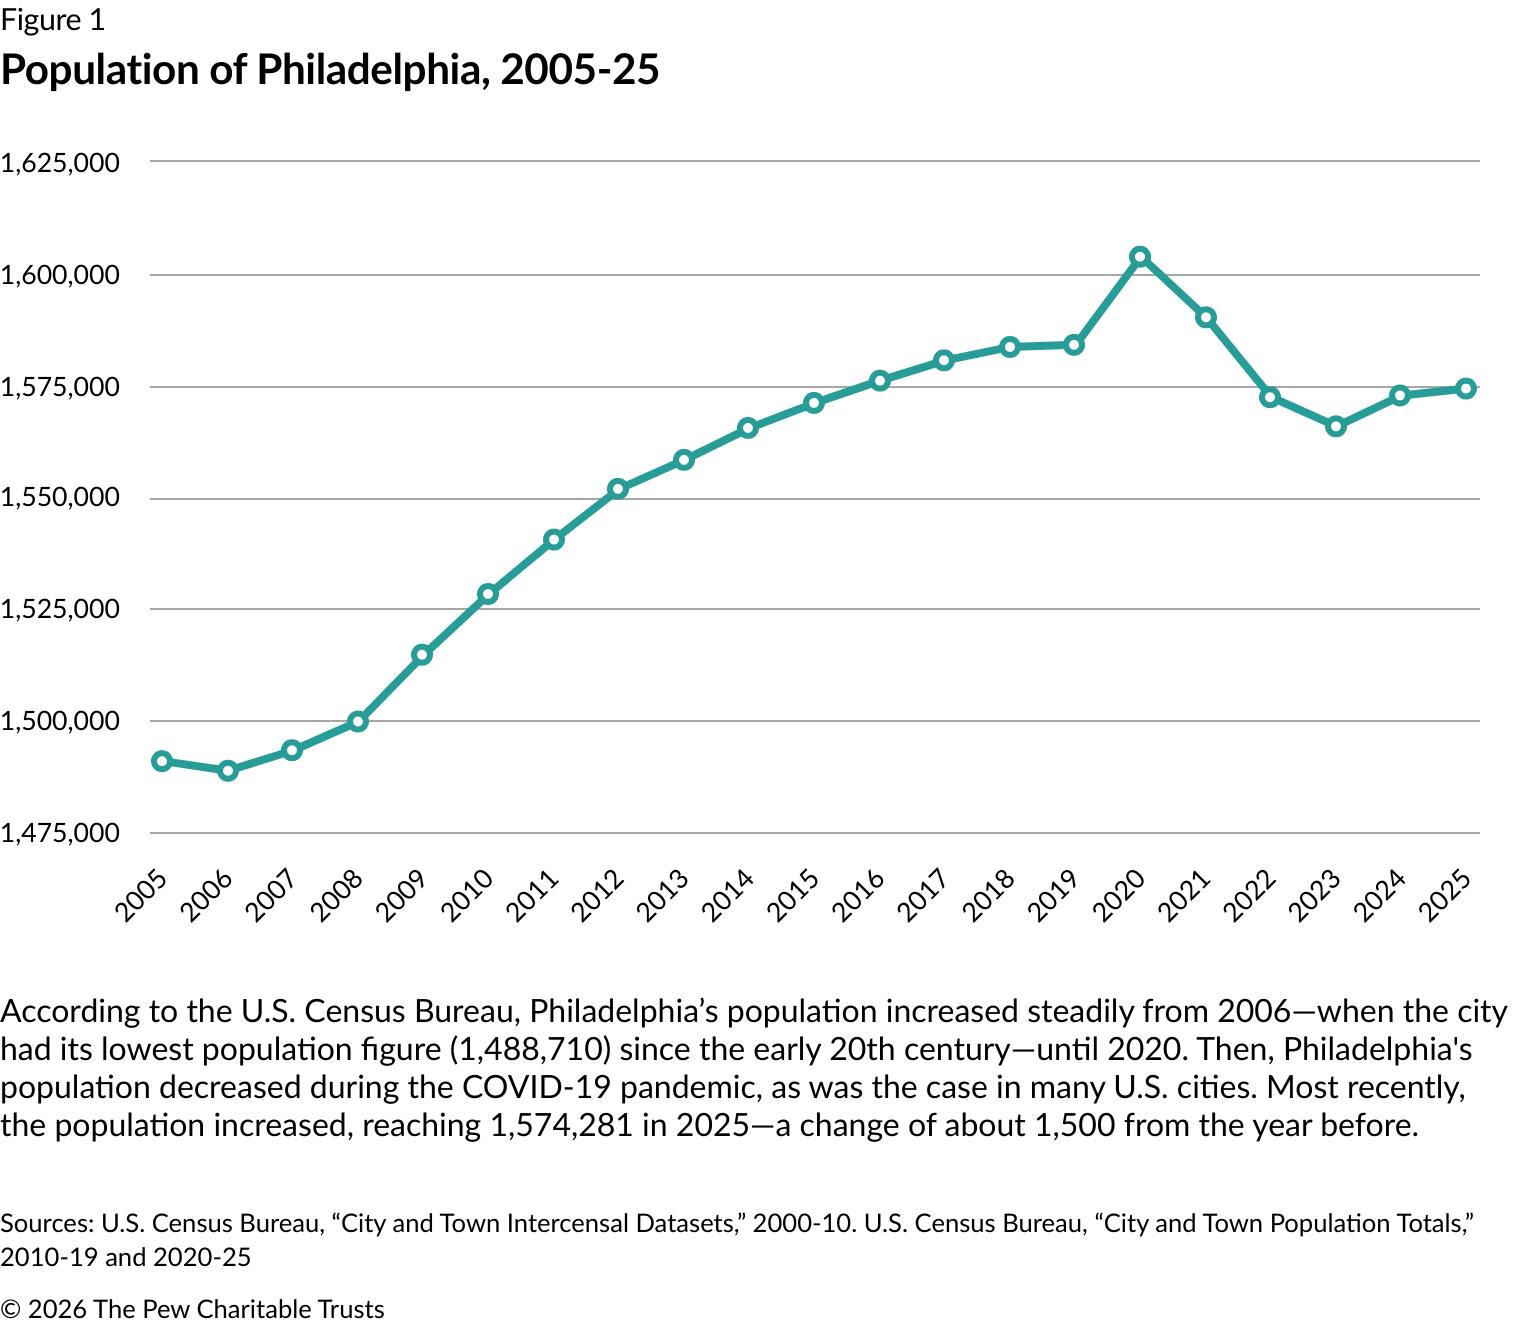
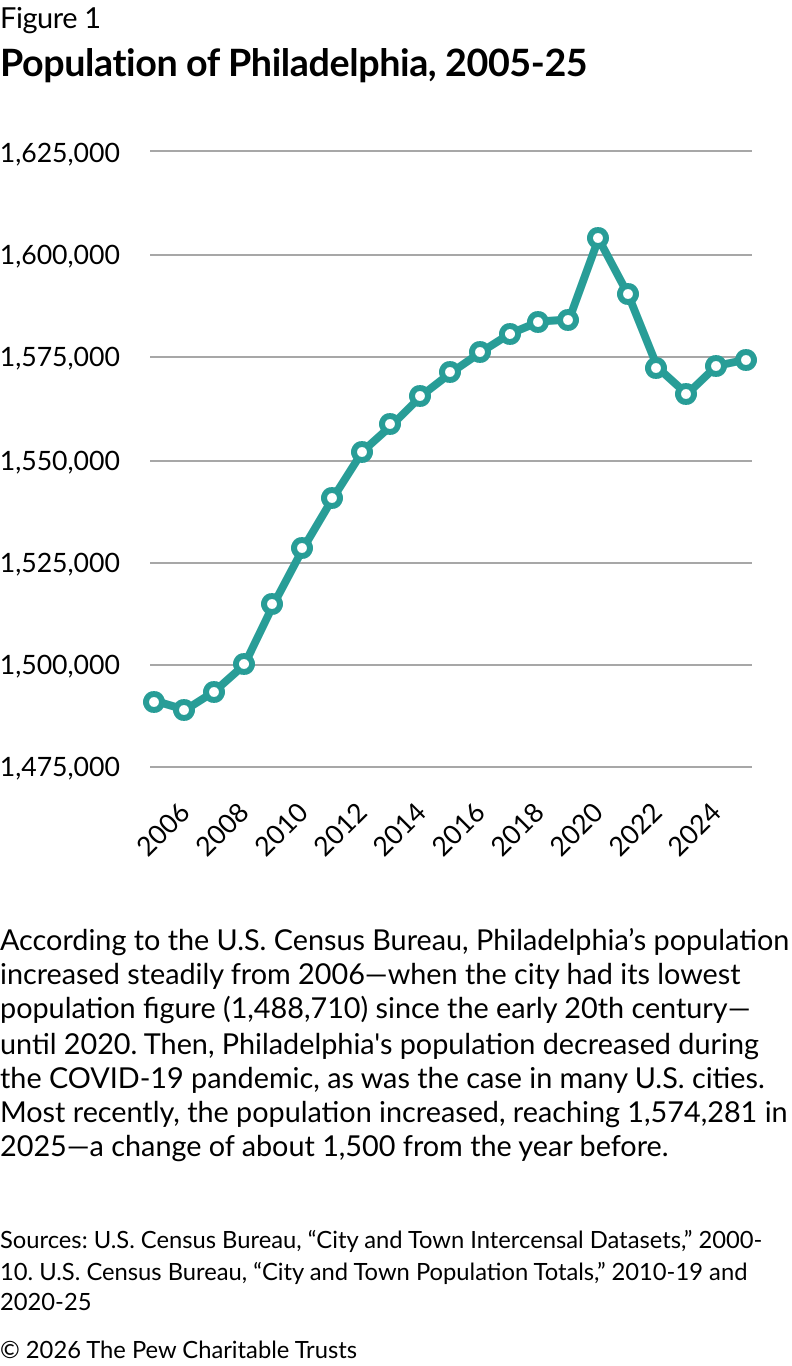
Despite some genuinely positive changes, there are some worrying signs for Philadelphia. The population has decreased since the 2020 census and remains low at the midpoint of the decade. Last year, there were 1,574,281 Philadelphians, an increase of around 1,500 from the year before. The growth that had marked a period of revival for the city in the 2000s and 2010s has stalled.

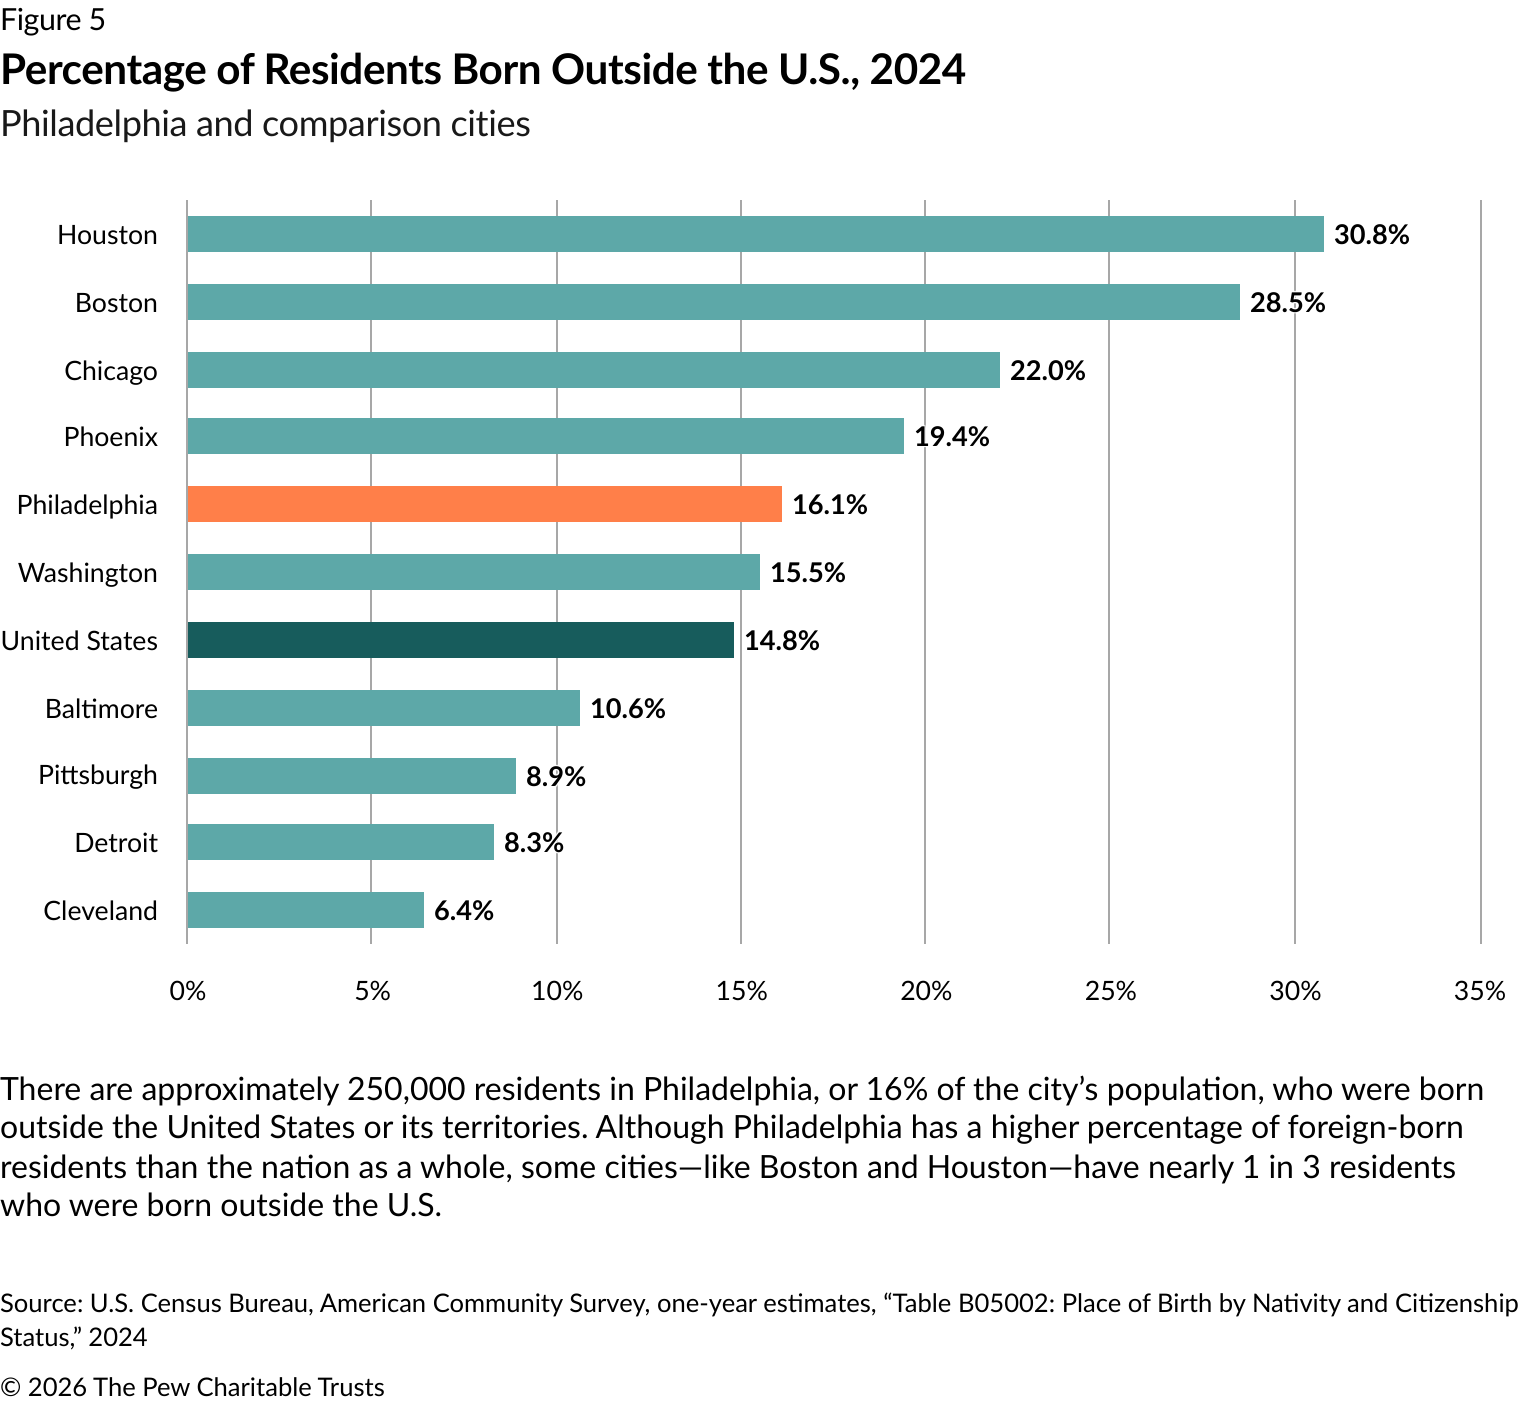
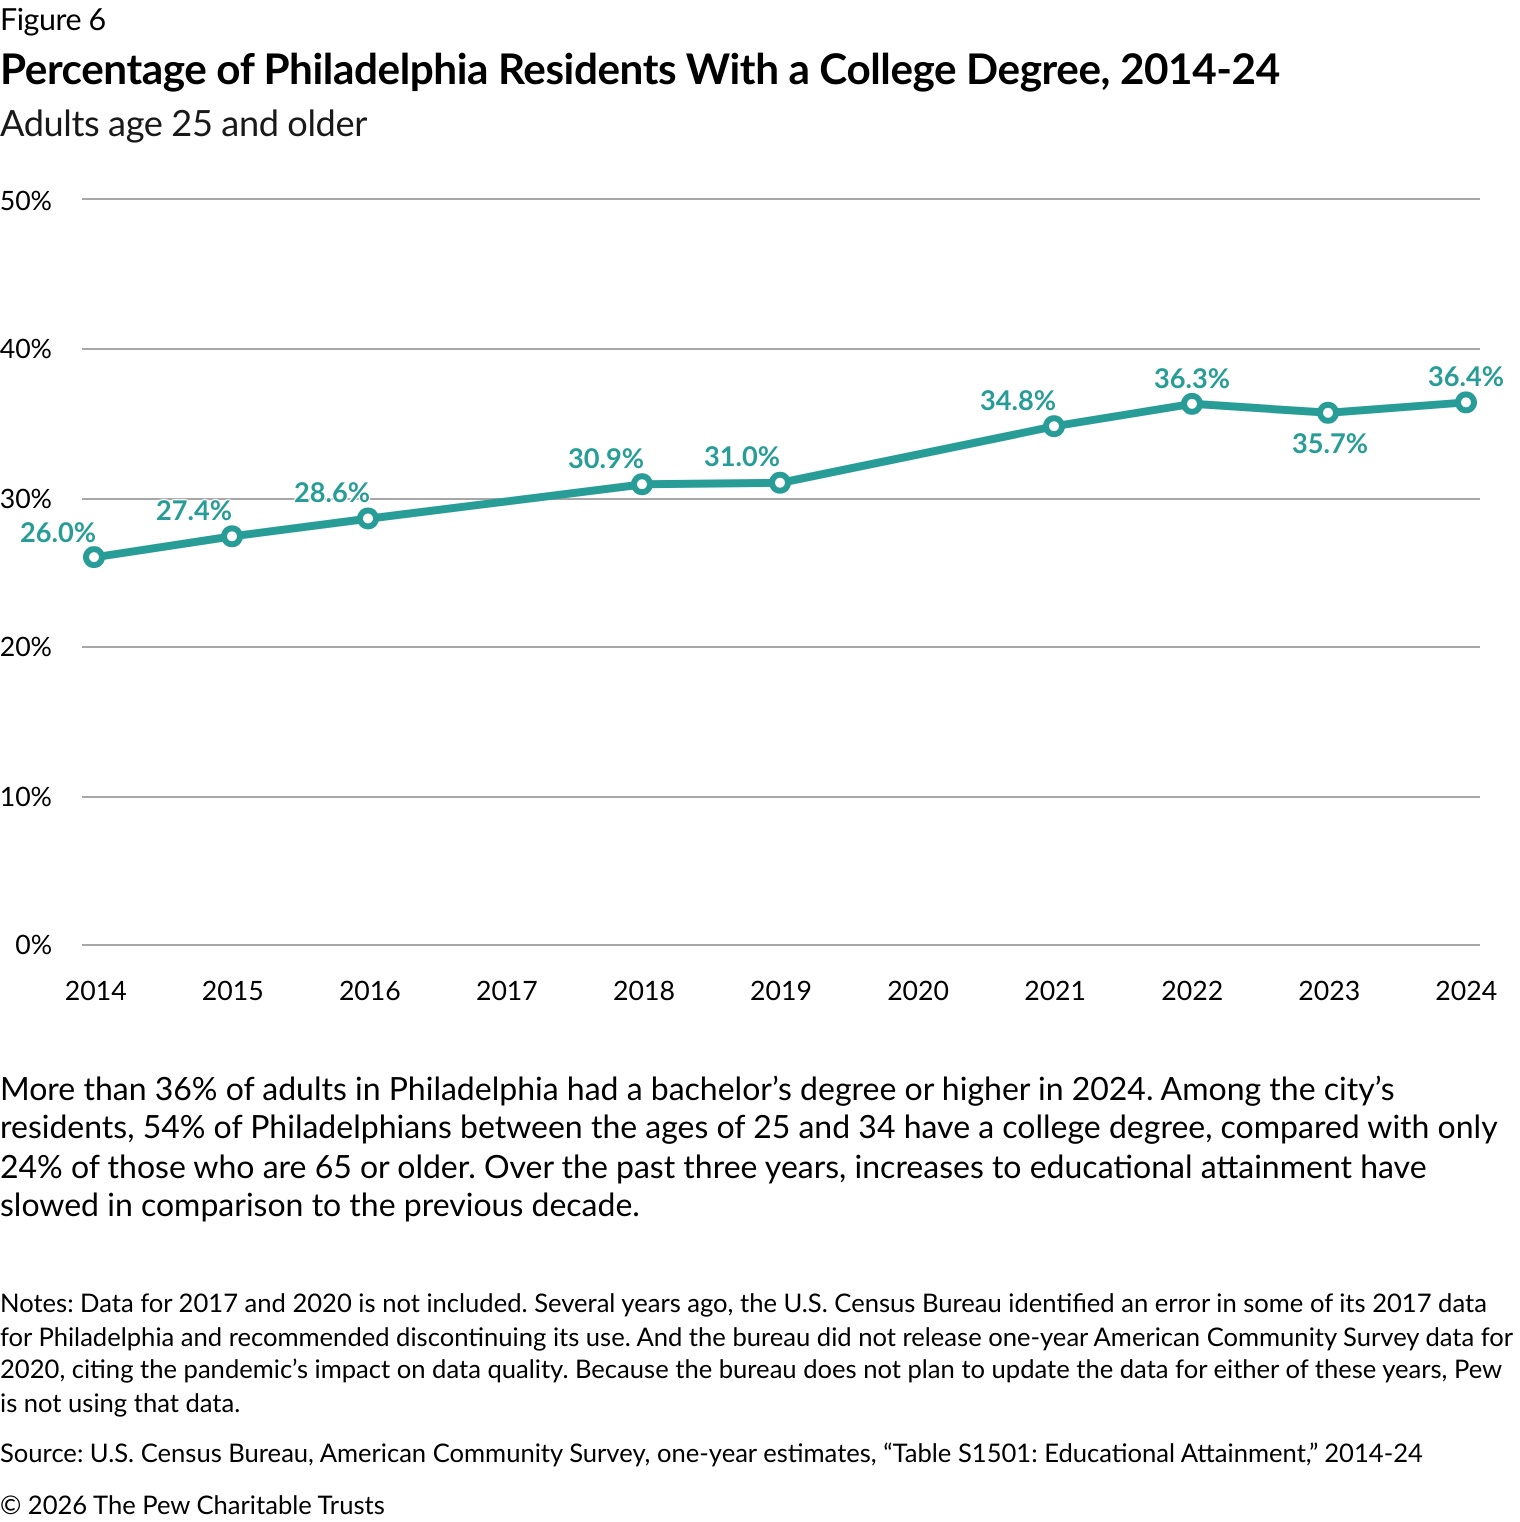
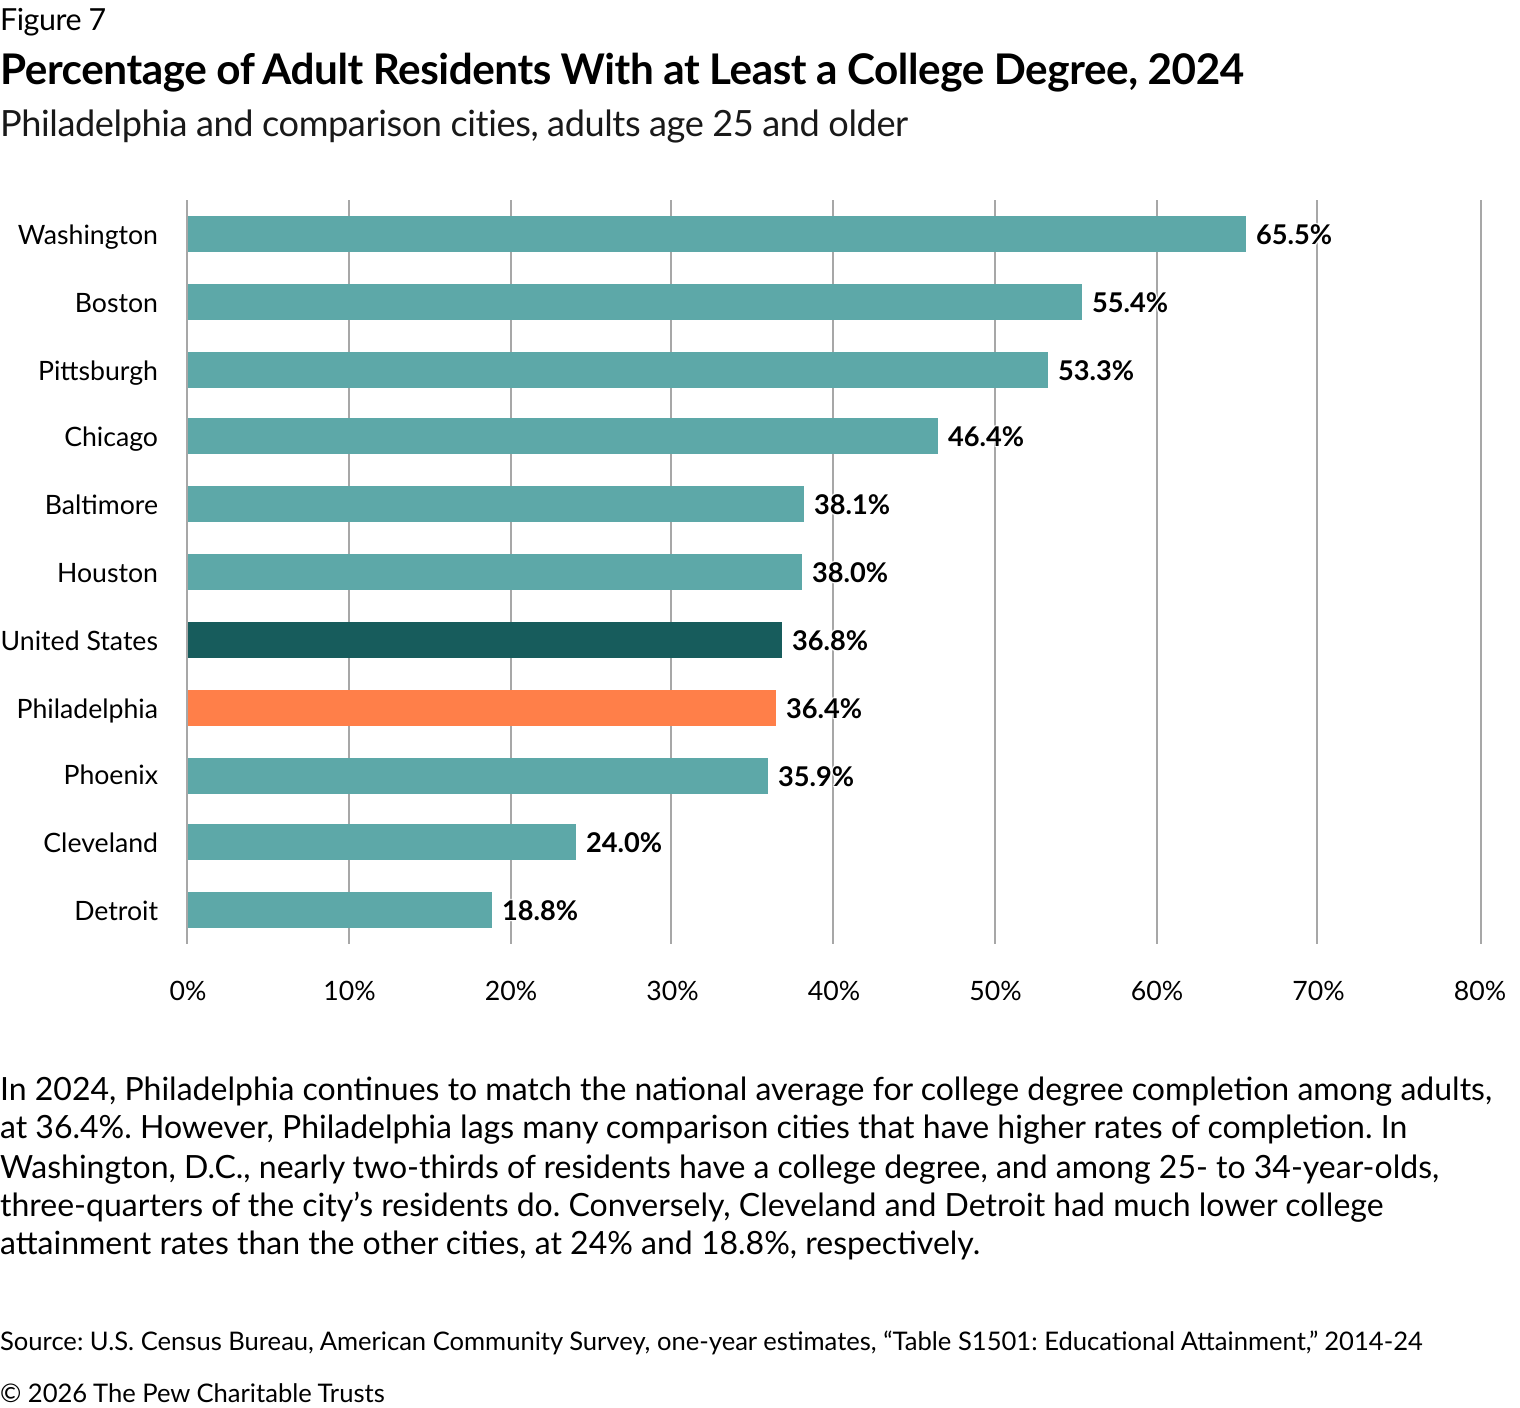
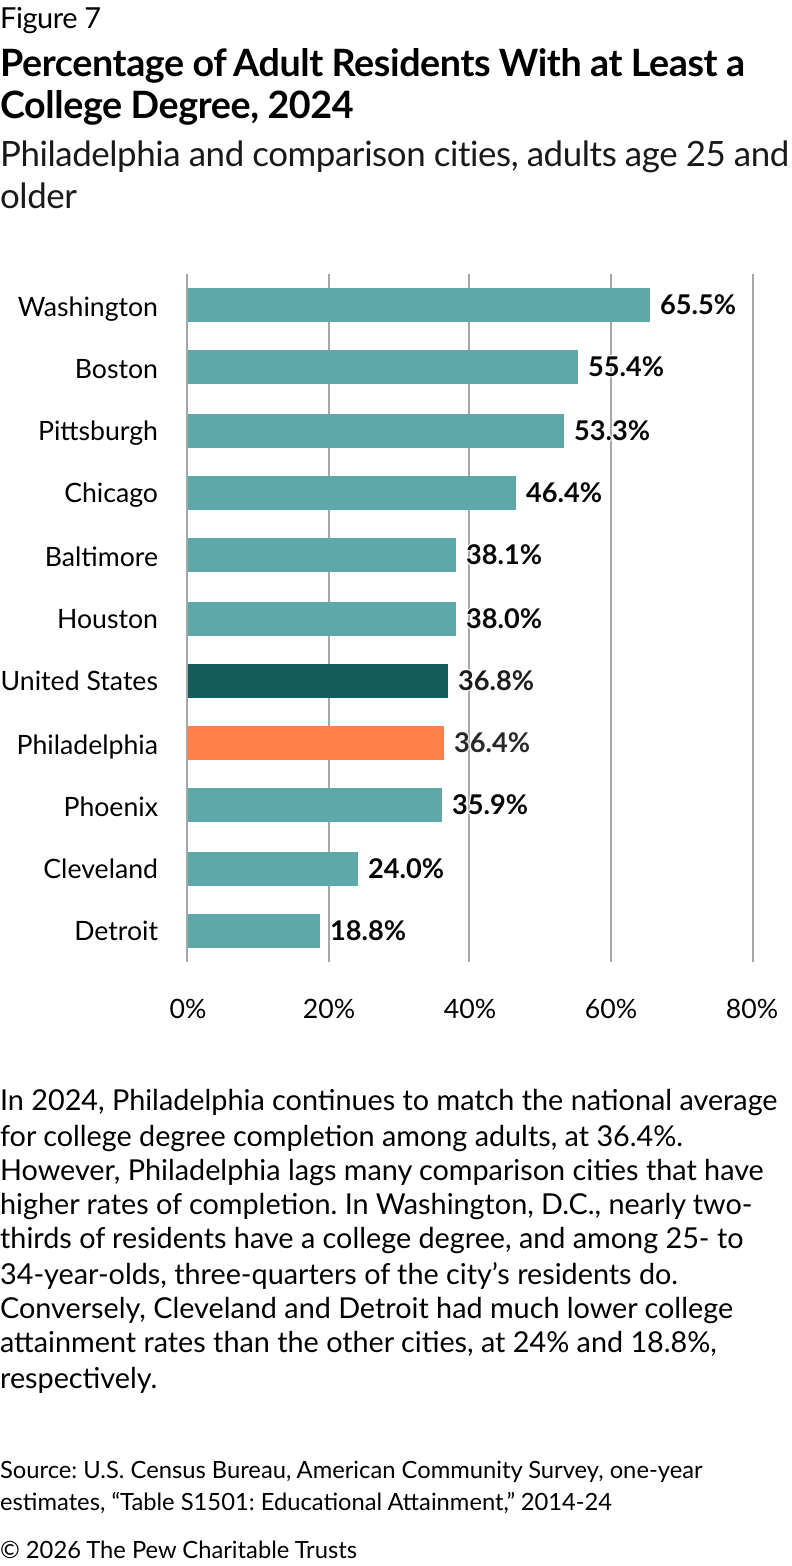
Increases in education attainment have lapsed since the pandemic. After multiple years of steady growth, the number of Philadelphians with a bachelor’s degree or higher plateaued at around 36% from 2021 to 2024. Meanwhile, other U.S. cities continue to build on their residents’ educational gains, particularly from individuals under 40 years old. And many jobs increasingly require applicants to have a college degree.

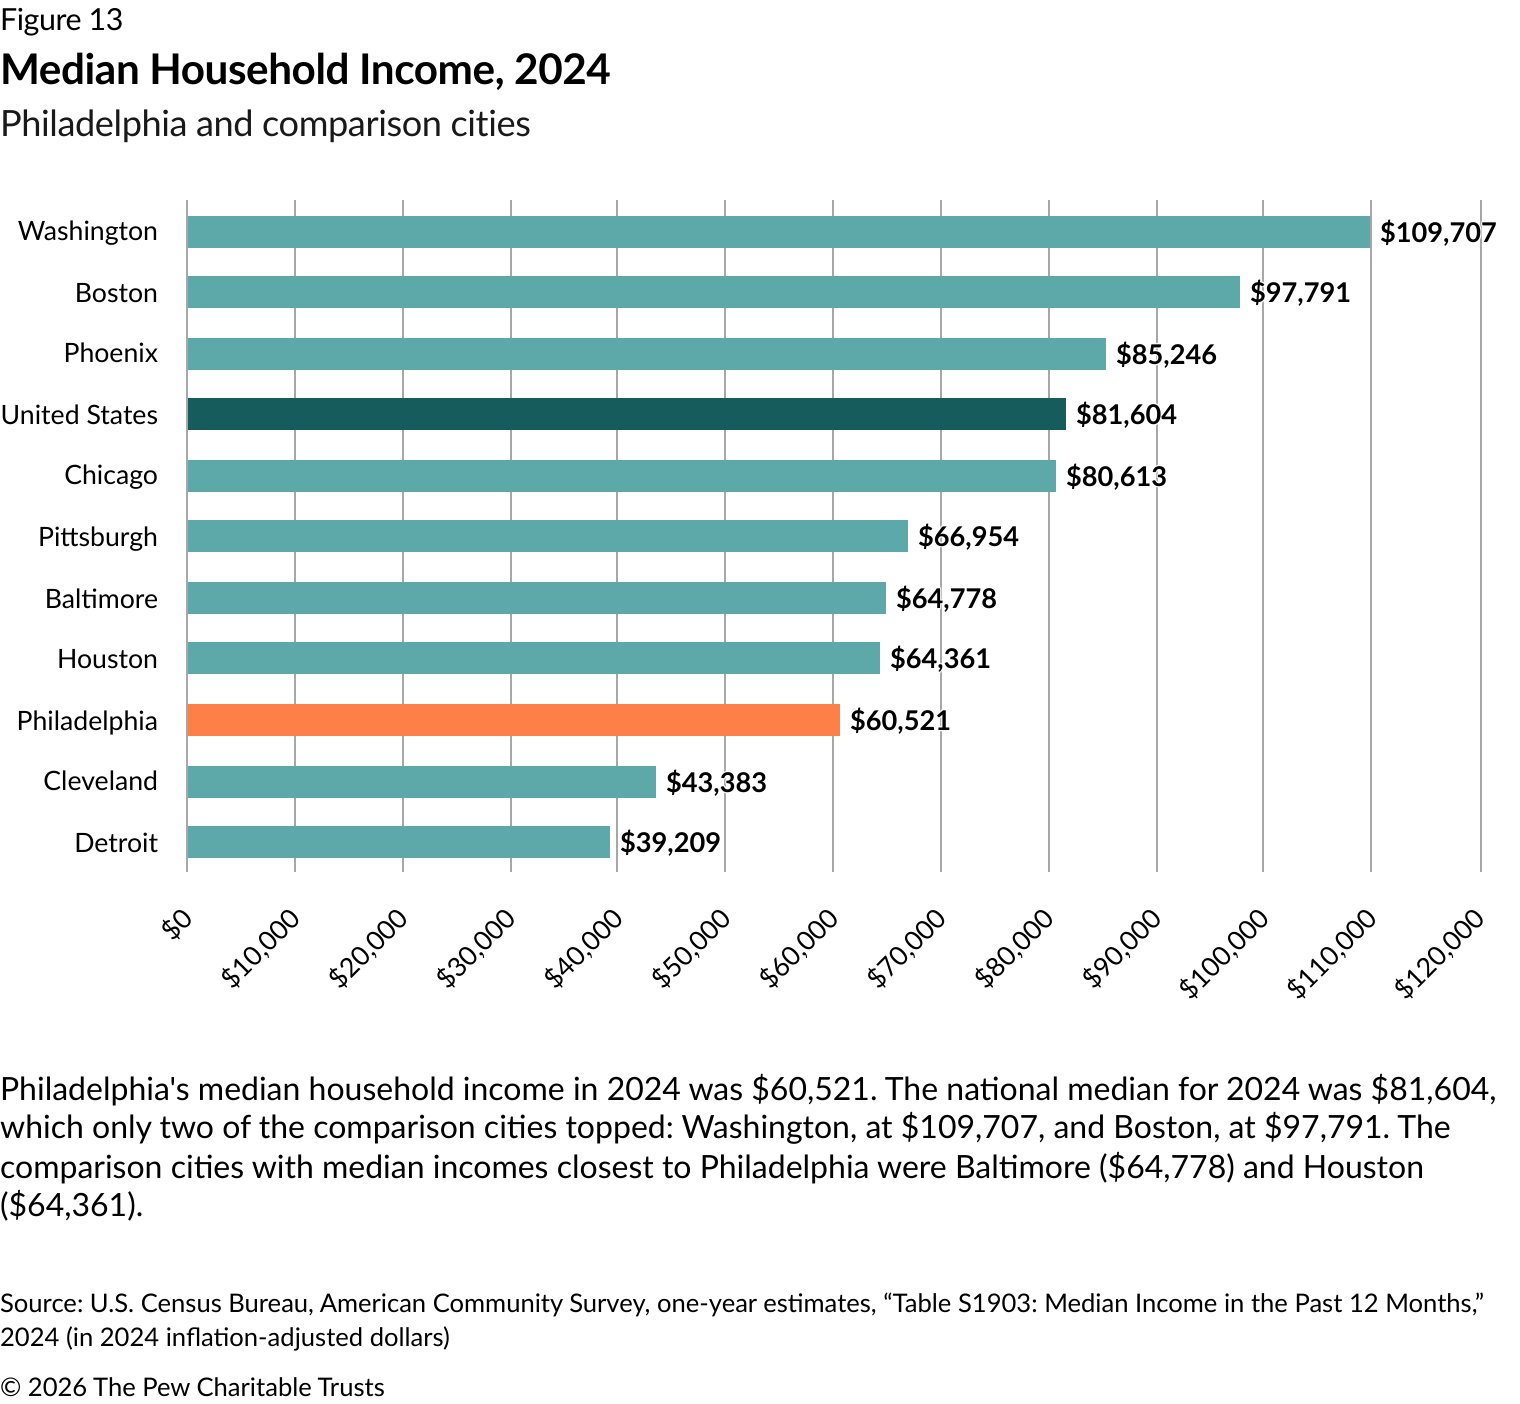
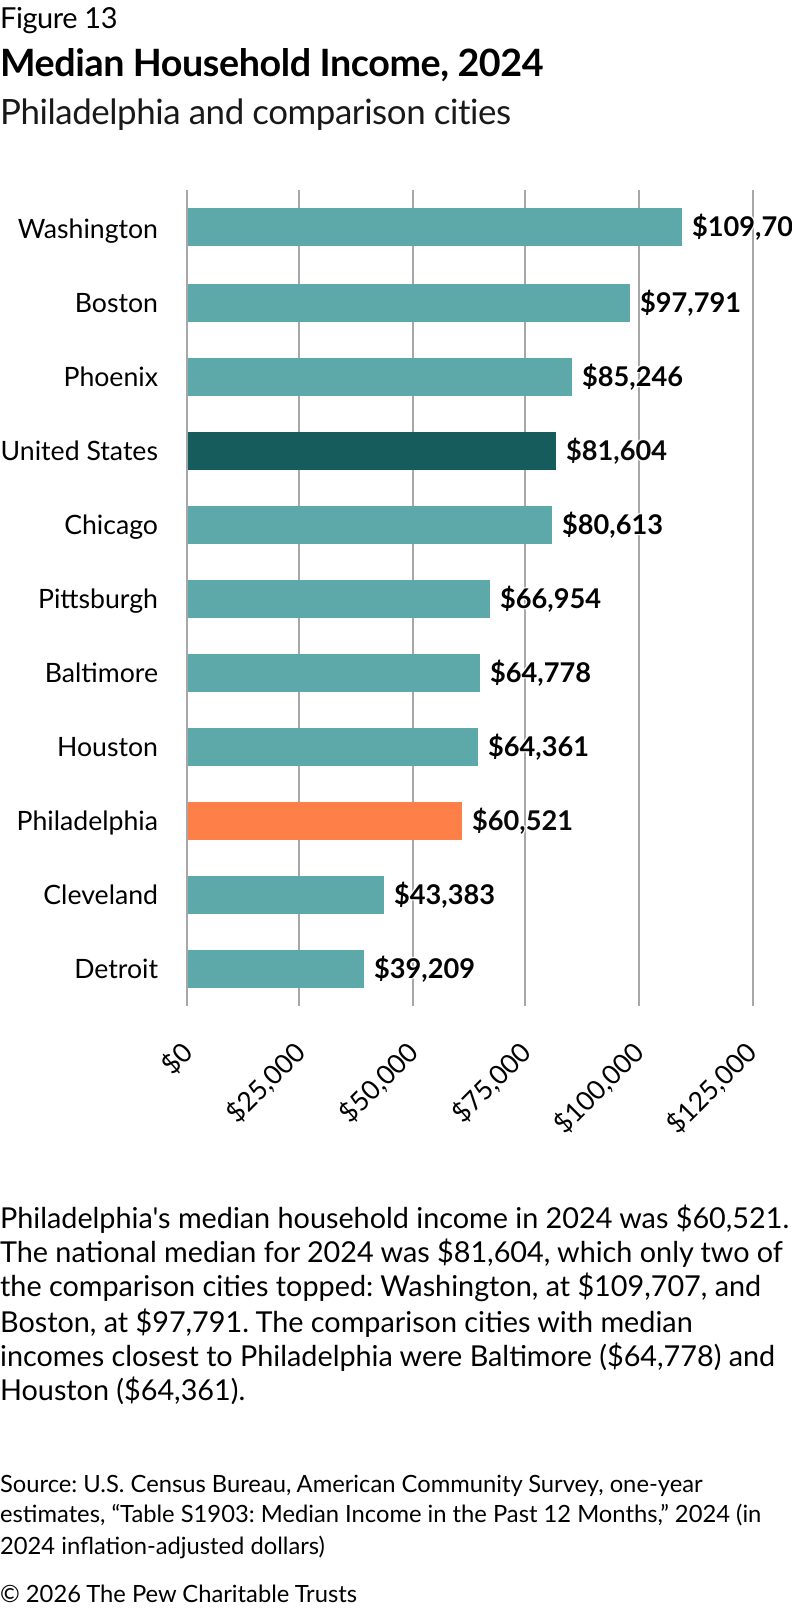
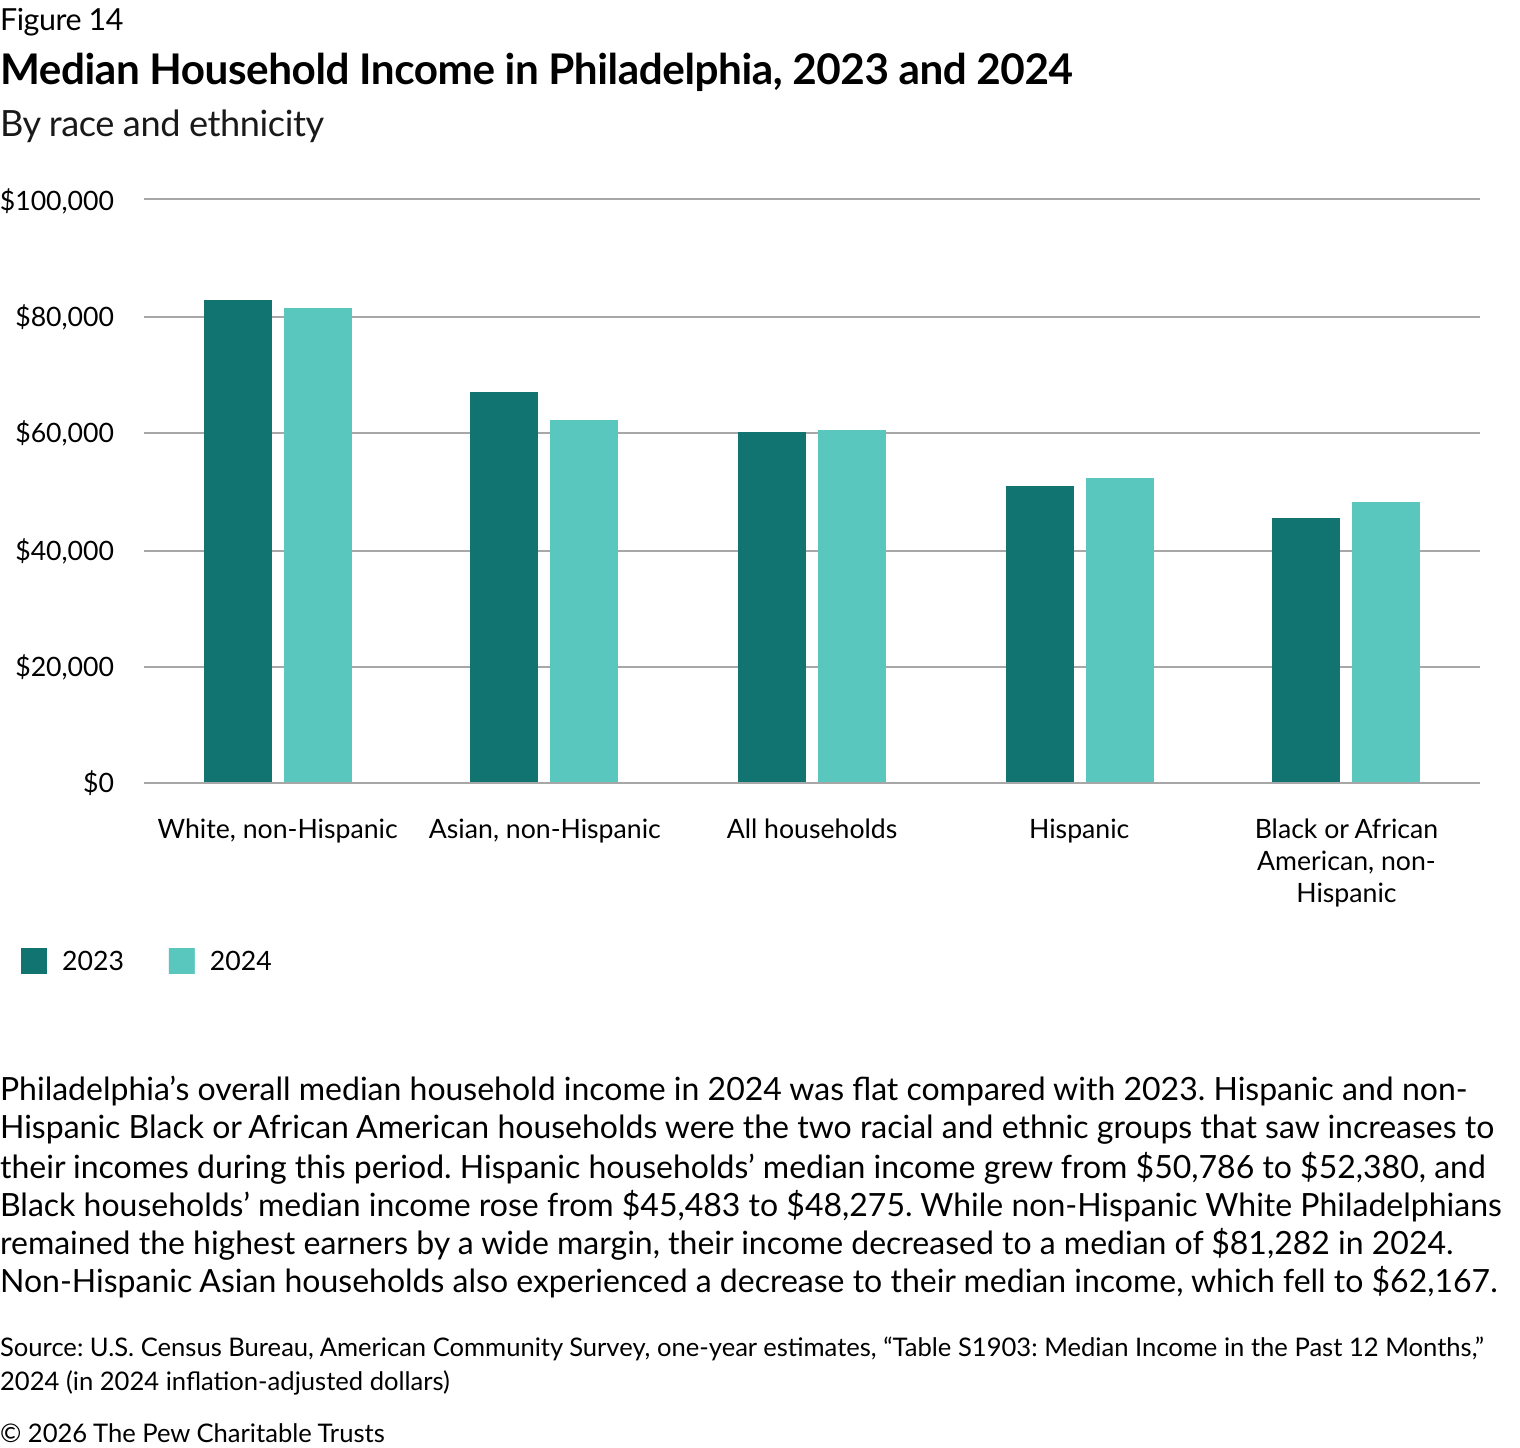
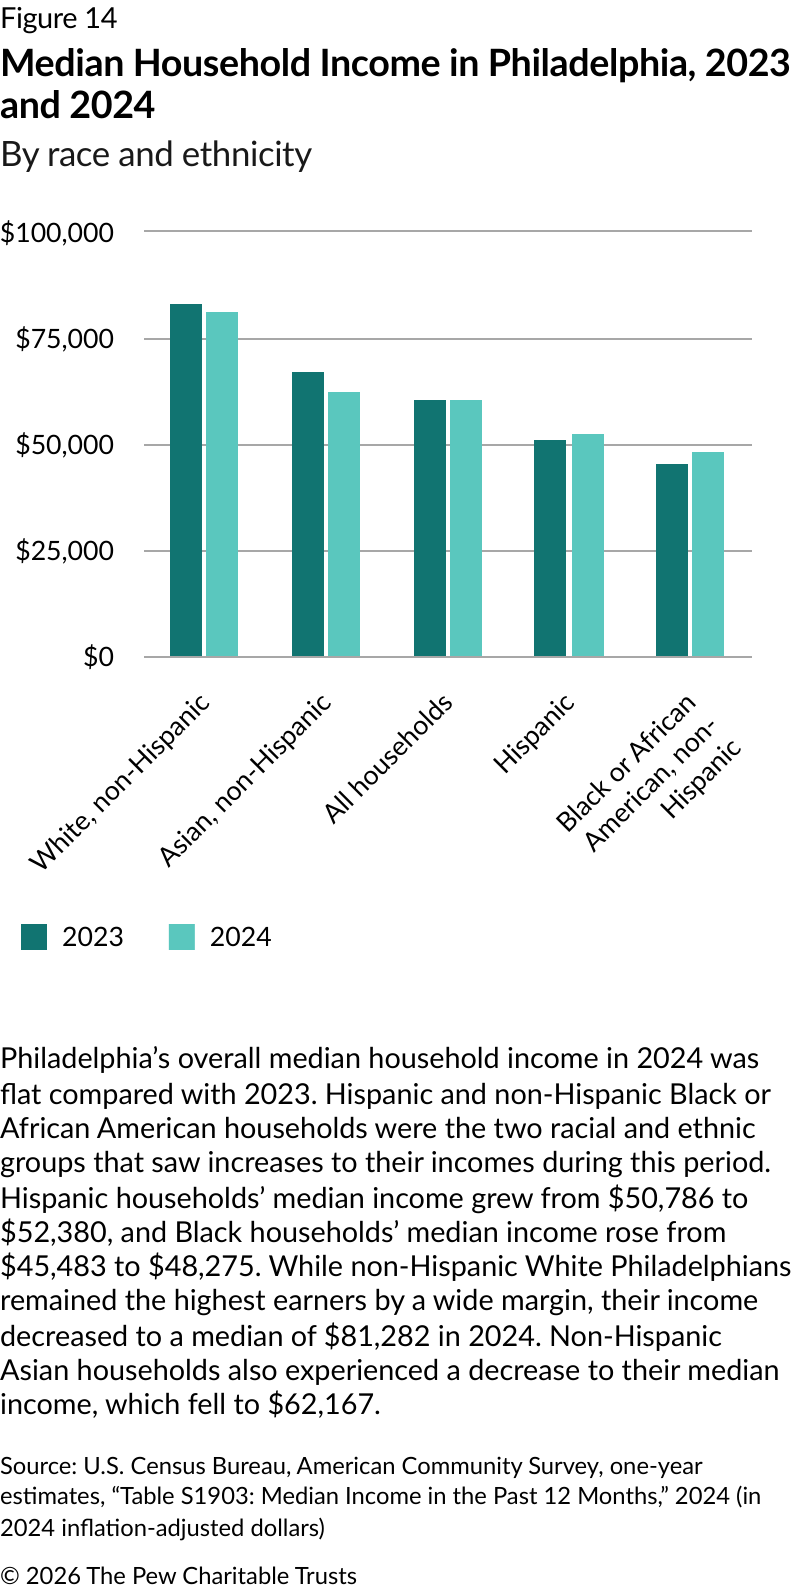
Furthermore, increases to median household income have slowed. In the latest data, Philadelphia’s median household income was $60,521. While the median household income for non-Hispanic Black and Hispanic Philadelphians rose slightly from 2023 to 2024, it declined for non-Hispanic White and non-Hispanic Asian residents. These shifts—the increase to the unemployment rate and the flattening of educational attainment and household income—threaten residents’ financial stability.

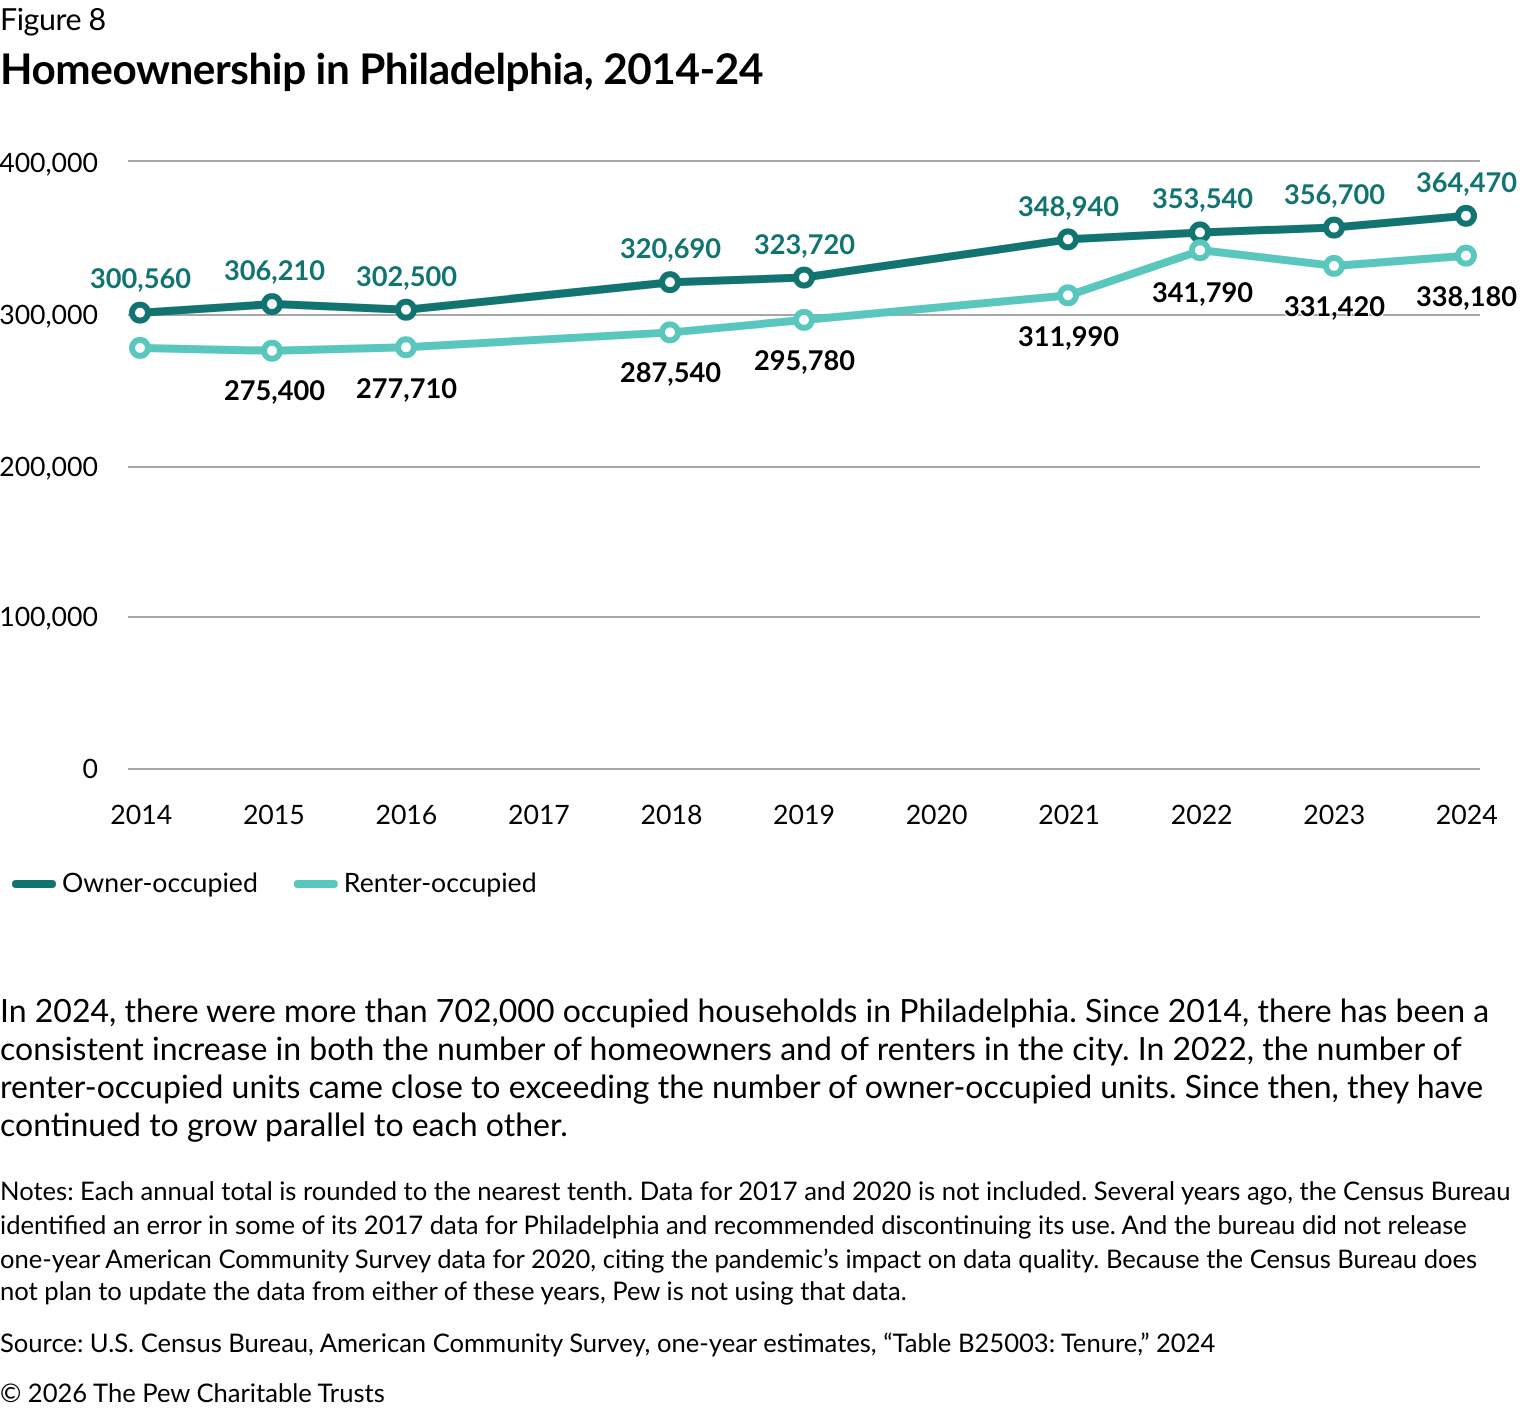
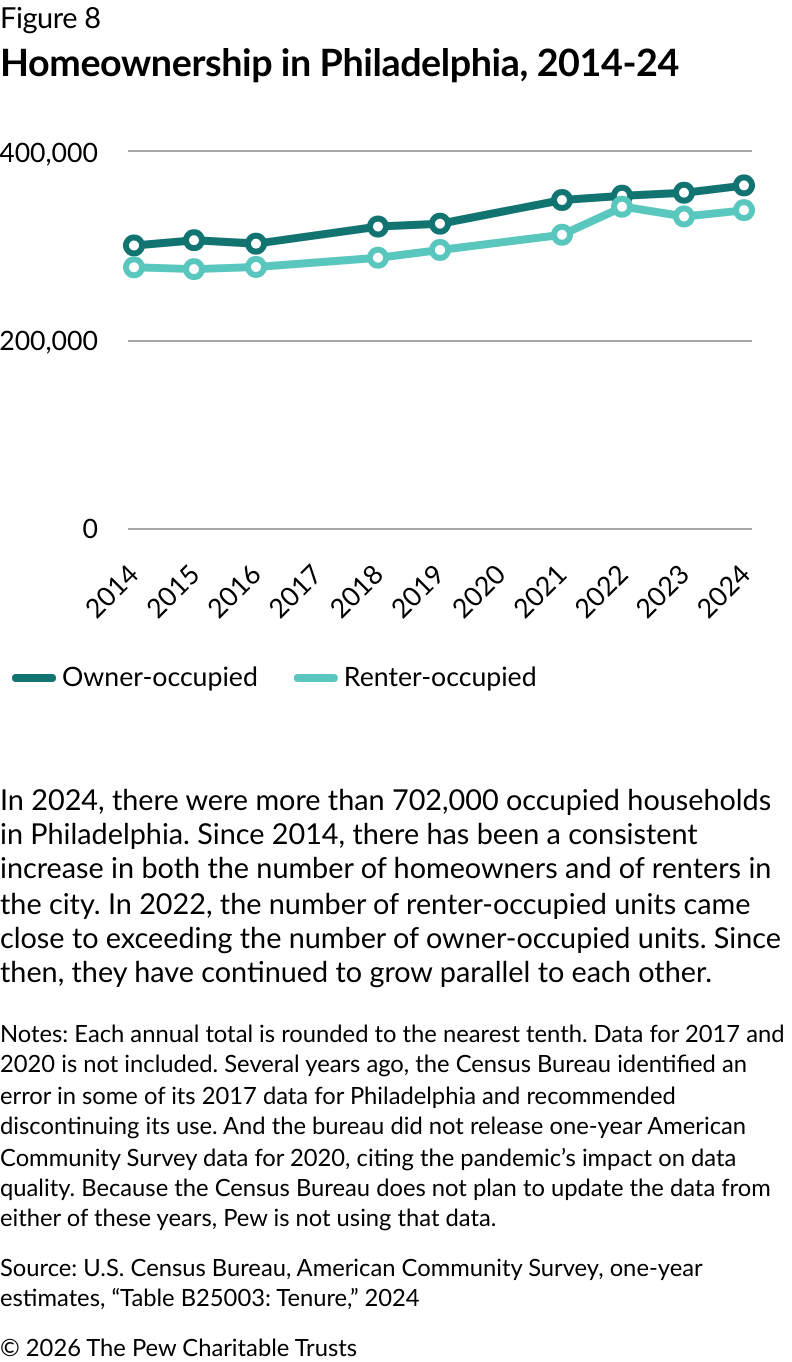
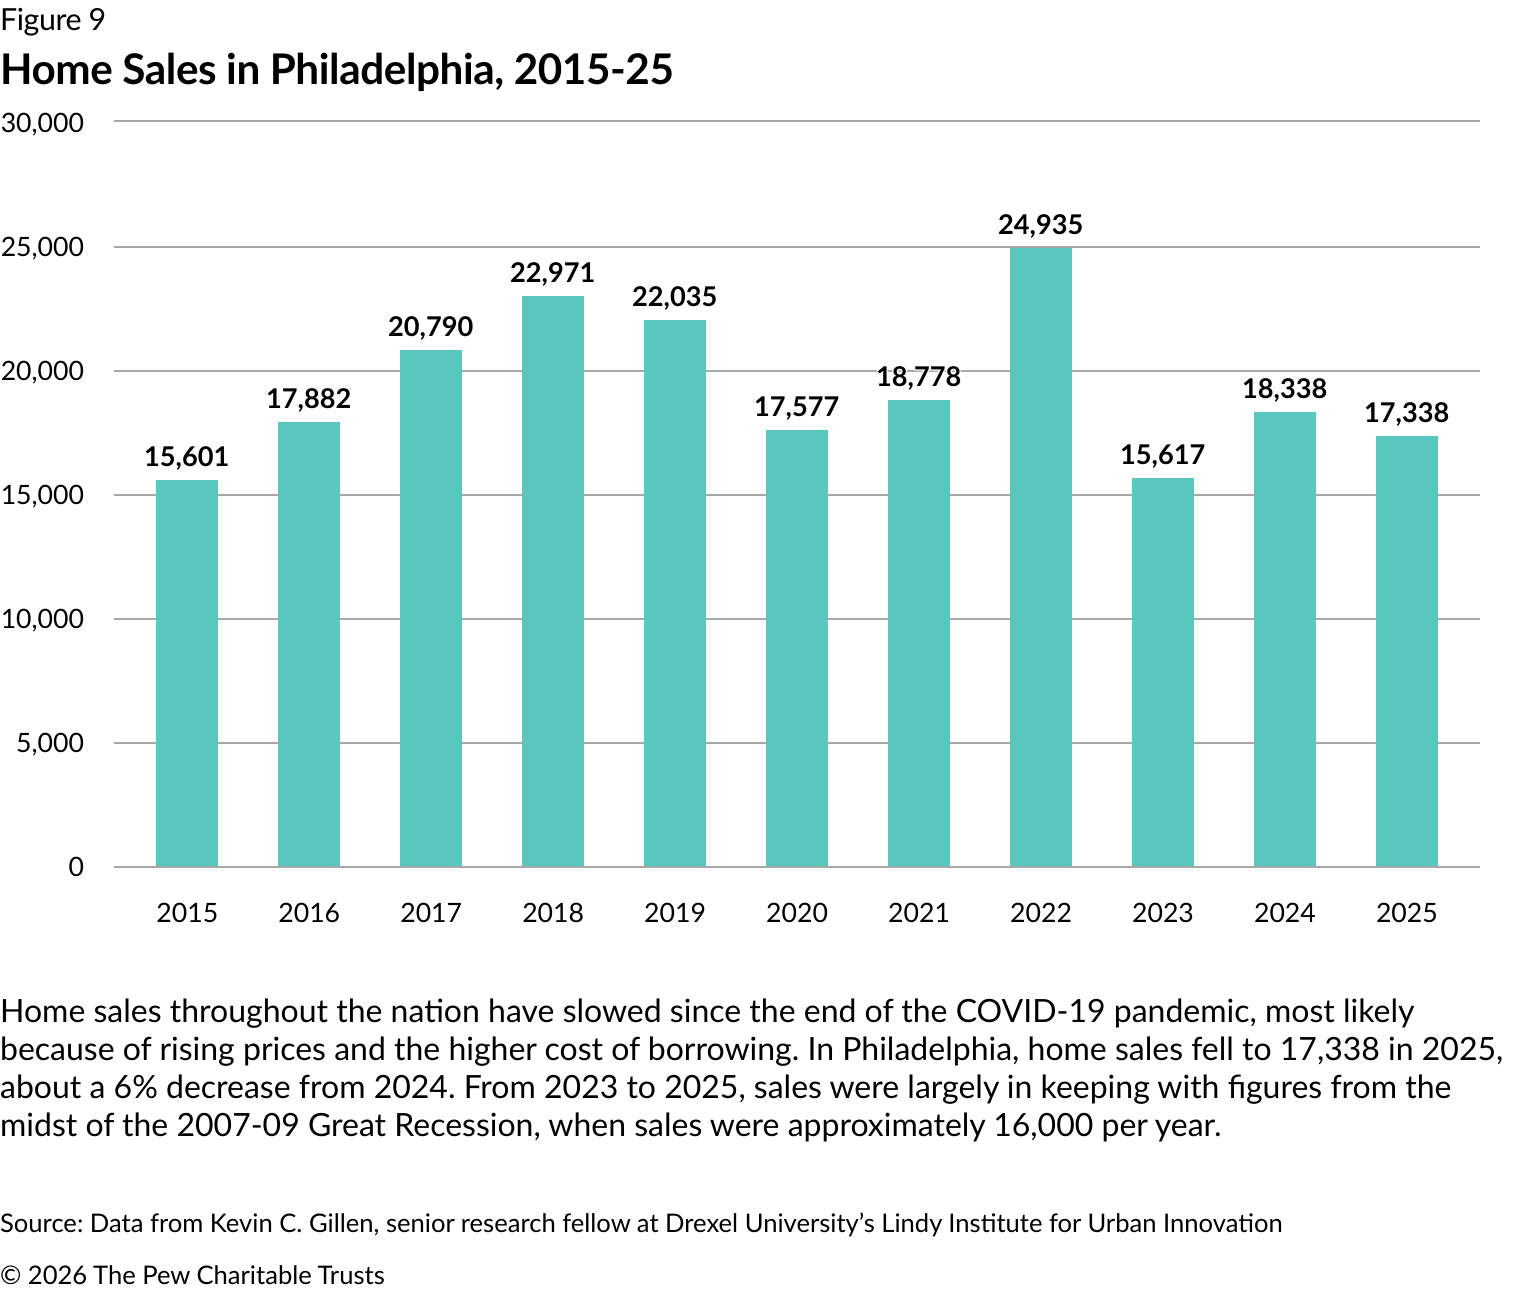
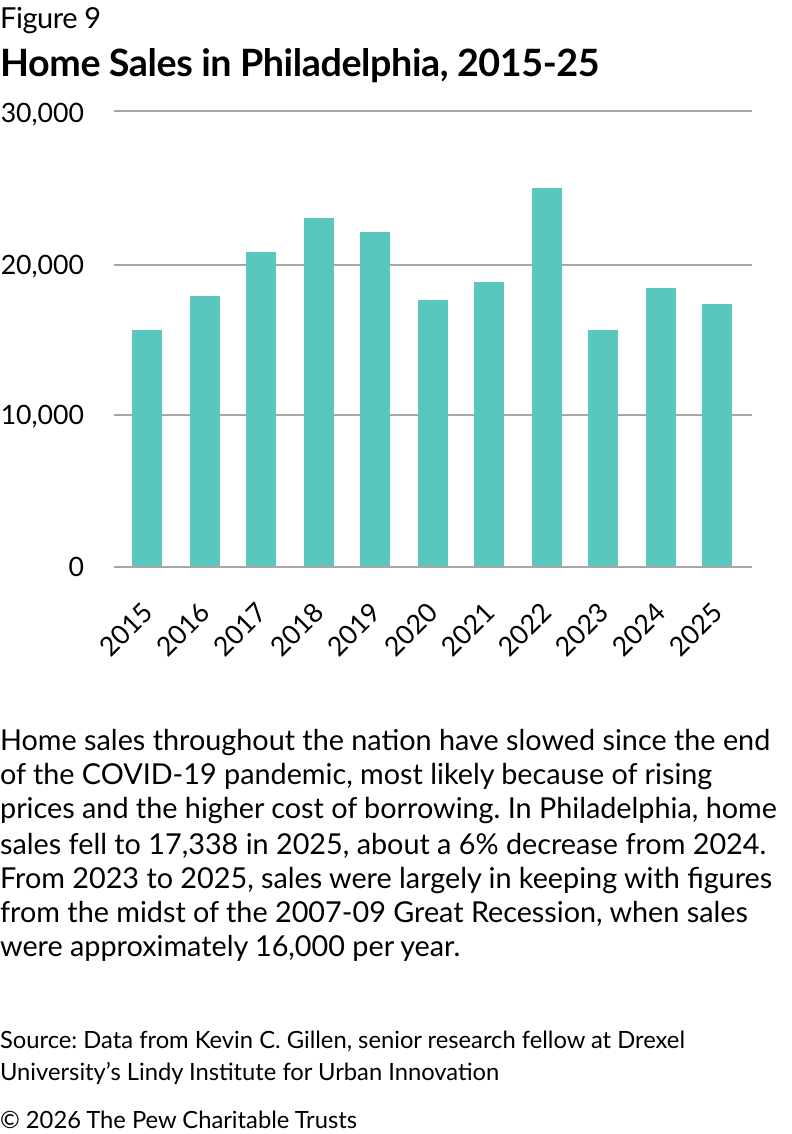
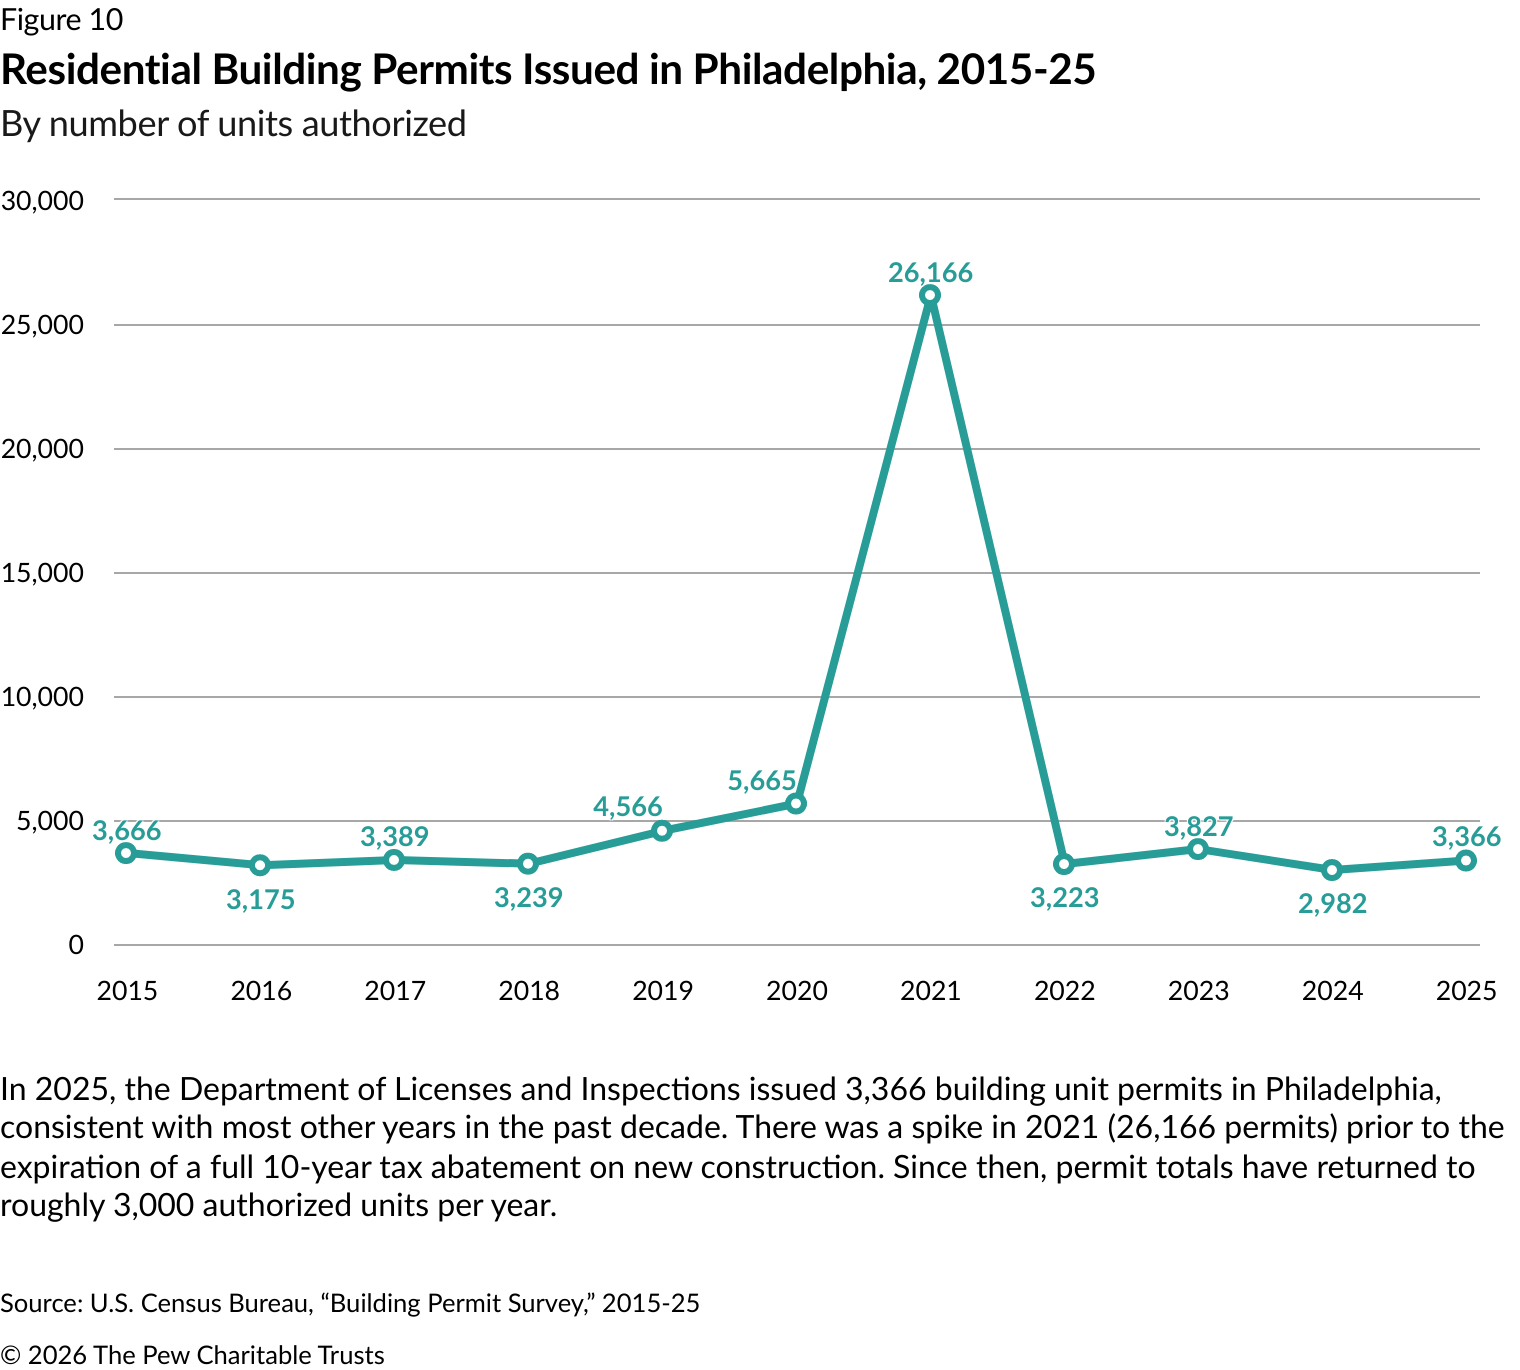
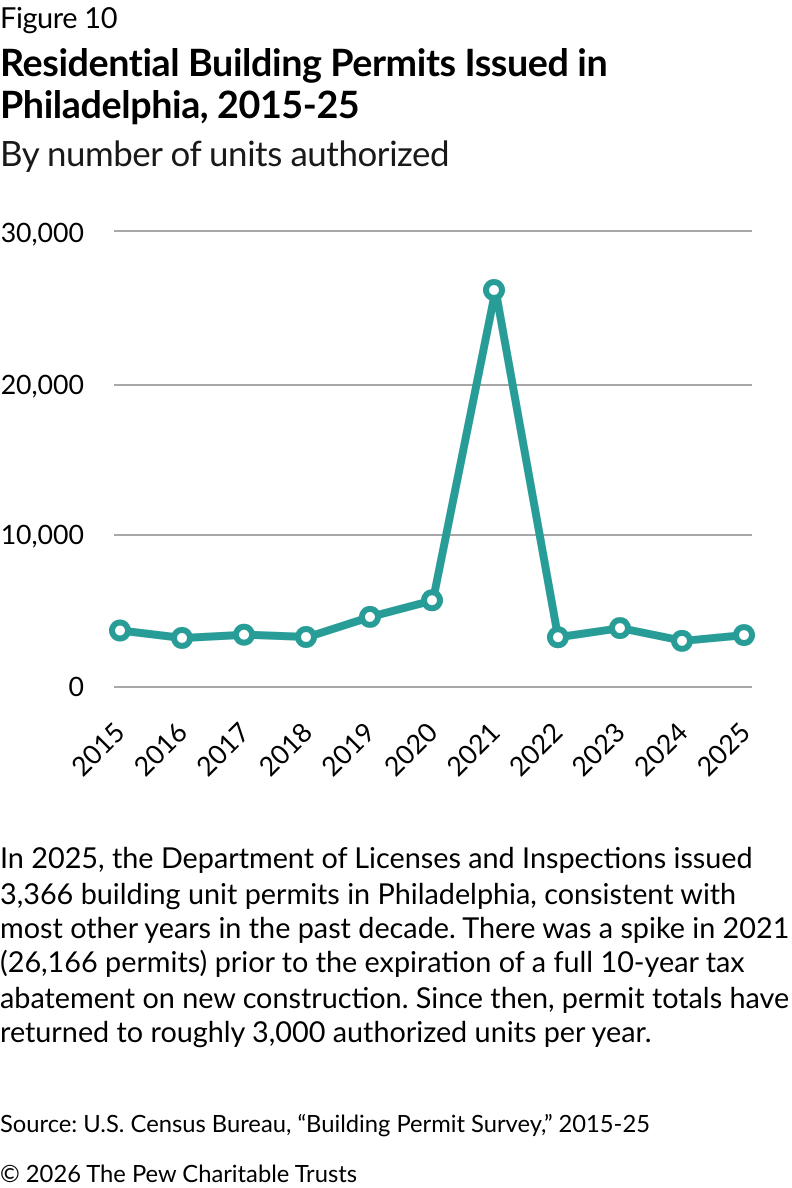
Housing in Philadelphia continued to include some positive changes amid ongoing affordability concerns. The 17,338 home sales last year were on par with the years prior to the pandemic, and new building permits issued remained steady at 3,366, following a steep decline in 2022 after the city ended its 10-year property tax abatement program. In 2025, the Parker administration focused on receiving approval for its investment in new, preserved, and rehabilitated housing, with the passage of the Housing Opportunities Made Easy Initiative. In January 2026, the City Council passed a bill authorizing the city to borrow $800 million to partially fund the program.

In this year of milestones and celebrations, Philadelphia has plenty to applaud. Many of the city’s most persistent challenges are trending in the right direction. At the same time, some of the city’s recent strengths are showing strain.


Hispanic Black or African American, non-hispanic Asian, non-hispanic White, non-hispanic
2014 42.90% 31.40% 24.30% 14.00%
2015 39.20% 31.50% 26.30% 13.80%
2016 37.90% 30.80% 22.90% 14.90%
2017
2018 37.80% 29.40% 21.00% 14.10%
2019 40.20% 26.70% 23.10% 12.70%
2020
2021 30.00% 28.30% 22.70% 12.60%
2022 33.30% 25.00% 18.80% 12.70%
2023 26.00% 24.50% 19.90% 12.50%
2024 27.60% 22.30% 21.30% 13.10%
City of Philadelphia Metro Philadelphia United States
2015 7.3% 5.5% 5.3%
2016 6.3% 5.0% 4.9%
2017 5.9% 4.7% 4.4%
2018 5.3% 4.2% 3.9%
2019 5.1% 4.0% 3.7%
2020 11.4% 8.9% 8.1%
2021 7.8% 6.0% 5.4%
2022 4.9% 4.0% 3.7%
2023 4.3% 3.7% 3.6%
2024 4.5% 3.8% 4.0%
2025 5.1% 4.3% 4.3%
Figure 15

Median Household Income in Philadelphia, 2020-24

By census tract

A map of Philadelphia showing median household income from 2020 through 2024, by ZIP code. Median household income is represented by five shades of teal, the lightest shade representing households making less than $30,000 annually and the darkest shade representing earners making more than $90,000. The highest-earning households were in Center City and in the northwest area of Philadelphia; the lowest-earning households were in the north, west, and southwest areas. Below the map, a chart more specifically details the median incomes in Philadelphia, by ZIP codes.

In 2024, Philadelphia’s median household income was around $62,000 annually. The highest median household incomes were in the northwest and south sections of the city, and in Center City. In the Center City-Society Hill area (located in the 19106 ZIP code), the median household income ($121,047) was nearly twice the citywide median, while in North Philadelphia-West (ZIP code 19132), it was $32,823.

Source: U.S. Census Bureau, American Community Survey, “DP03: Selected Economic Characteristics,” 2015-19 and 2020-24

© 2026 The Pew Charitable Trusts View image View image

ZIP code Neighborhood Median household income (2020-24) Percentage change from 2015-19 to 2020-24
19106 Center City-Society Hill $121,047 13%
19130 Fairmount South $112,037 33%
19118 Chestnut Hill $109,649 23%
19125 Kensington/Fishtown  $109,554 50%
19147 South Philadelphia-Bella Vista $105,755 30%
19146 South Philadelphia-Schuylkill $103,059 49%
19123 Northern Liberties/Spring Garden $102,106 30%
19127 Manayunk $102,106 35%
19102 Center City West $102,093 5%
19103 Center City West $99,644 31%
19154 Northeast-Torresdale North $95,027 41%
19128 Roxborough $93,173 25%
19119 Mount Airy $92,651 44%
19148 South Philadelphia-East $82,605 59%
19129 East Falls  $80,606 2%
19114 Northeast-Torresdale South $77,708 27%
19137 Northeast-Bridesburg $76,739 44%
19145 South Philadelphia-West $71,965 55%
19115 Northeast-Bustleton South $70,054 26%
19107 Center City-Washington Square  $69,105 20%
19116 Northeast-Bustleton North/Somerton  $67,535 18%
19150 Northeast-Wadsworth $66,936 40%
19122 North Philadelphia-Yorktown $63,676 71%
19111 Northeast-Fox Chase $61,138 20%
19152 Northeast-Rhawnhurst $59,408 14%
19149 Northeast-Mayfair/Oxford Circle $58,496 29%
19138 Germantown East $57,744 40%
19136 Northeast-Holmesburg $56,687 11%
19153 Eastwick $55,213 15%
19151 Overbrook $54,634 10%
19120 Olney $54,000 45%
19126 Oak Lane $53,176 21%
19144 Germantown $53,161 56%
19135 Northeast-Tacony $53,138 17%
19131 Wynnefield/West Park  $48,393 30%
19124 Northeast-Frankford $45,314 35%
19134 Port Richmond  $44,066 40%
19141 Logan $43,998 36%
19143 Southwest Philadelphia-Kingsessing $43,244 25%
19139 West Philadelphia-West Market $40,947 34%
19104 West Philadelphia-University City $38,814 44%
19121 Fairmount North/Brewerytown  $38,516 82%
19142 Southwest Philadelphia-Paschall/Elmwood $38,376 15%
19140 Nicetown $36,226 59%
19132 North Philadelphia-West $32,823 52%
19133 North Philadelphia-East $31,034 52%

Source: U.S. Census Bureau, American Community Survey, “DP03: Selected Economic Characteristics,” 2015-19 and 2020-24

© 2026 The Pew Charitable Trusts

Figure 22

Domestic Violence Calls in Philadelphia, 2025

By ZIP code

A map of Philadelphia in three shades of teal, showing the number of calls to the city’s domestic violence hotline in 2025, by ZIP code. The lightest shade of teal represents ZIP codes with fewer than 50 calls, the slightly darker shade represents areas with 50 to 150 calls, and the darkest shade represents locales with more than 150 calls. The darkest areas were in the lower northwest, west, south, and north sections of Philadelphia. The lightly shaded areas were in Center City and in the northwest, northeast, and south Philadelphia areas.

Domestic violence is defined as the mistreatment of one family member or intimate partner by another. Philadelphia’s Domestic Violence Hotline handled a total of 4,037 calls from inside the city last year. The ZIP codes with the greatest number of calls were primarily in the north and west areas of Philadelphia. The parts of the city with the fewest calls were in the far northeast and northwest.

Note: The data includes only calls to the hotline with an identified Philadelphia ZIP code. This made up fewer than half of total calls received in 2025.

Source: “Citywide Domestic Violence Hotline Calls 2025,” data provided by Women Against Abuse

© 2026 The Pew Charitable Trusts View image View image


Media Contact

Jolene Nieves Byzon

215.575.4723