A Look at New Student Loan Borrowers
Survey shows majority in good standing with repayment system, even when experiencing financial hardships

Overview
After more than three years of paused payments and halted interest accumulation1 and a subsequent 12-month suspension of the consequences of missing payments, the student loan repayment system has returned to its pre-pandemic status quo. Millions of borrowers who were making payments before the pause have now returned to active repayment, while a group of new borrowers is entering repayment for the first time. The Department of Education estimates that approximately 7 million people are in this group of new borrowers.2
A survey by The Pew Charitable Trusts, conducted in May-July 2024 by opinion and market research company SSRS, sheds light on who these new borrowers are—exploring their demographics, repayment patterns, and financial security—and provides insights into their unique experiences during a specific point in time. This analysis defines new borrowers as (1) borrowers who did not yet have loans at the start of the pandemic (31% of all new borrowers) and (2) borrowers who had loans but were either still enrolled in school or in the six-month grace period after finishing or leaving school (69% of all new borrowers).
The survey shows that a high rate of new borrowers reported being in good standing and doing better than many expected, yet they have navigated many financial hardships during the first year of repayment. This descriptive profile outlines the types of support that borrowers will need from the government or their servicers to succeed in their repayment journey.
Demographic characteristics
The survey showed that slightly more than one-fourth (26%) of all federal student loan borrowers are considered new borrowers.
Figure 1 shows select demographics of new borrowers, including:
- More than half (51%) are White non-Hispanic or Latino; one-fifth (21%) are Hispanic or Latino; 17% are Black non-Hispanic or Latino; and the remainder (10%) fall in the “Other” category.
- Two out of five (41%) are ages 18-29, and over one-quarter (26%) are age 50 or older.
- Slightly over one-third (34%) do not have a college degree, and two-thirds (66%) have a postsecondary degree.
- Three-fourths (76%) are employed, and nearly one-quarter (24%) are unemployed.
- Nearly two-thirds (63%) of households earn more than $50,000.

Repayment experiences and engagement
Pew’s survey found that the vast majority (92%) of new borrowers making payments are in good standing with the repayment system—meaning they are actively making on-time payments including $0 payments through an income-driven repayment (IDR) plan. Because IDR plans base monthly student loan payments on the borrower’s income and family size, in some cases payments can be as low as $0.3 (Because the payments are $0, they are considered paid, leaving the borrower in good standing.)
More than two-thirds (67%) of all new borrowers say they know how to reach an official source with questions, such as the Department of Education or its servicers, and many new borrowers overall are enrolled in an IDR plan—indicating that they engage often with the repayment system. According to the survey, new borrowers had the following experiences in early repayment:
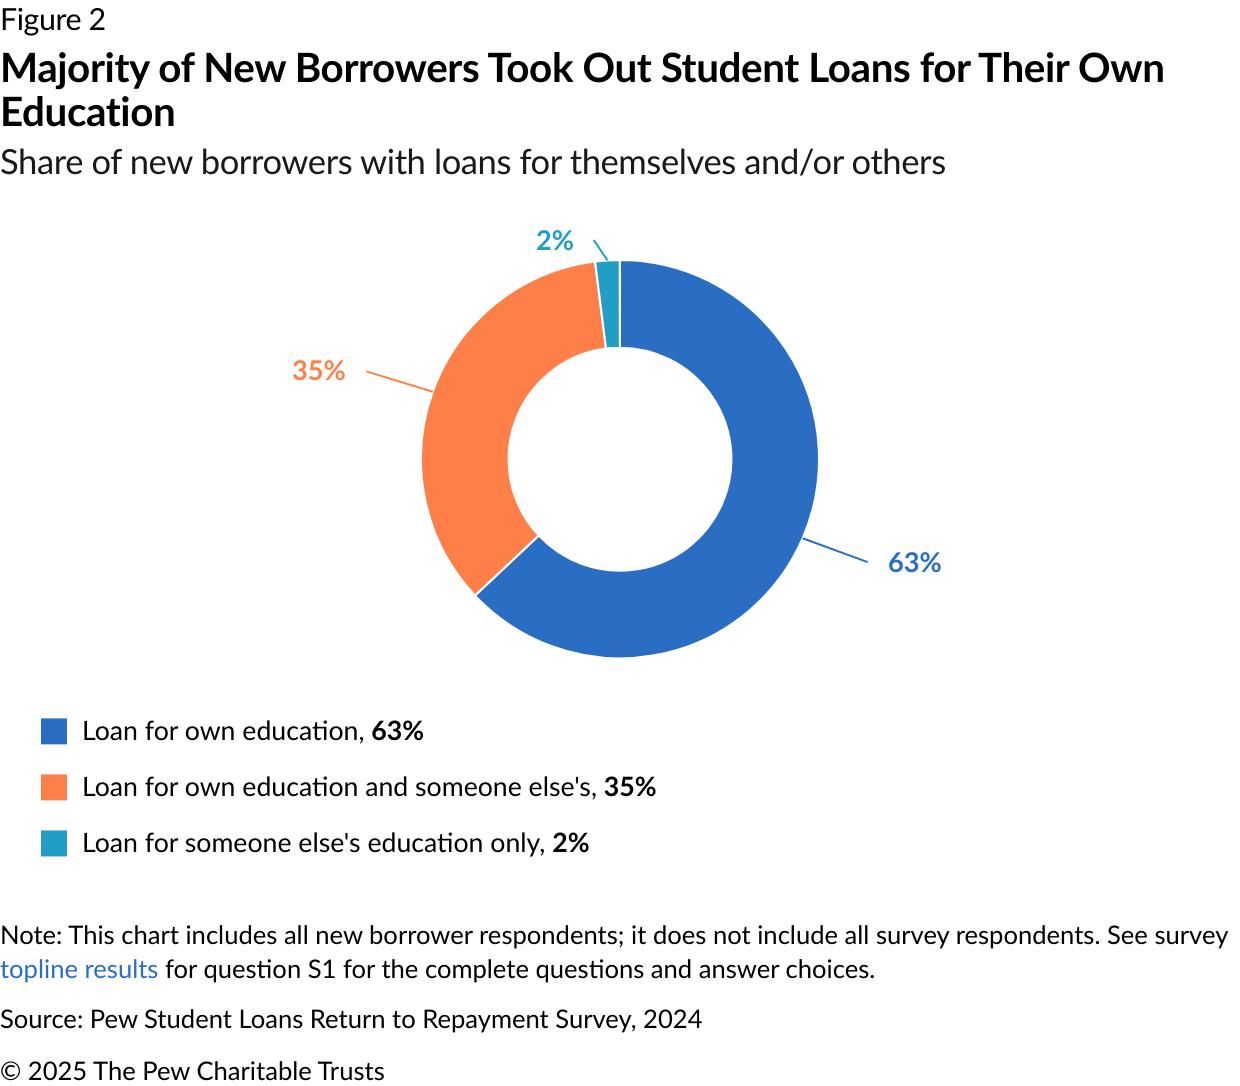
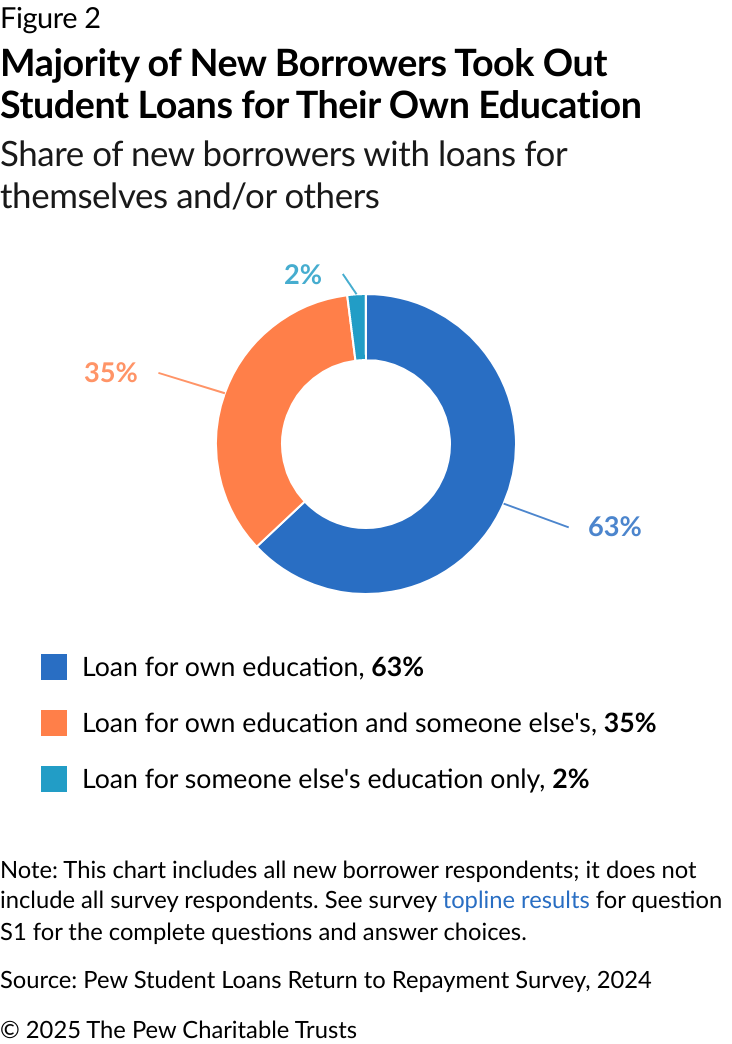
- 63% owed loans used to finance their own education at the time of the survey; 35% owed loans for their own education and someone else’s; and 2% owed loans only for someone else’s education. (See Figure 2.)
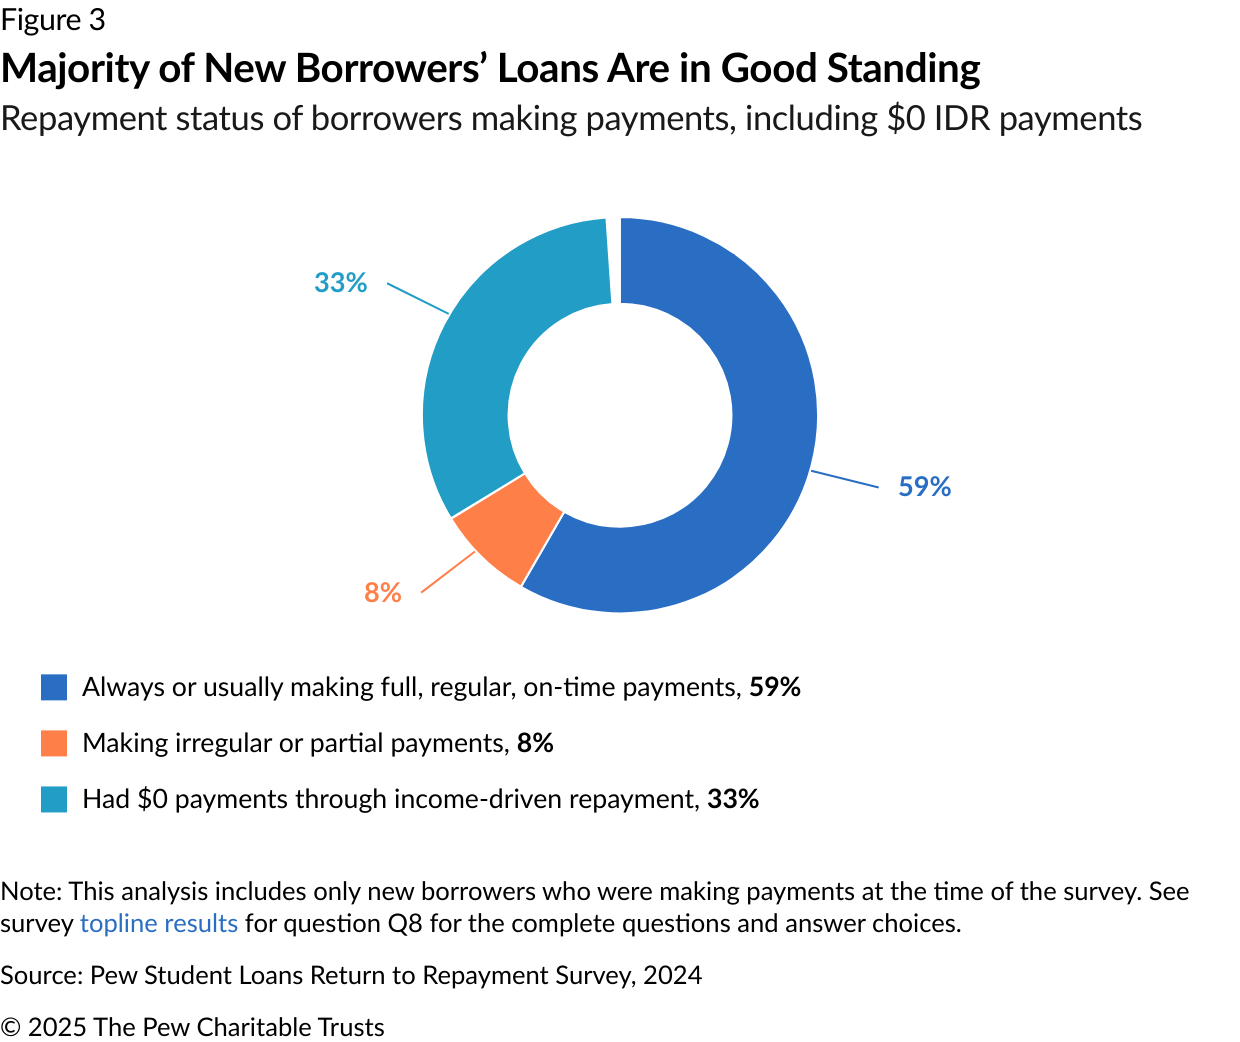
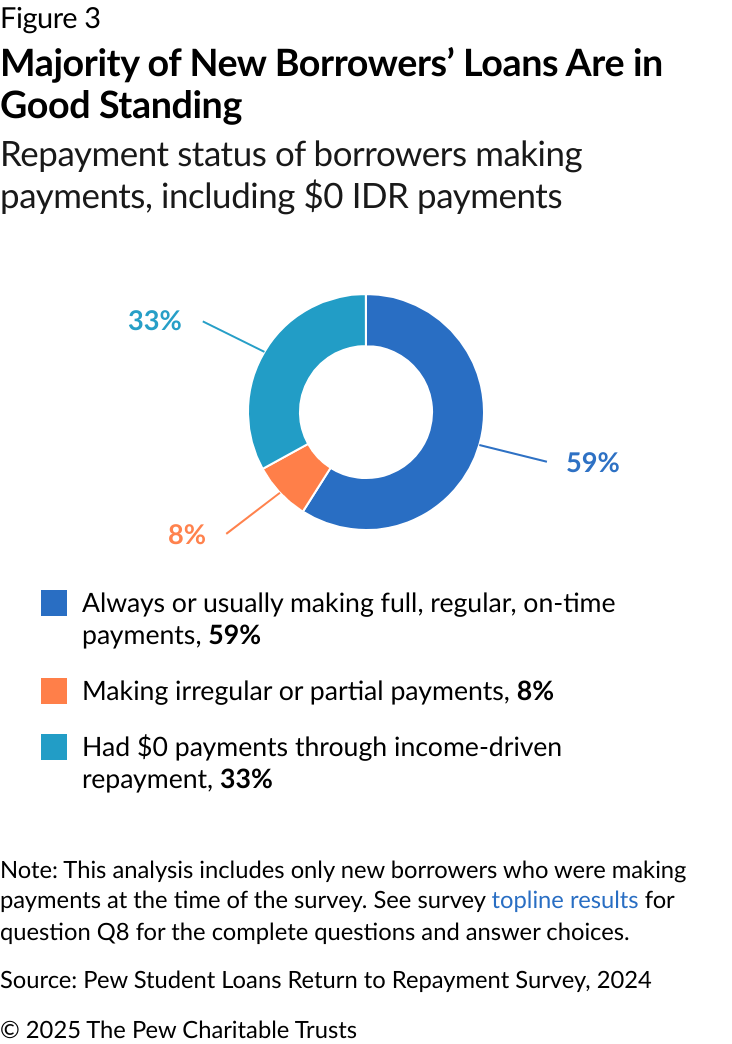
- Of new borrowers making payments, 59% were always or usually making full, regular, on-time payments; 8% were making irregular or partial payments; 33% had $0 payments through an income-driven repayment (IDR) plan. (See Figure 3.)
- More than two-thirds (68%) of new borrowers are aware of IDR. Of those aware of IDR, nearly two-thirds (61%) are enrolled in an IDR plan.4
Financial status and affordability
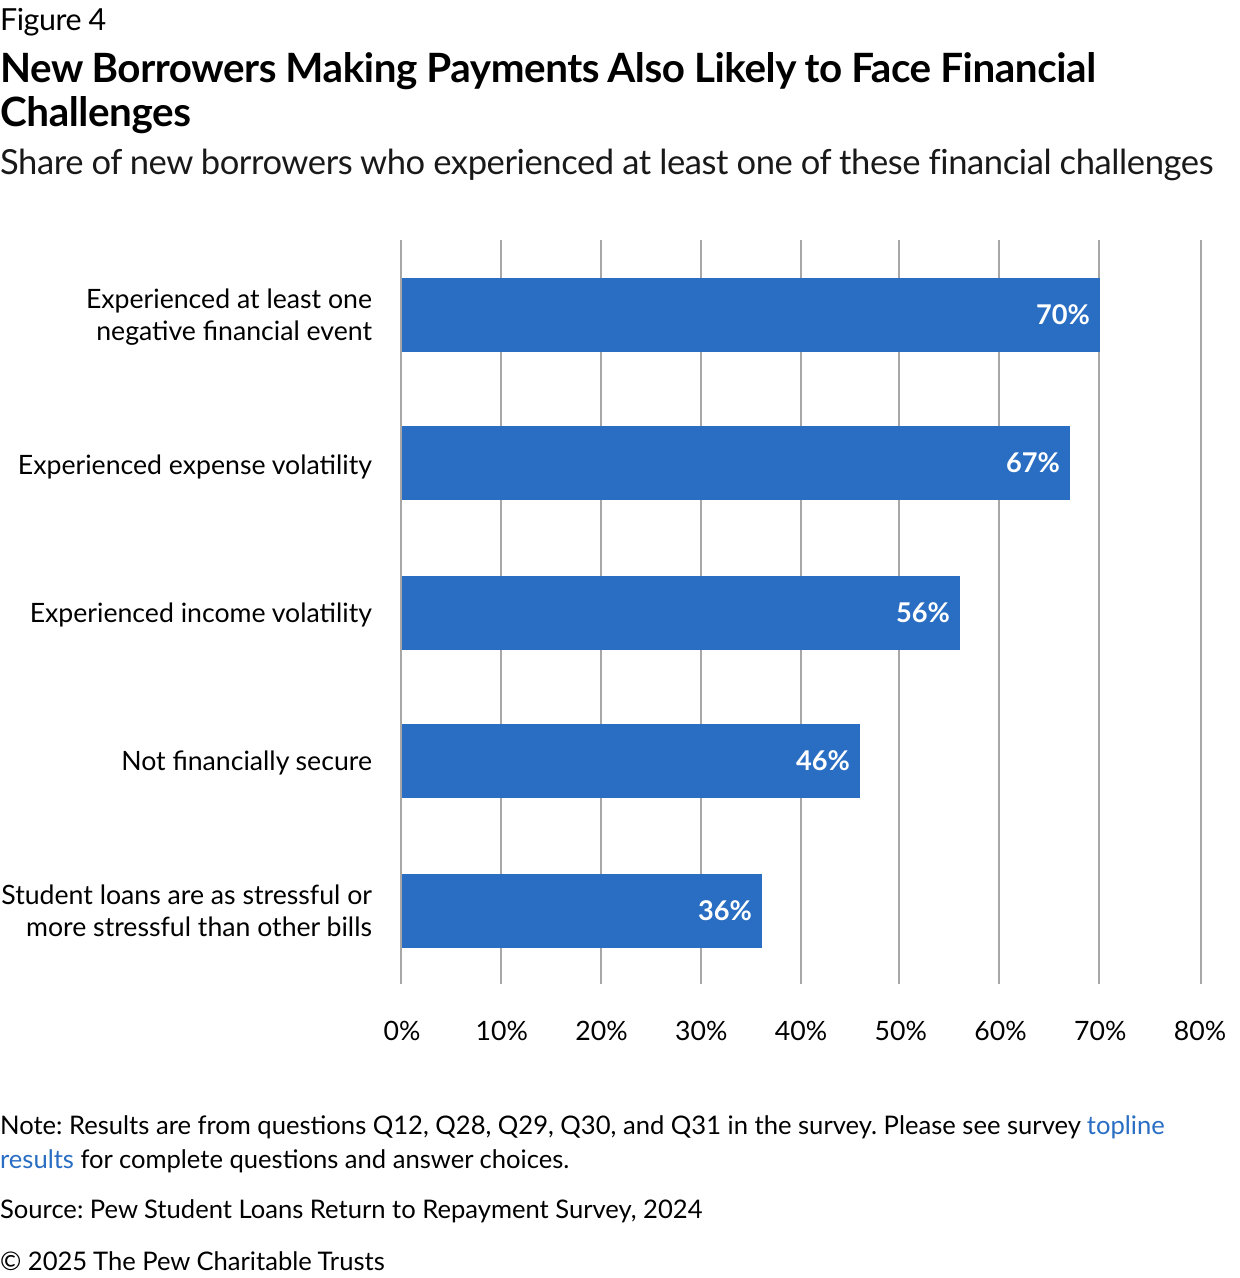
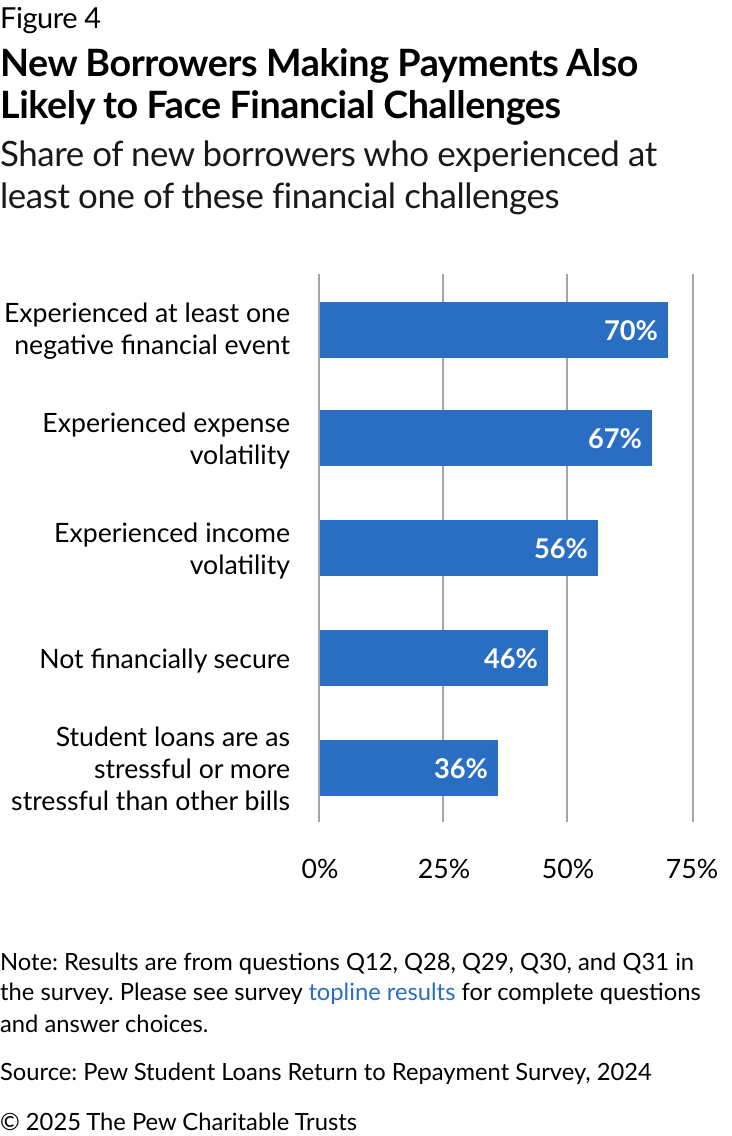
While most new borrowers are caught up on their monthly payments, the survey results also highlight that some simultaneously faced financial challenges—volatile incomes, unexpected expenses, and hardship events—that made it difficult to afford payments. Although their loans were in good standing, 52% of new borrowers said it was difficult to afford their monthly student loan payments, and 36% said their student loans were more stressful than other bills. (See Figure 4.) Some data from the survey can help contextualize the financial constraints new borrowers face:
- Nearly one-half (46%) of new borrowers who were making payments at the time of the survey said they were not financially secure.
- Over one-half (56%) said their income varied from month to month in the 12 months preceding the survey.
- Two-thirds (67%) experienced some degree of expense volatility, meaning that their monthly expenses had varied in the preceding 12 months.
- When asked if they had experienced any hardships from a list of negative financial events in the previous 12 months, 70% of new borrowers said they had experienced at least one of the hardship events. Specifically:
- Nearly one-half (46%) reported they skipped paying another bill or paid another bill late (aside from their mortgage or rent) or delayed medical care or paying for medical expenses (42%).
- Over one-third had overdrawn their checking account (34%); applied or considered applying for public assistance programs (33%); skipped or reduced the size of meals or received or sought out free food (34%); or had their credit, debit, or prepaid card declined because it was over the limit or lacked sufficient funds (31%).
The survey findings overall suggest that although many new borrowers stay current on their loans, a substantial number struggle with financial constraints that may make it more challenging to afford payments. Because these borrowers have been engaging with the repayment system for only one year, it will be necessary to continue monitoring their repayment trends to identify what support they will need to remain actively engaged and be successful in repayment.
Methodology
Interviews were conducted online from May 30 to July 2, 2024, among 1,533 current nonstudent federal student loan borrowers (age 18 and older). Online interviews were conducted via the SSRS Opinion Panel as well as our partner probability panel, the Ipsos Knowledge Panel. The margin of error for total respondents is plus or minus 3.1 percentage points at the 95% confidence level. This means that in 95 out of every 100 samples drawn using the same methodology, estimated proportions based on the entire sample will be no more than 3.1 percentage points away from their true values in the population. For estimates smaller or larger than 50%, the margin of sampling error will be smaller. Margins of error will be larger for subgroups.
External reviewers
This fact sheet benefited from the valuable feedback and insights of Tia Caldwell, former senior policy analyst at New America, and Madison Weiss, senior policy analyst at The Center for American Progress. Although they reviewed drafts of the fact sheet, neither they nor their institutions necessarily endorse the brief’s findings or conclusions.
Endnotes
- “COVID-19 Emergency Relief and Federal Student Aid,” U.S. Department of Education, https://studentaid.gov/announcements-events/covid-19.
- Jordan Matsudaira and James Kvaal, “An Update on the First Months of the Return to Repayment,” U.S. Department of Education, 2024, https://web.archive.org/web/20241223033332/https:/blog.ed.gov/2024/04/an-update-on-the-first-months-of-the-return-to-repayment/.
- “Income-Driven Repayment Plans,” U.S. Department of Education, Federal Student Aid Office, https://studentaid.gov/manage-loans/repayment/plans/income-driven.
- "Income-Driven Repayment Plans,” U.S. Department of Education, Federal Student Aid Office.
People


