In Philadelphia’s Older Households, Many Are Longtime Homeowners
Despite growth in rentals among adults 65 and over, most of the city’s older households remain owner-occupied.

The population of older Americans is growing. And it is growing in Philadelphia, too, albeit more slowly than in the United States as a whole. As residents skew older, The Pew Charitable Trusts has conducted extensive research on adults age 65 and older in Philadelphia, first analyzing the city’s older population in comparison with 17 peer U.S. cities, and then exploring the income sources of older Philadelphians.

This analysis explores the housing situations among older Philadelphia households—where the “householder” (the person who rents or owns the unit) is at least 65 years old. That number grew by 26% from 2013 to 2023, with older households now making up 23% of all households in the city. As with the previous work, this research compares the city’s older adult population with that of the nine other most-populous cities in the United States and eight selected cities with more than 500,000 residents that have a share of older residents similar to Philadelphia’s. (For a full list of cities, see Figure 1 below.)
Overall, older households in Philadelphia tend to fall toward the middle of the comparison cities on issues such as homeownership and housing cost burden, even though older Philadelphians have lower income levels than those in the comparison cities, as highlighted in previous Pew research. These findings indicate a higher level of housing affordability and stability in Philadelphia compared with some of the higher-cost-of-living cities included in the comparison group, such as Los Angeles and New York. However, it is also important to consider that there might be disparities among subgroups based on income level, race, or other factors that could not be analyzed because of data constraints. This analysis did highlight a meaningful difference in housing cost-burden prevalence between older owners and renters in Philadelphia.
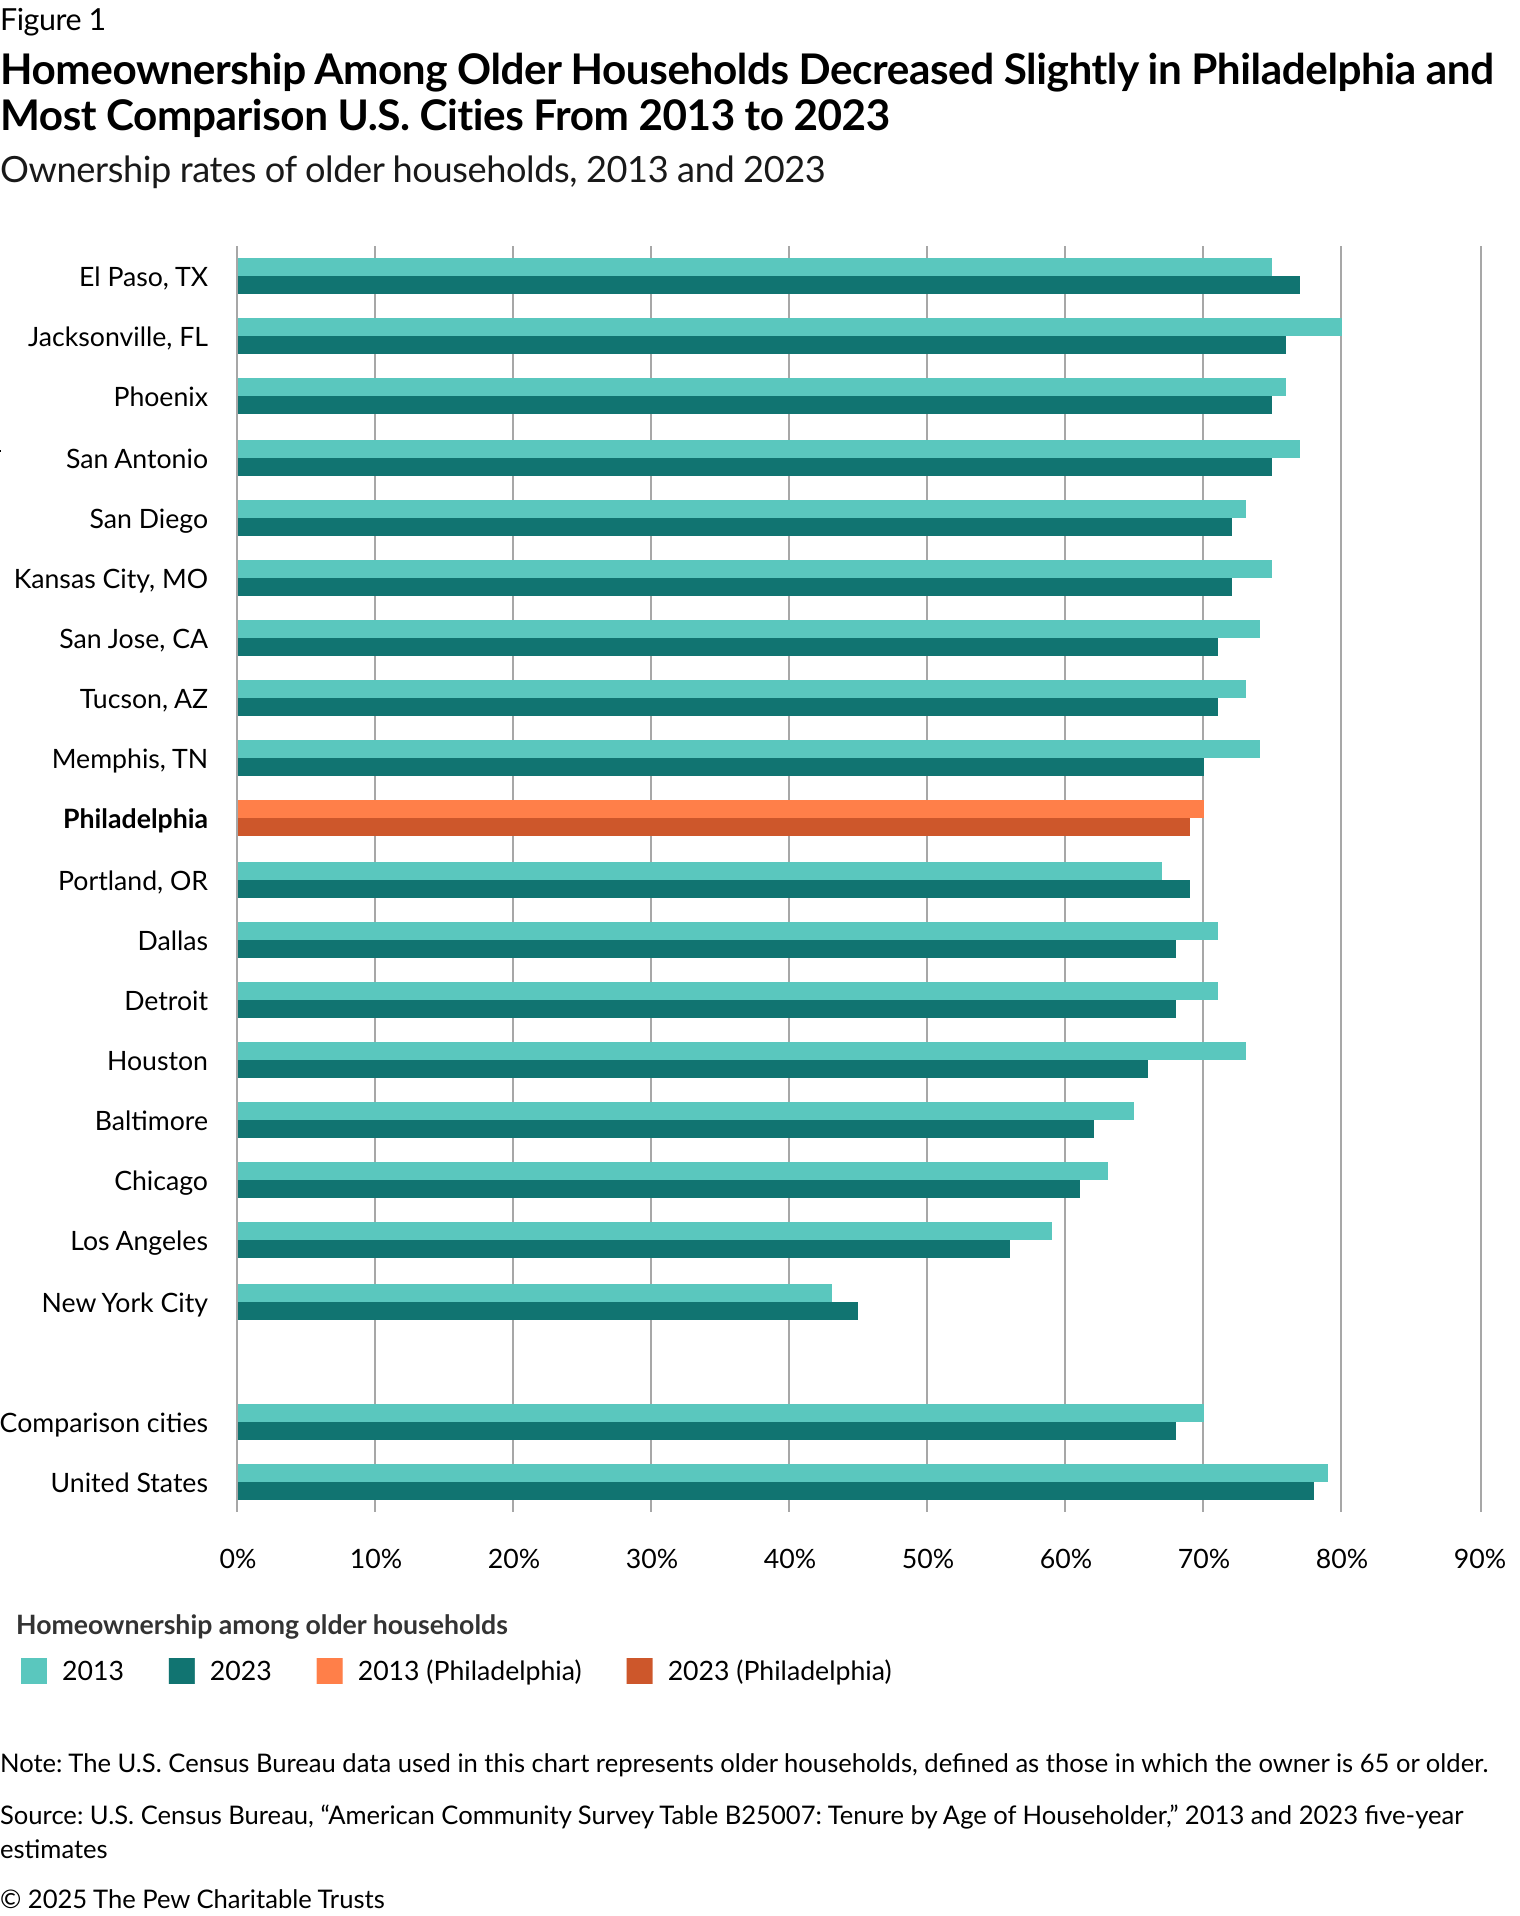
Older renters increased from 2013 to 2023, but the majority of older households were still owner-occupied
The number of older renter households in Philadelphia increased at a slightly higher rate than older owner-occupied households from 2013 to 2023 (30% growth among renters, compared with 24% growth in the number of owner-occupied homes). But a large majority of older Philadelphia households were owner-occupied in 2023, down just 1 percentage point from 2013.

In 2023, the ownership rate among older households was 69% in Philadelphia, 68% across comparison cities, and 78% in the United States overall. Most of the comparison cities experienced changes similar to Philadelphia’s, with a small shift toward renting. Only three cities among the 18 experienced an increase in the share of older households that were owner-occupied: El Paso, Texas; New York City; and Portland, Oregon. (See Figure 1.) Philadelphia’s middle-ranking homeownership rate among older households—despite its older residents having some of the lowest incomes among the cities previously analyzed—suggests a certain level of affordable housing in the city; however, more research would be needed to determine if homeownership and affordability vary among subgroups of older populations.
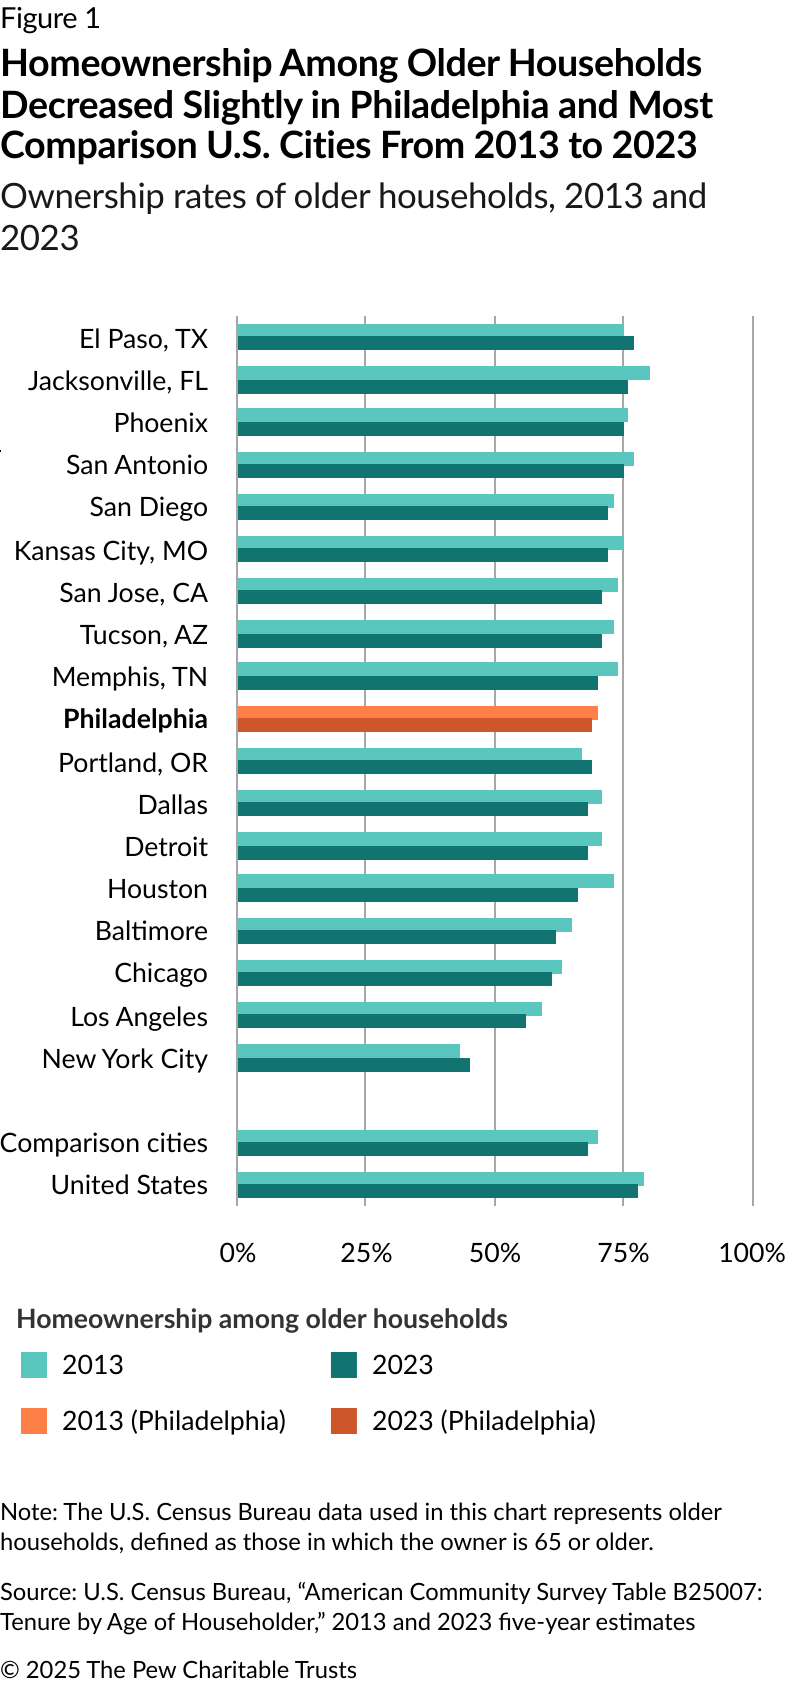
Nearly 40% of older households in Philadelphia experienced a housing cost burden in 2023

Households that spend more than 30% of their income on housing are considered by the Department of Housing and Urban Development to be housing cost-burdened. In general, even though older households are usually more income-constrained than younger households (those in which the householder is below age 65), the rates of housing cost burden in 2023 were similar in older and younger households.
The proportion of older households that were housing cost-burdened in 2023 ranged from a low of 32% in San Antonio to a high of 51% in Los Angeles. At 39%, Philadelphia’s share of cost-burdened older households was exactly average among the 18 comparison cities. But nationwide, a smaller percentage of older households (32%) were cost-burdened, the result of high housing costs in U.S. cities compared with other areas. (See Figure 2.)
Although Figure 2 examines the housing cost burden among renter- and owner-occupied households combined, Pew’s research found a meaningful difference between cost burden levels in owner- and renter-occupied households in Philadelphia. The rate of housing cost burden for homeowning older households was 31% compared with a far higher 57% for older renting households.
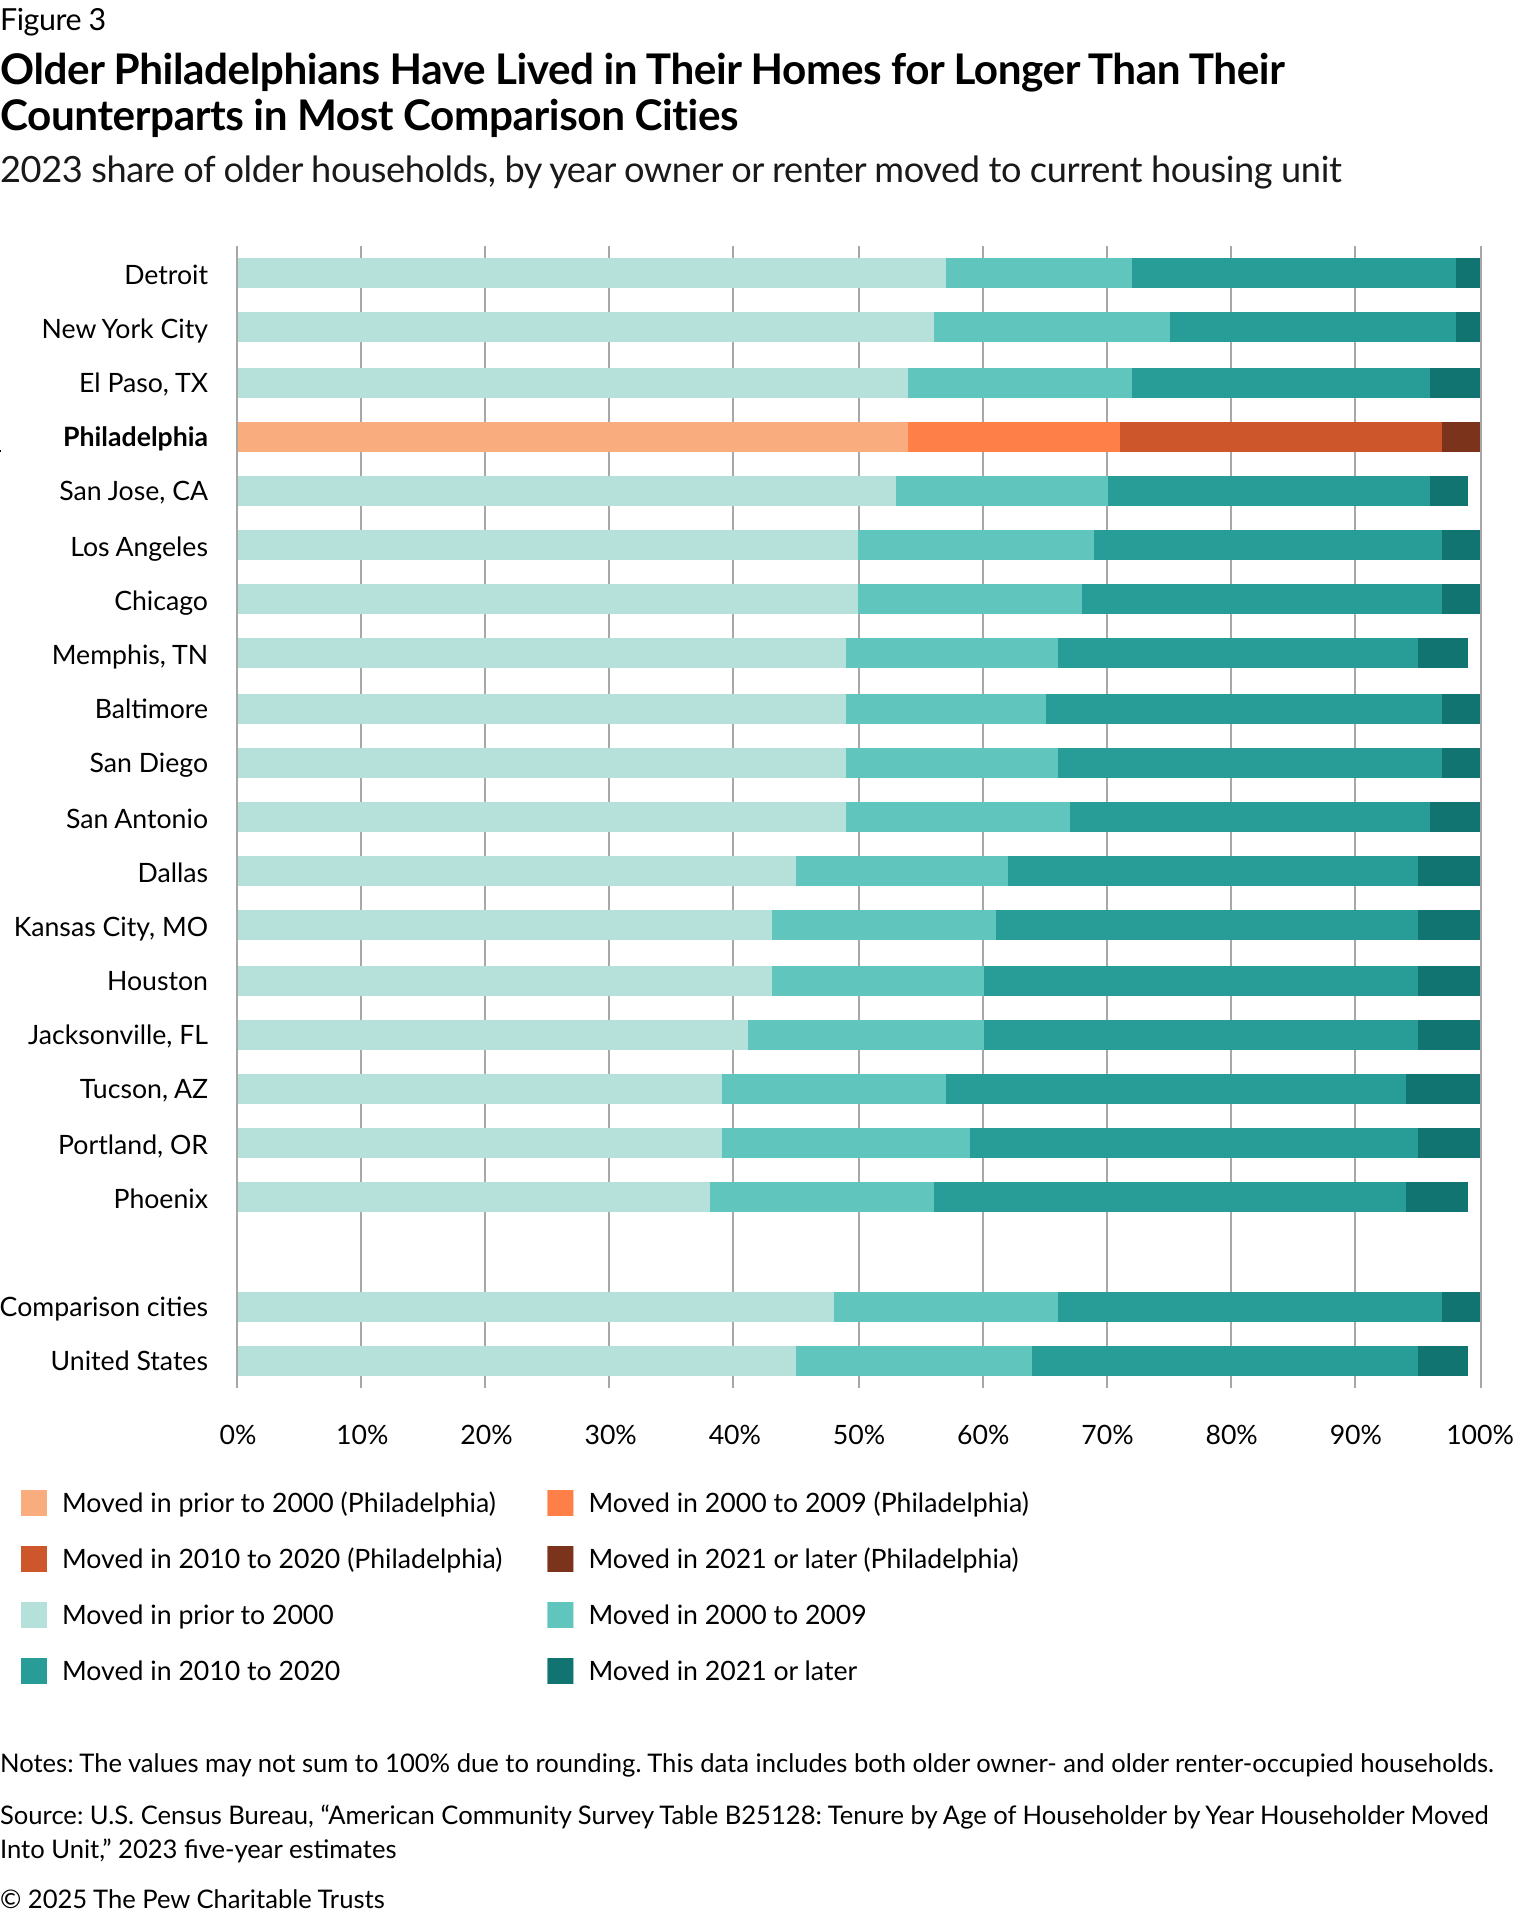
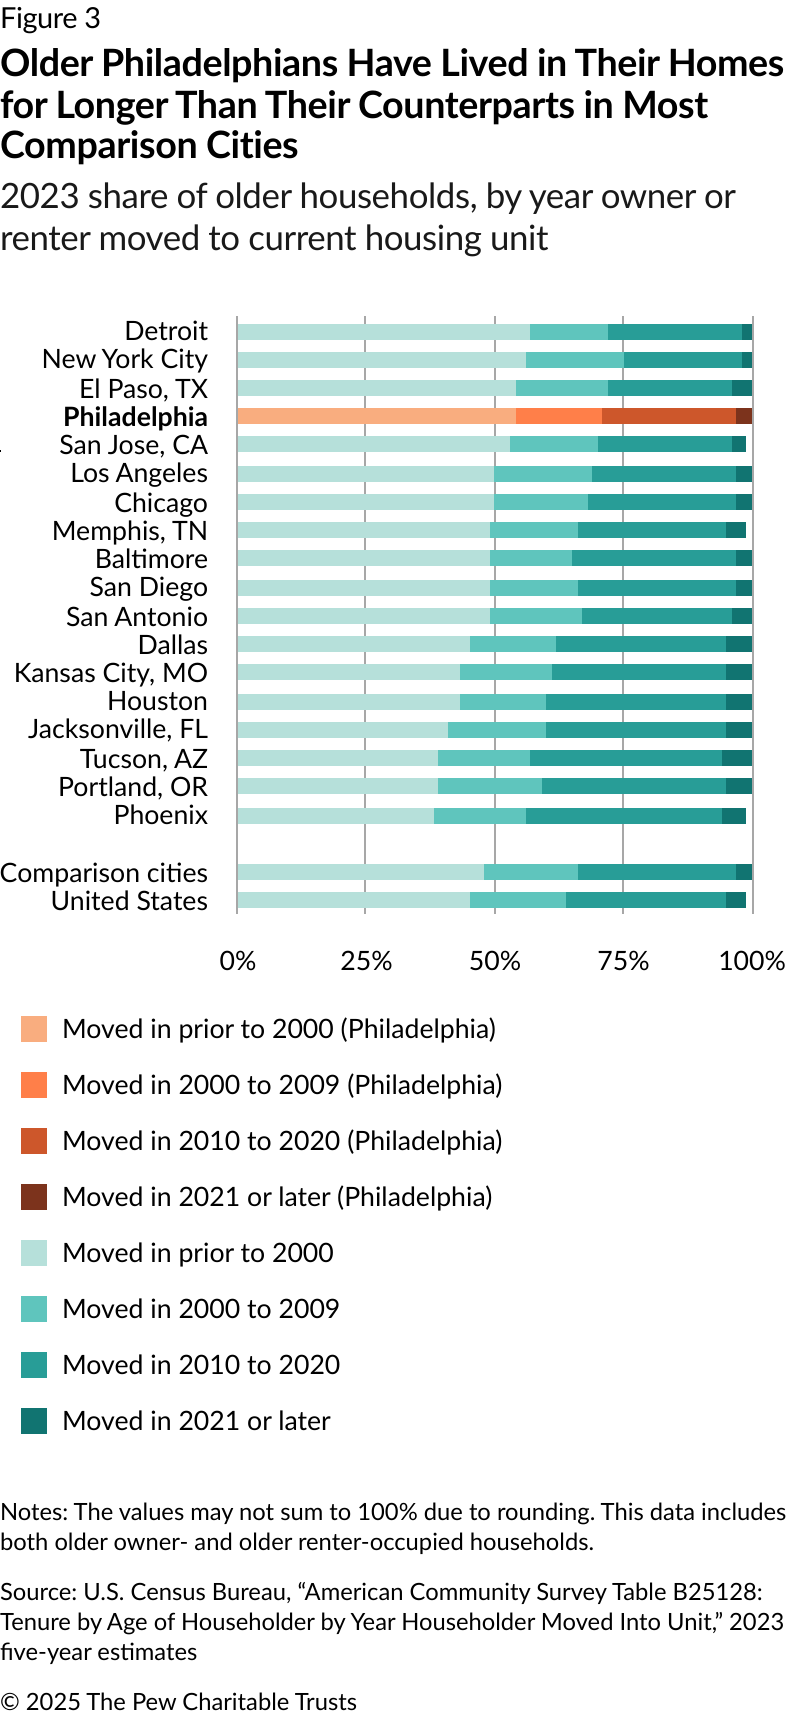
Older Philadelphians have lived in their homes longer than older residents in most comparison cities
Philadelphians in more than half of the city’s older households (54% of owners and renters combined) had lived in their current homes for more than 23 years—since before the turn of the 21st century. The cities with the lowest share of long-term resident older households were in the South and West. (See Figure 3.) These cities also had higher rates of growth in the overall population and growth in the population of older adults over the previous decade, according to Pew’s previous research.
Conclusion
Most of Philadelphia’s older households are occupied by longtime homeowners. Although previous research has shown that older adults in Philadelphia have lower incomes, on average, than their counterparts in many other cities, Philadelphia’s older households rank near the middle in terms of homeownership rates and the percentage of older households that experience a housing cost burden. These findings point to the relative affordability of housing in Philadelphia compared with many of the comparison cities.

However, it is important to consider the nuance that probably underlies this data for different subgroups of older households. Pew’s research found that a far higher portion of Philadelphia’s older renters were housing cost-burdened than older homeowners. Similarly, the broad citywide trends highlighted in this analysis probably differ from the experience of multigenerational households and households with different racial, ethnic, and income backgrounds. There is insufficient data to analyze these subgroups, necessitating the citywide perspective of this analysis. Further research could highlight key differences among subgroups.
Alix Sullivan is a senior officer and Jun Ho Phue is a senior associate with The Pew Charitable Trusts’ Philadelphia research and policy initiative.
People


