People With Disabilities Are More Likely Than Those Without to Have Court Experience
National poll is the first of its kind to capture this population’s experience and perspective on courts

Overview
Nearly half of adults with disabilities live in households in which someone has been involved in a court case, according to a recent national poll by The Pew Charitable Trusts. This is the first known data on the prevalence of this population’s court interaction, which is significantly higher than for those without disabilities.1 It also showed that people with disabilities found the courts difficult to navigate and rated the courts less favorably than those without disabilities.

The poll, administered by the public opinion polling firm SSRS, was designed to learn how people in the U.S. engage with and view state and local courts in their communities. It included the perspectives of adults with disabilities—both with and without court experience.2 The findings offer court leaders insights into courts’ performance, technology adoption, and navigability as they seek to modernize access and build trust with this community.3 They also underscore the importance of understanding the perspectives and experiences of distinct demographic populations to ensure that modernization efforts reflect the needs and realities of all groups served by the courts.
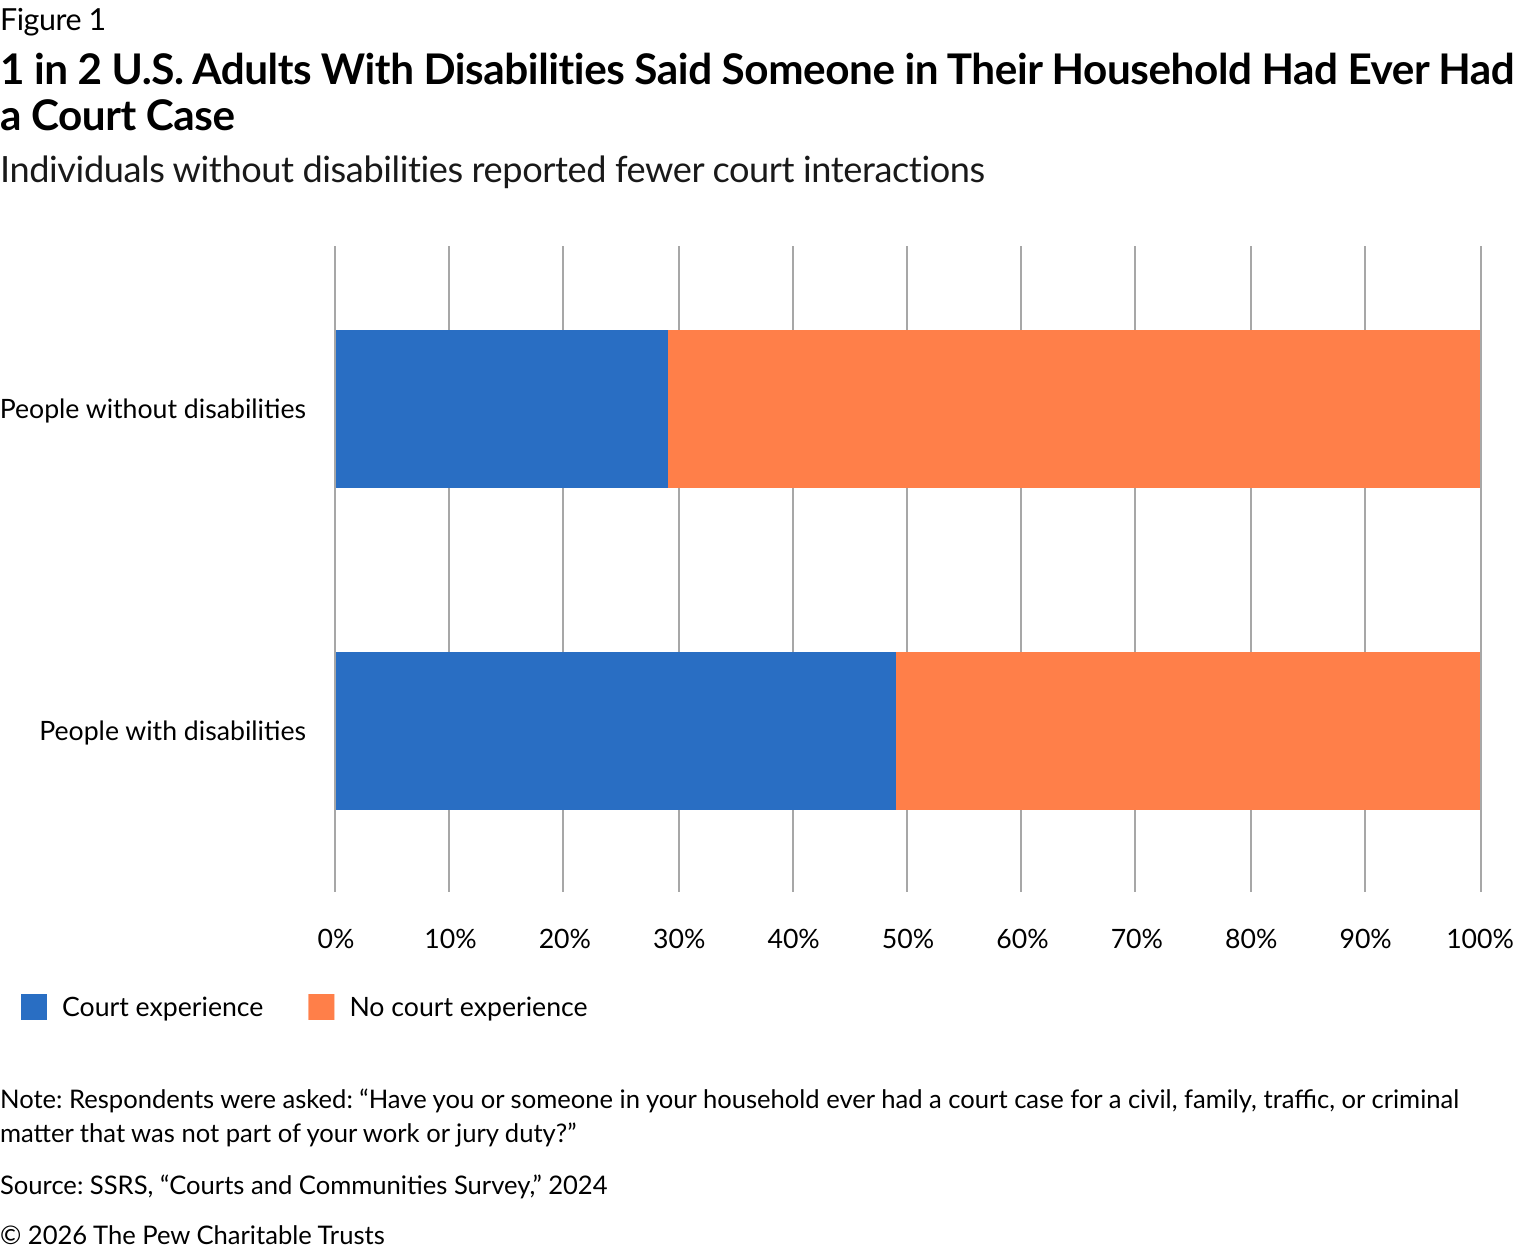
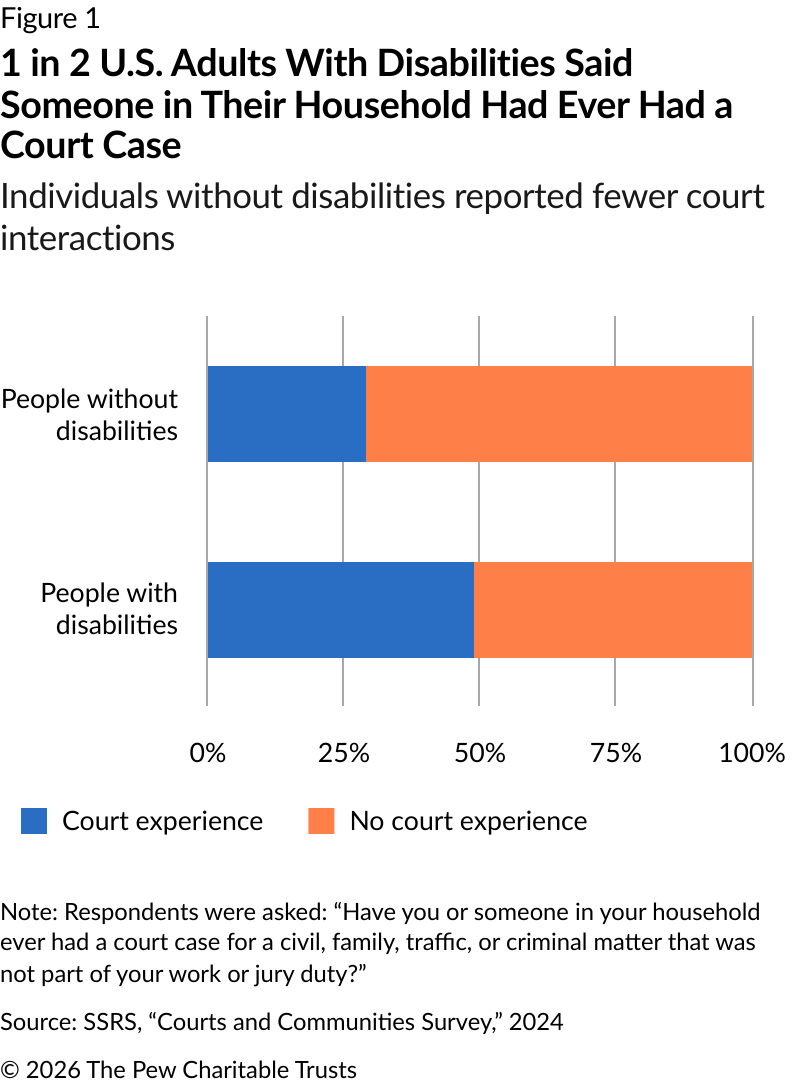
The prevalence of people with disabilities whose households have had a court case is high
Nearly 1 in 2 U.S. adults with disabilities (49%) live in households in which someone has had a court case for a civil, criminal, family, or traffic matter. This is substantially higher than the rate for adults without disabilities (29%). Overall, adults with disabilities make up approximately 30% of the general population.4
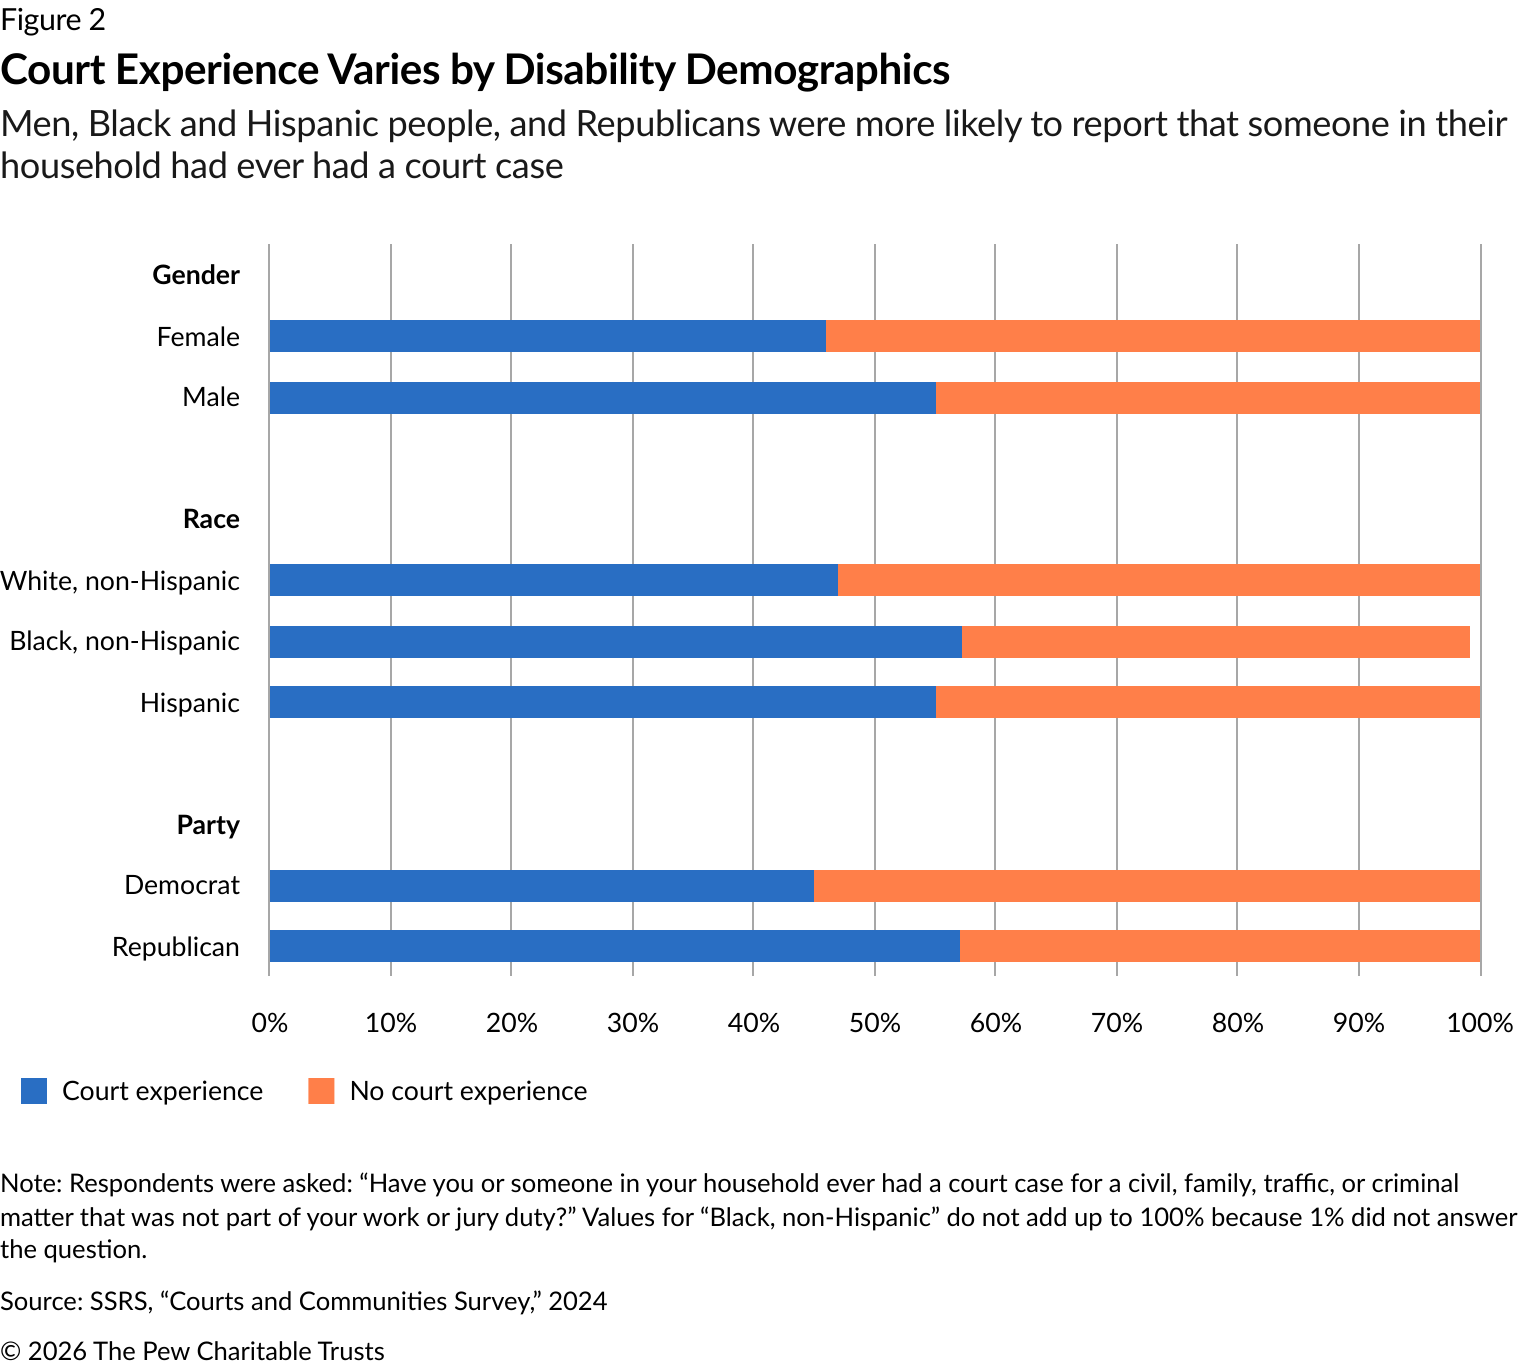
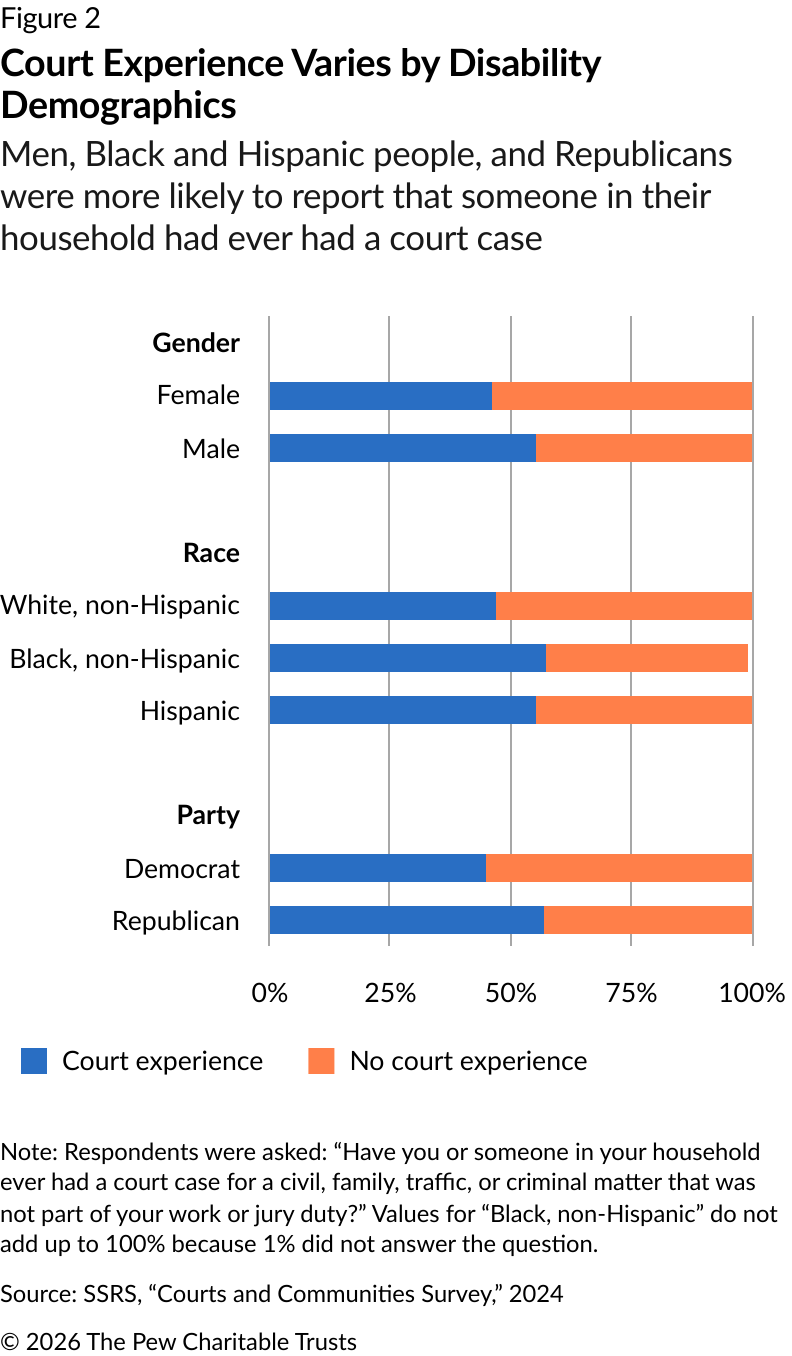
Responses varied demographically among those with disabilities. Men reported court involvement at higher rates than women (55% versus 46%). Black and Hispanic respondents were more likely to report having court experience—57% and 55%, respectively—than White respondents (47%). And Republicans were more likely than Democrats to report having court experience (57% versus 45%).
Adults with disabilities rated the courts less favorably than those without
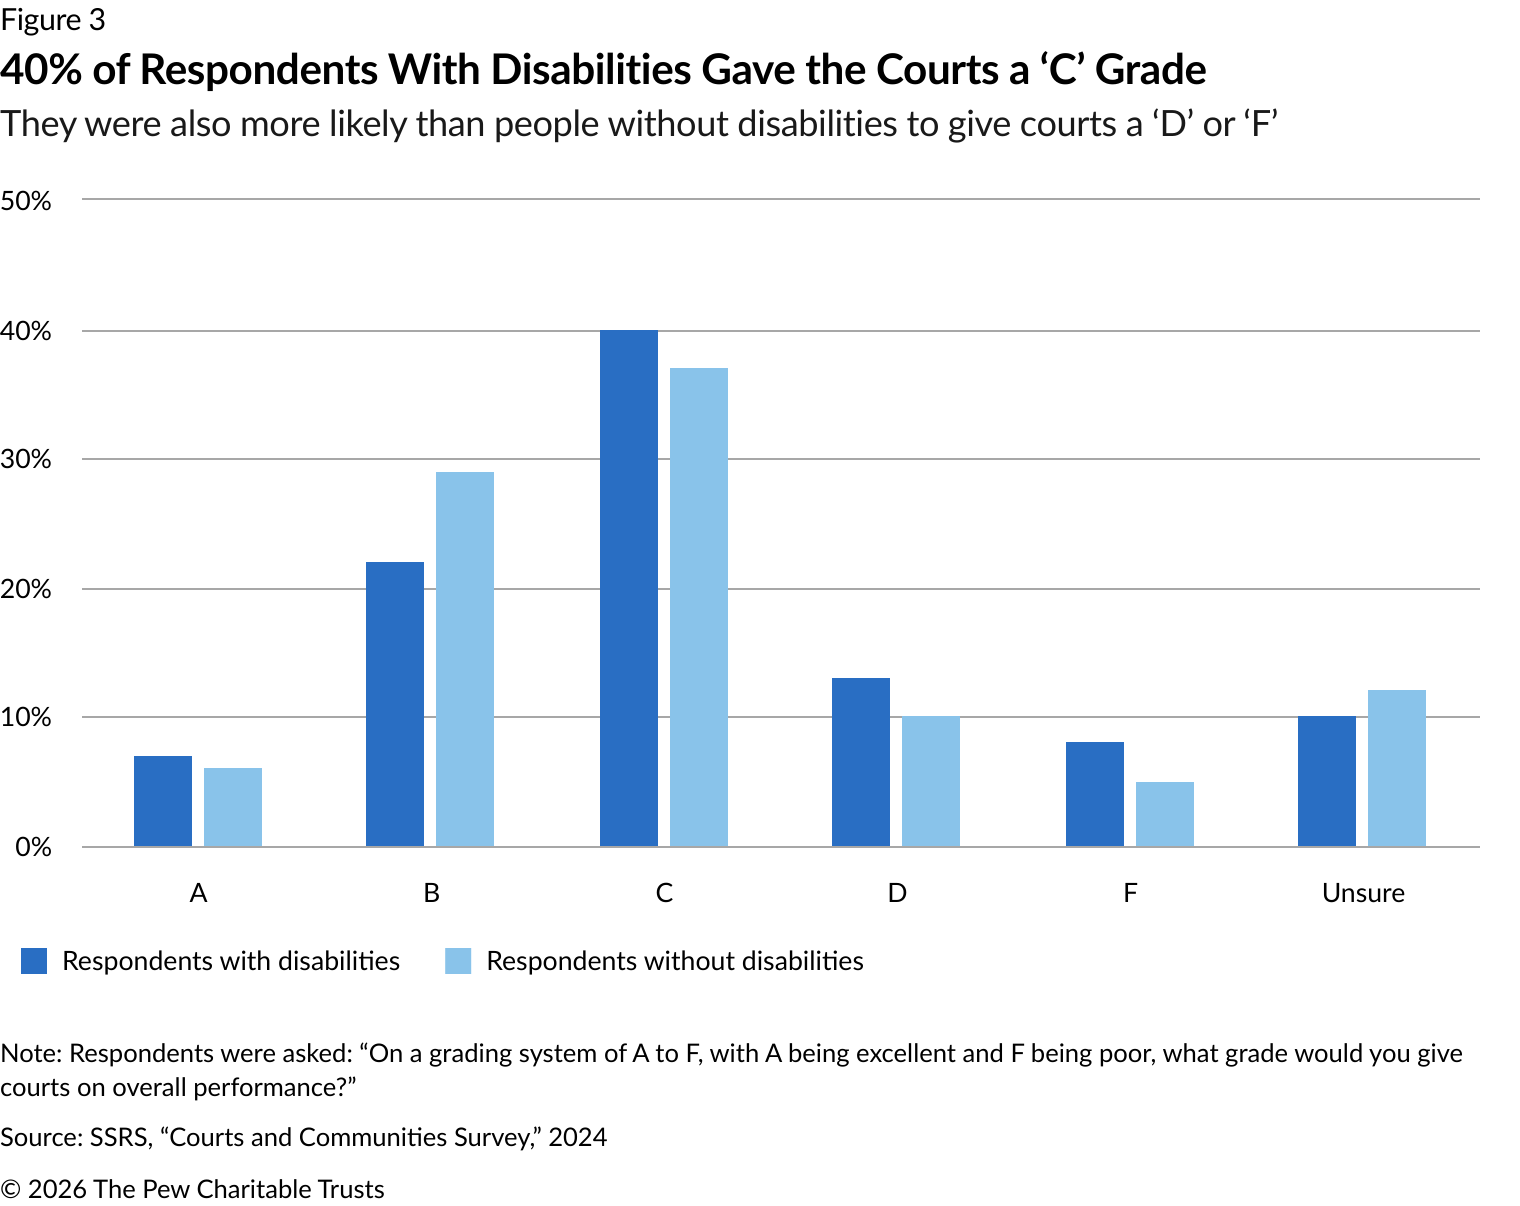
More respondents with disabilities—regardless of court experience—gave the courts a grade of “C” (40%) than any other grade; this was slightly higher than adults without disabilities (37%).
Just 29% of those with disabilities gave courts an “A” or “B” grade, compared with 35% of those without disabilities. Meanwhile, 21% of respondents with disabilities gave a “D” or “F” grade, higher than the 15% of respondents without disabilities who did the same.
Adults with disabilities also reported lower confidence in court fairness. While the majority (63%) expressed confidence that the courts in their community treat people fairly, regardless of whether they have a disability, this is notably lower than the confidence expressed by adults without disabilities (73%).
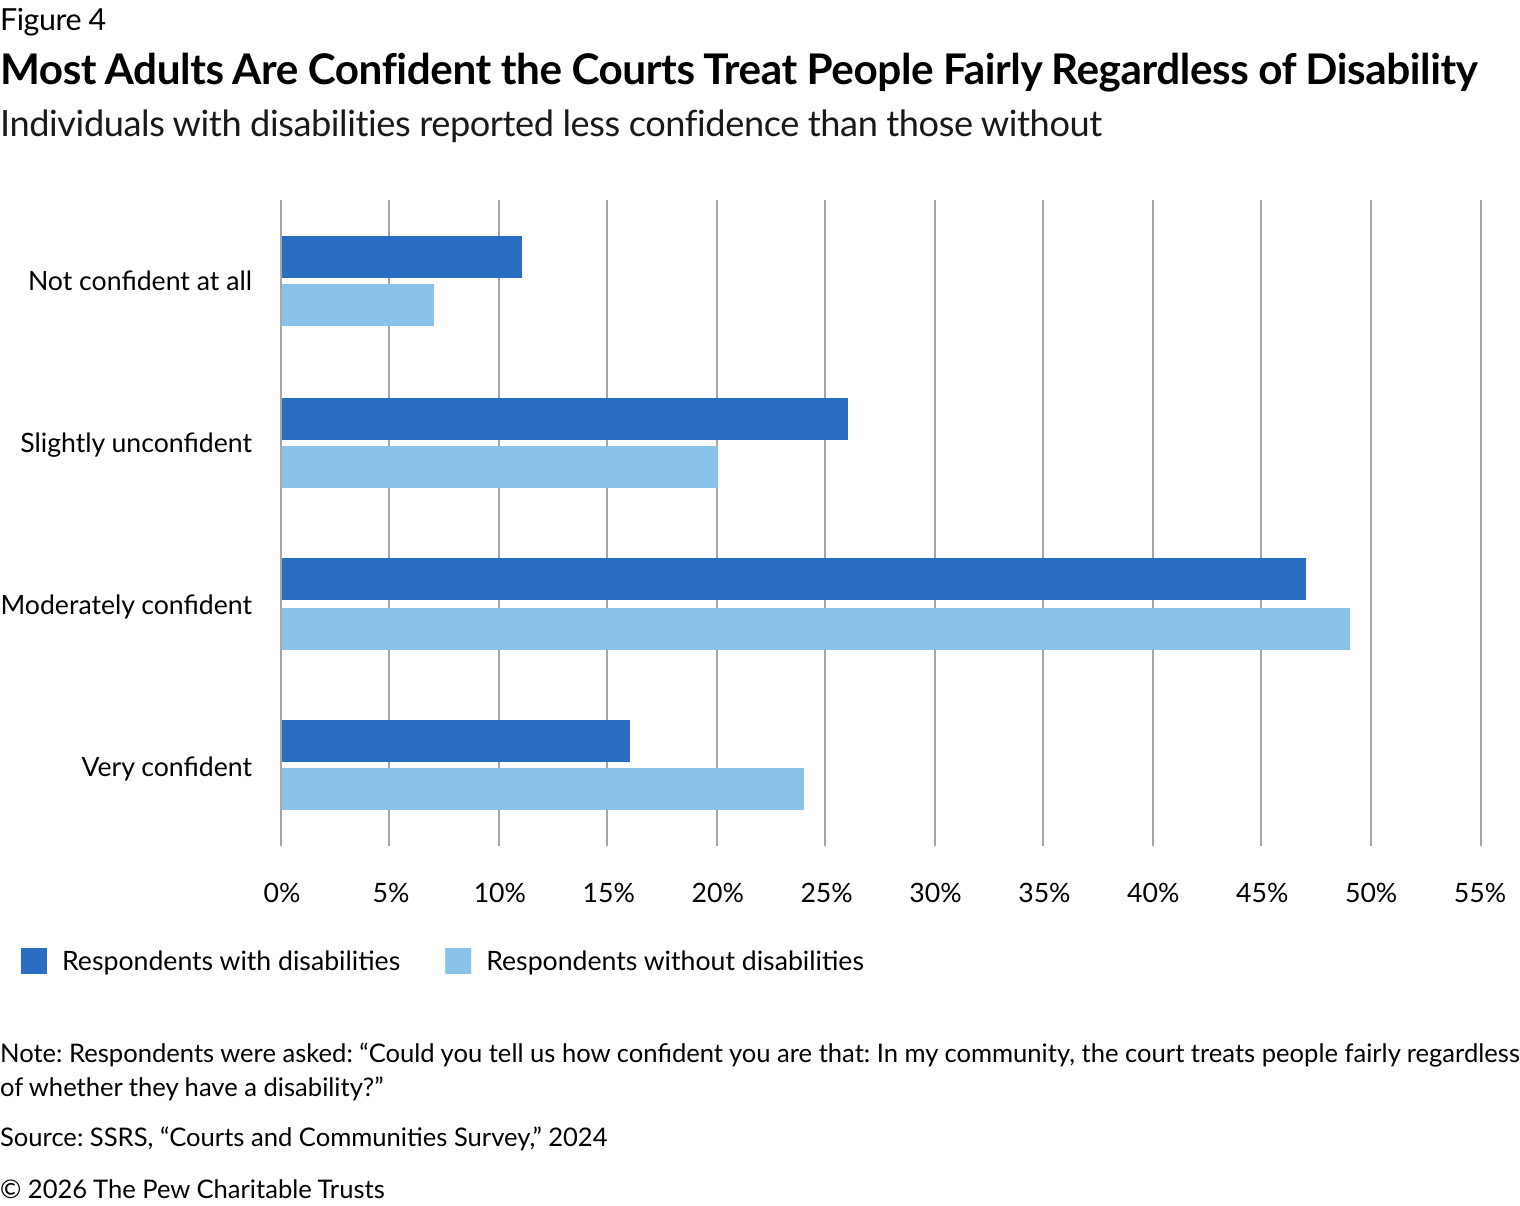
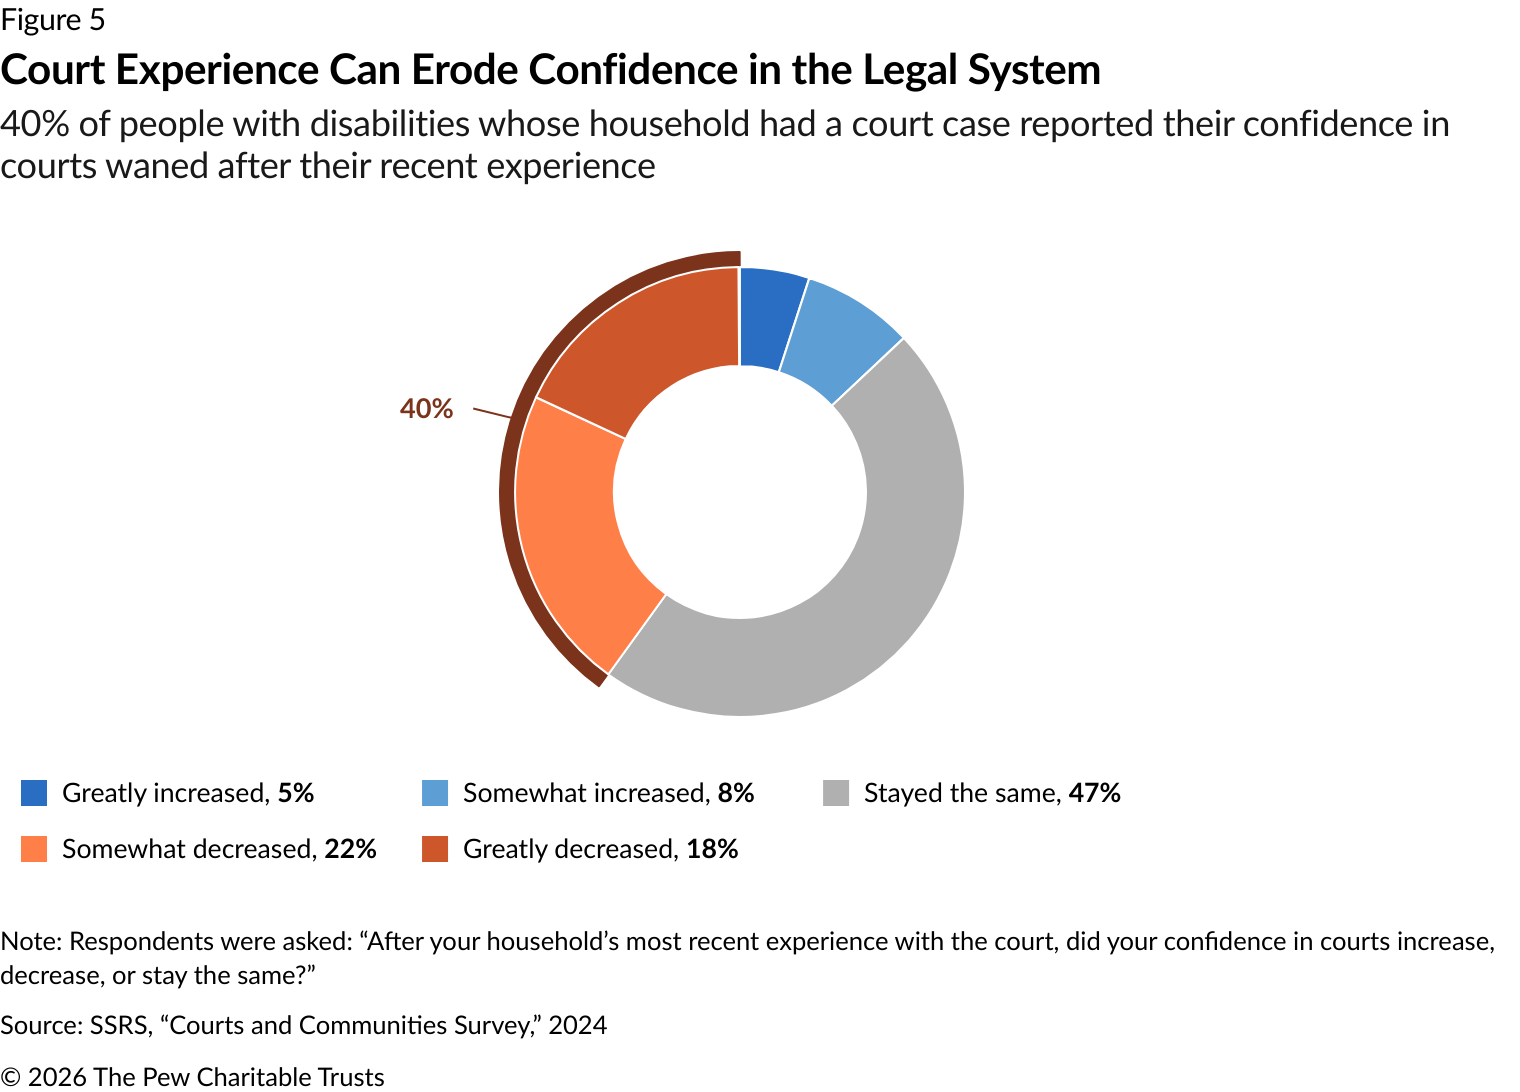
Going to court also affected confidence in the system, with 40% of people with disabilities reporting that it somewhat or greatly decreased after their recent court experience. Thirteen percent said their confidence somewhat or greatly increased.5
Adults with disabilities had less favorable views of courts' adoption of technology
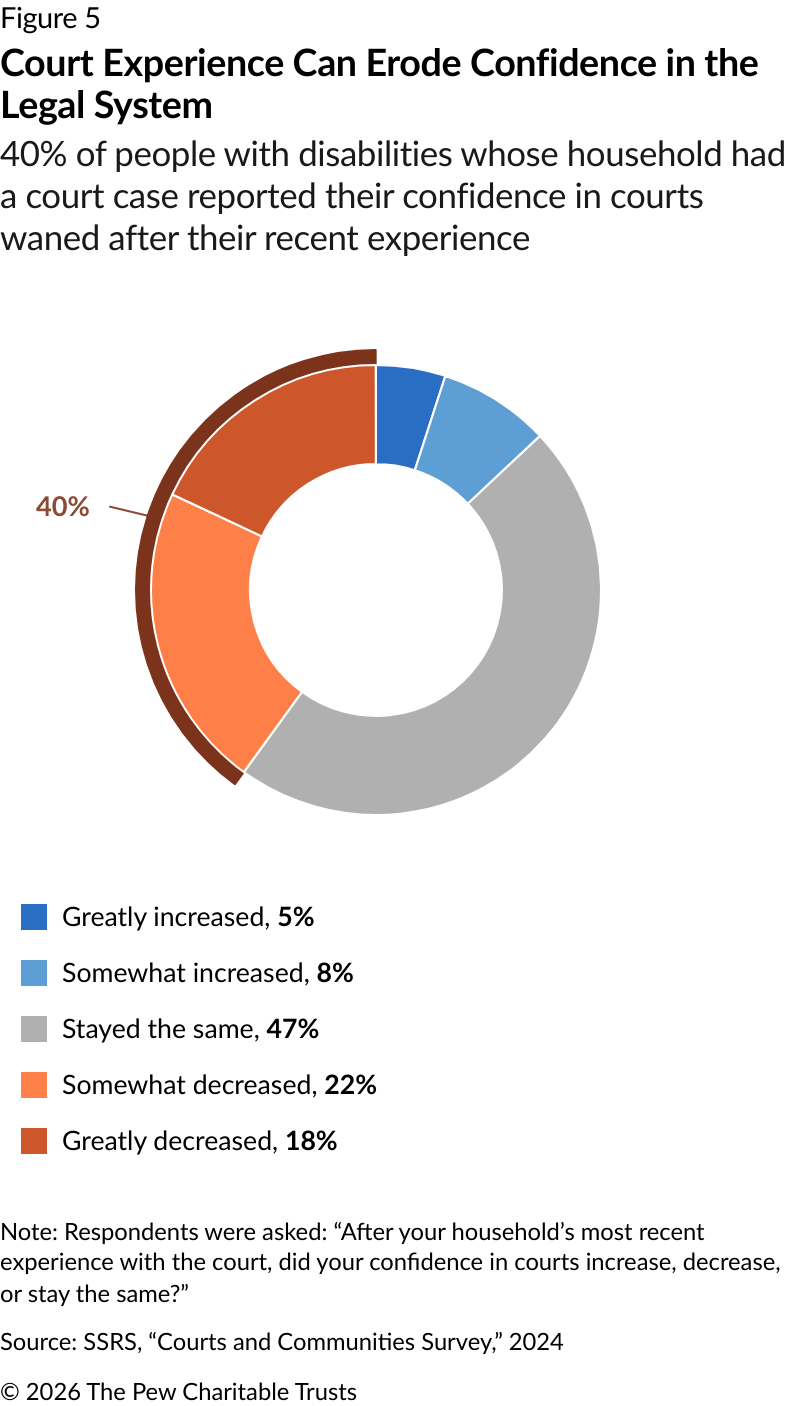
People with disabilities (57%)—who often rely on technology for access, such as video or teleconferencing, closed captions, voice recognition software, wayfinding tools, and sensor-activated equipment—were more likely than people without disabilities (49%) to rate courts’ ability to adopt and use new technologies as fair or poor.6
Flexibility is key when it comes to court accessibility, since there is no one-size-fits-all solution to providing access. When asked about their views on appearing in court virtually or in person, nearly 65% of adults with disabilities said that courts should allow people to choose to appear in court virtually for most case types, expressing a slightly stronger leaning toward this view than people without disabilities (59%).
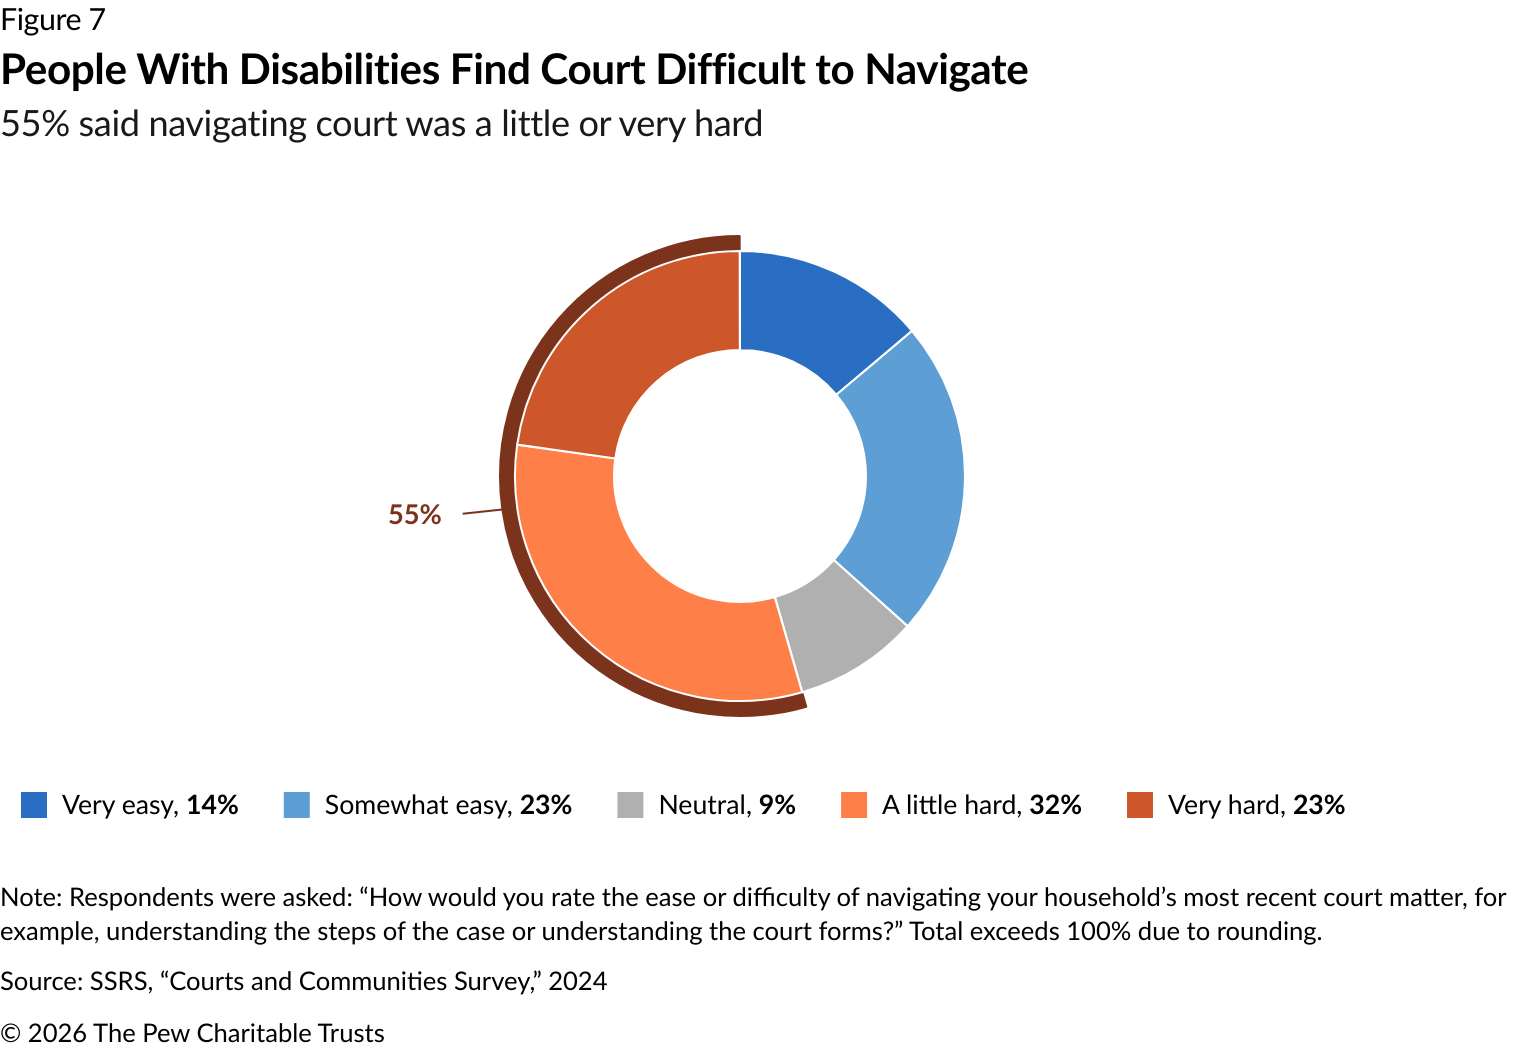
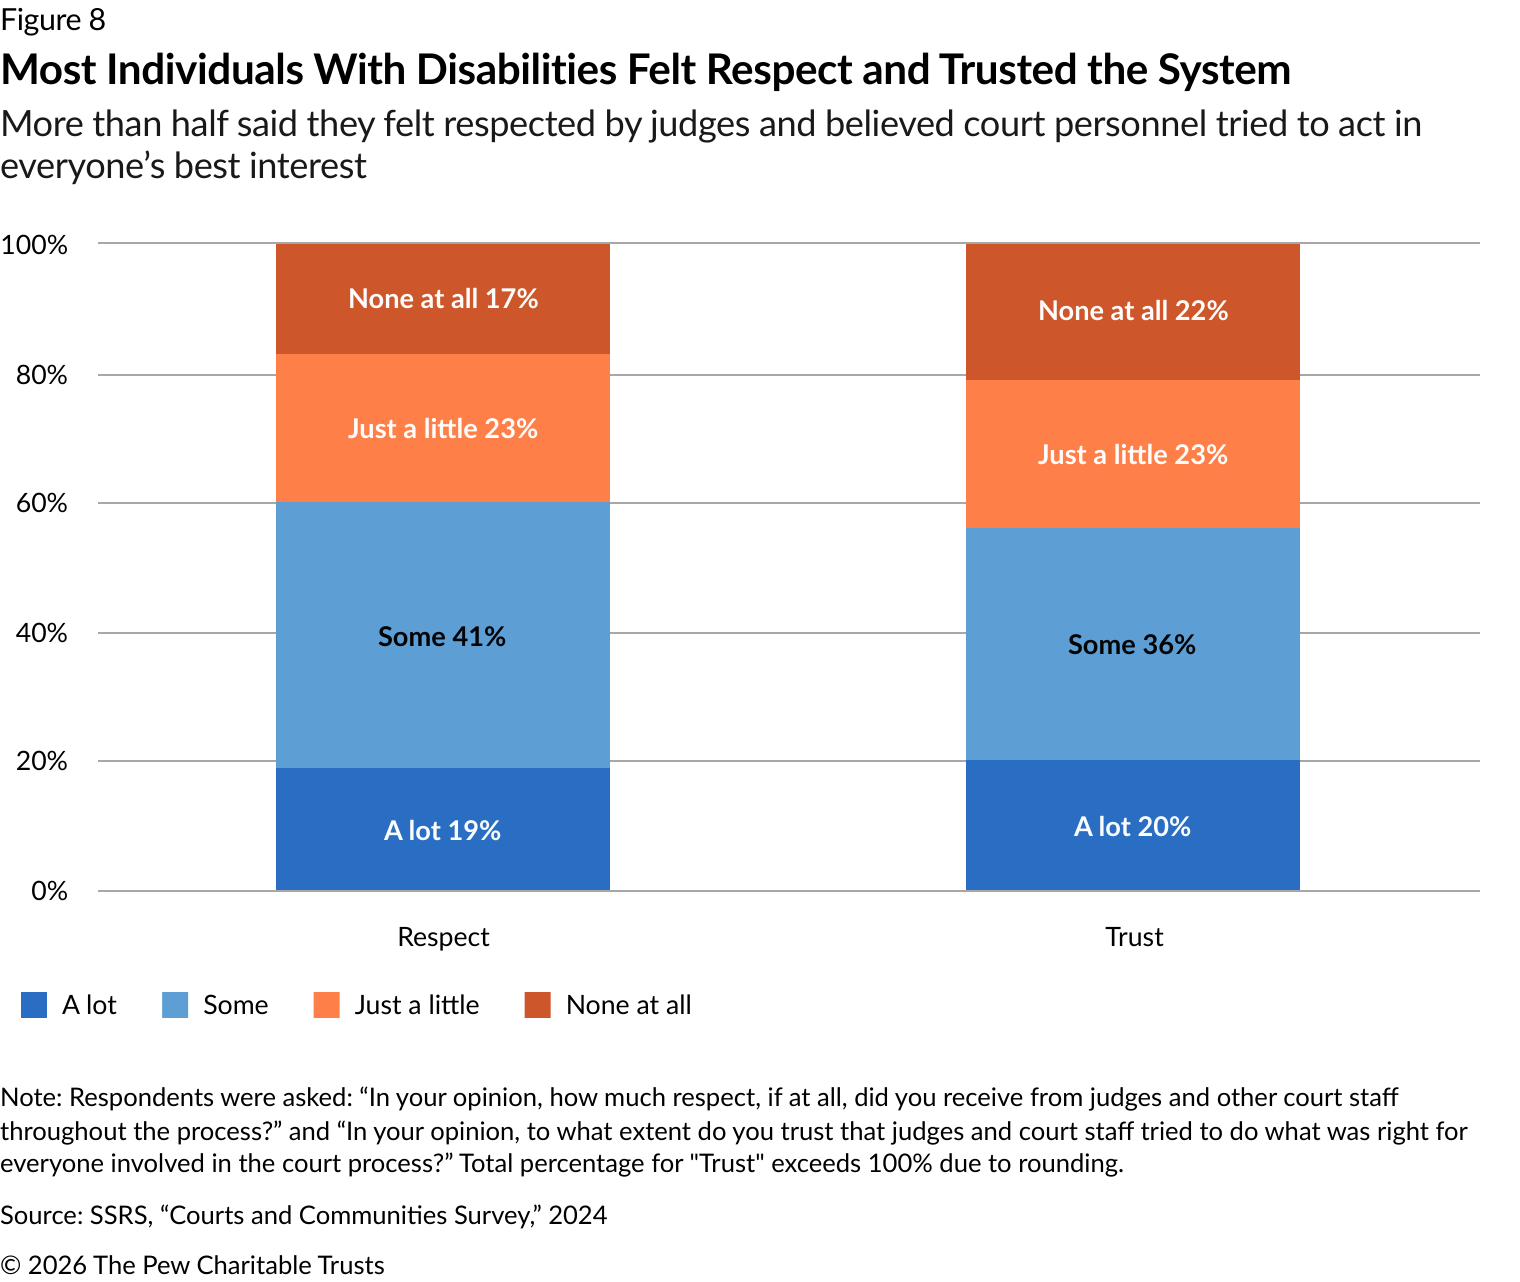
Most adults with disabilities who had court experience found court difficult to navigate
Most adults with disabilities whose household had a court case—55%—reported that court was difficult to navigate, including understanding case steps or forms.7
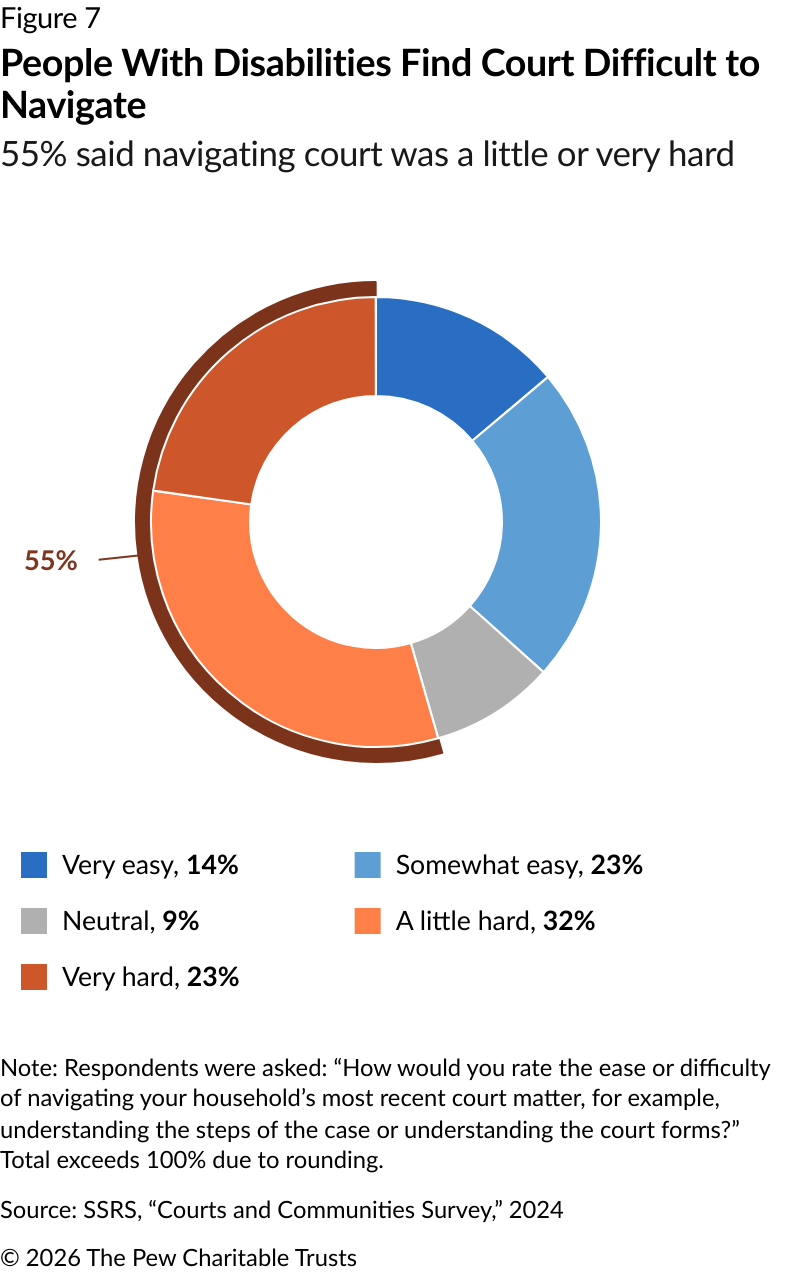
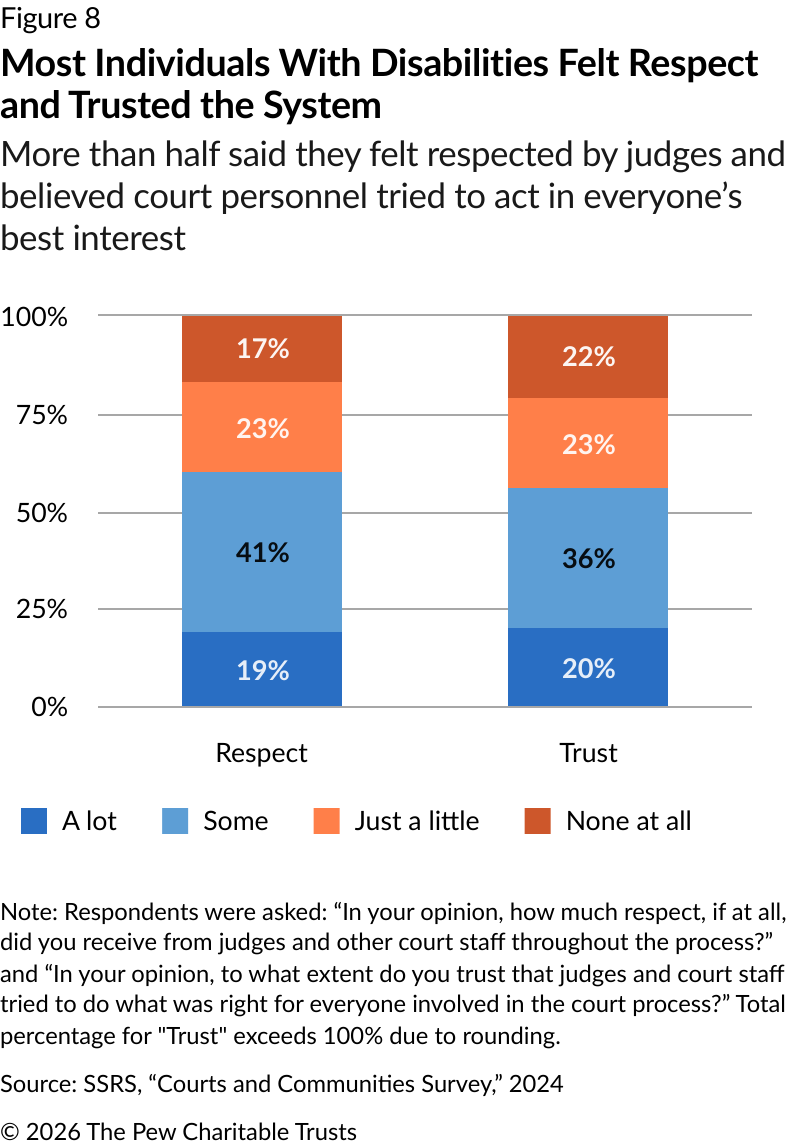
Despite the effect that court experience had on their confidence in the courts, 60% of disabled adults reported feeling some or a lot of respect from judges throughout the court process; and most—56%—reported trusting that the judges and court staff had tried to do what was right for everyone involved in the court process.8
Among people with disabilities who have had a court case, responses across demographic groups—such as race/ethnicity, gender, political party, and education—did not produce statistically significant results, possibly due to the sample size, and aren’t reported here. However, as research points to demographic differences in how people with disabilities experience parts of the justice system, these remain important factors to consider in future research on court perspectives and experiences.9
Court leaders can use these findings to strengthen accessibility efforts
People with disabilities often face attitudinal and accessibility barriers when engaging with state and local courts.10 This, coupled with their overrepresentation among households that have had a court case, underscores the importance for courts to ensure that this population can effectively navigate the system and fully participate in their cases.
Further research is needed to link these poll findings directly to attitudinal and accessibility barriers, and how these barriers may affect judicial outcomes. But the differences in responses between adults with disabilities and those without suggest that disability status may shape perceptions of courts, as well as experiences within those courts. As such, these findings offer court leaders insights to help guide accessibility and modernization efforts and to foster greater trust among people with disabilities and ensure equal justice for all.
Endnotes
- Some research has explored the rates at which U.S. adults with disabilities are represented in the prison system or have encountered civil legal issues, but not the prevalence of this population’s court interactions or perceptions of courts. See, for example, Laurin Bixby, Stacey Bevan, and Courtney Boen, “The Links Between Disability, Incarceration, and Social Exclusion,” Health Affairs 41, no. 10 (October 2022): https://www.healthaffairs.org/doi/10.1377/hlthaff.2022.00495. Legal Services Corporation, “The Justice Gap: The Unmet Civil Legal Needs of Low-Income Americans,” 2022, https://justicegap.lsc.gov/the-report/. Legal Services Corporation, “The Justice Gap: Measuring the Unmet Civil Legal Needs of Low-Income Americans,” 2017, https://www.lsc.gov/sites/default/files/images/TheJusticeGapFullReport.pdf. Katherine E.M. Miller et al., “Prevalence of Disability Among Older Adults in Prison,” JAMA Network Open 7, no. 12 (2024): e2452334, https://jamanetwork.com/journals/jamanetworkopen/fullarticle/2828503.
- Respondents were asked: “Do you identify as a person with a disability or other chronic condition? This could include, but is not limited to, attention deficit, autism, blind or visually impaired, deaf or hard of hearing, health-related disability, learning disability, mental health condition, mobility-related disability, or speech-related disability.”
- Resolution 5: Reaffirming the Commitment to Meaningful Access to Justice for All, Conference of Chief Justices and Conference of State Court Administrators, 2015, https://ccj.ncsc.org/libraries/mozilla-pdfjs/web/viewer.html?file=https://ccj.ncsc.org/sites/default/files/media/document/07252015-reaffirming-commitment-meaningful-access-to-justice-for-all.pdf. Resolution 2: In Support of Remote and Virtual Hearings, Conference of Chief Justices and Conference of State Court Administrators, 2021, https://ccj.ncsc.org/resources-courts/support-remote-and-virtual-hearings Resolution 2: In Support of Efforts to Improve Appearance Rates in Criminal and Traffic Courts, Conference of Chief Justices and Conference of State Court Administrators, 2022, https://ccj.ncsc.org/sites/default/files/media/document/07272022-Improve-Appearance-Rates-in-Courts.pdf.
- “Disability Status and Types,” Disability and Health Data System, Centers for Disease Control and Prevention, 2022, https://dhds.cdc.gov/SP.
- 31% of adults without disabilities reported that their confidence somewhat or greatly decreased after their recent court experience. However, when comparing these responses to those of adults with disabilities, the difference is not statistically significant at p < 0.1. This means any differences between the two groups in our sample may be due to random chance.
- See, for example, U.S. Access Board Courthouse Access Advisory Committee, “Justice for All: Designing Accessible Courthouses,” 2006, https://www.access-board.gov/ada/additional-resources/designing-accessible-courthouses.html. “Types of Assistive Technology Tools,” Missy Jensen, AudioEye, Feb. 8, 2025, https://www.audioeye.com/post/types-of-assistive-technologies/. Nick White, “Remote Mediation and Disability Report: Empirical Insights for the Maryland Judiciary and the Dispute Resolution Field,” Maryland Judiciary, https://www.courts.state.md.us/sites/default/files/import/macro/pdfs/remotemediationdisabillityreport.pdf. “Assistive Technology,” World Health Organization, Jan. 2, 2024, https://www.who.int/news-room/fact-sheets/detail/assistive-technology.
- 48% of adults without disabilities whose households have had a court case reported that court was difficult to navigate. However, when comparing these responses to those of adults with disabilities, the difference is not statistically significant at p < 0.1. This means any differences between the two groups in our sample may be due to random chance.
- 61% of adults without disabilities whose households have had a court case reported feeling some or a lot of respect from judges; 57% reported trusting that judges and court staff had tried to do what was right for everyone involved in the court process. However, when comparing these responses to those of adults with disabilities, the difference is not statistically significant at p < 0.1. This means any differences between the two groups in our sample may be due to random chance.
- Laura M. Maruschak, Jennifer Bronson, and Mariel Alper, “Survey of Prison Inmates, 2016: Disabilities Reported by Prisoners,” U.S. Department of Justice, Bureau of Justice Statistics, 2021, https://bjs.ojp.gov/library/publications/disabilities-reported-prisoners-surveyprison-inmates-2016. Erin J. McCauley, “The Cumulative Probability of Arrest by Age 28 Years in the United States by Disability Status, Race/Ethnicity, and Gender,” American Journal of Public Health 107, no. 12 (December 2017): 1977-81, https://pmc.ncbi.nlm.nih.gov/articles/PMC5678390/. Katherine E. M. Miller et al., “Prevalence of Disability Among Older Adults in Prison.” Alina I. Palimaru, Allyson D. Gittens, and Stephanie Brooks Holliday, “Intellectual, Developmental, and Physical Disabilities in U.S. Legal Settings: Perspectives From People With Relevant Experience,” RAND, 2023, https://www.rand.org/pubs/research_reports/RRA2880-3.html.
- Rachel Kahn Best et al., “Disputed and Disfavored: Pain, Mental Illness, and Invisible Conditions in Disability Discrimination Cases,” Social Science & Medicine 371 (April 2025): 117885, https://www.sciencedirect.com/science/article/pii/S027795362500214X?via%3Dihub. Katherine E. M. Miller et al., “Prevalence of Disability Among Older Adults in Prison.” Alina I. Palimaru, Allyson D. Gittens, and Stephanie Brooks Holliday, “Intellectual, Developmental, and Physical Disabilities in U.S. Legal Settings.”
People


