Pew Poll: Philadelphians Concerned About Public Safety and Financial Well-Being
Residents’ views on the city have improved, but crime, poverty, and affordability remain top worries

Editor’s note: The polling toplines were updated July 8, 2025, to correct the margin of error and to include the sample of 111 phone completions of the survey in the list of survey responses.
Overview
Philadelphians’ views of their city have improved dramatically since the height of the COVID-19 pandemic in 2022, despite lingering concern about public safety and personal finances. In a Pew survey conducted from January to March 2025, nearly two-thirds of respondents cited crime as the top issue facing the city. Half of those surveyed reported hearing gunshots in their neighborhood in the previous year.
Philadelphians broadly expressed support for Mayor Cherelle Parker’s approach to public safety and other major issues, giving her a 63% approval rating as she entered her second year in office. Residents identified some issues where they think she can make a difference—such as making the city’s neighborhoods cleaner and “greener,” or more environmentally sustainable, and improving trash collection. But they were less optimistic about the mayor’s ability to help reduce poverty and address the opioid crisis.

For a growing number of Philadelphians, financial stability and housing security were top concerns. Only 22% of residents said they felt it would be “fairly easy” or “very easy” to purchase a home in the city. A combined 28% of residents identified poverty and homelessness or affordable housing and the cost of living as the top issues facing the city.
The 2025 poll found:
- The overall outlook for the city is improving since the pandemic—59% of residents say the city is on the right track, up 23 percentage points from the last poll in 2022 and returning to pre-pandemic trends.
- 56% of Philadelphians say they feel “completely safe” or “pretty safe” in their neighborhoods at night, up from 44% in 2022.
- Fewer residents think their finances are in “excellent shape” or “good shape” (42%), a lower percentage than before 2020, when half held that opinion.
- More than a quarter of Philadelphians said that gun violence has had a major impact on the quality of life in their neighborhood—a significant figure, but considerably lower than the 42% who answered that way in 2022.
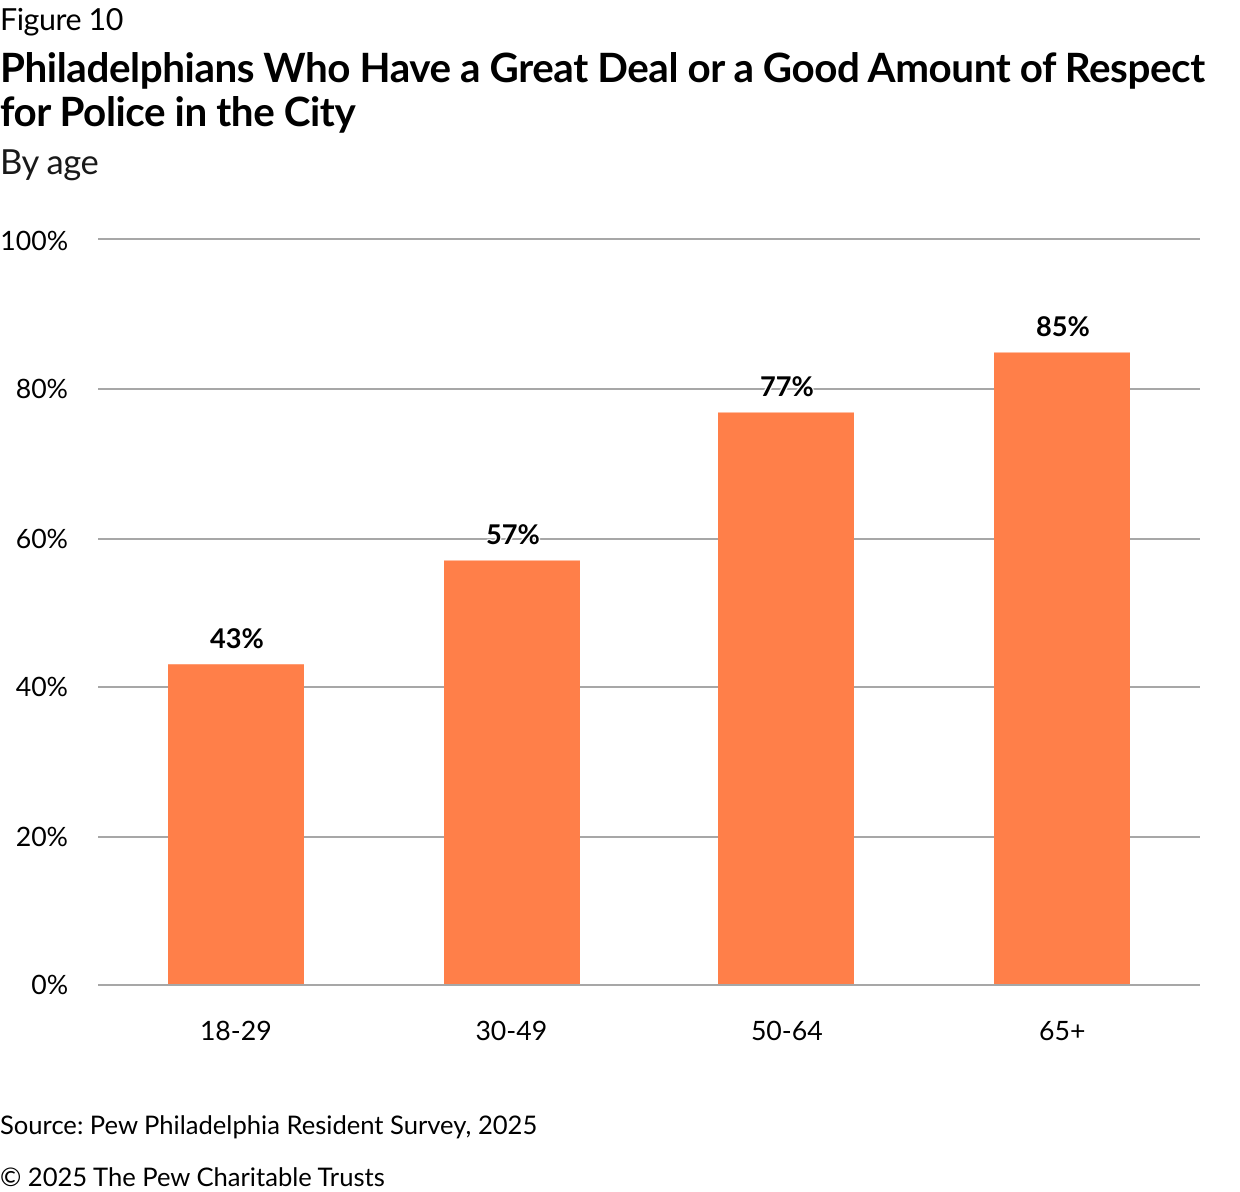
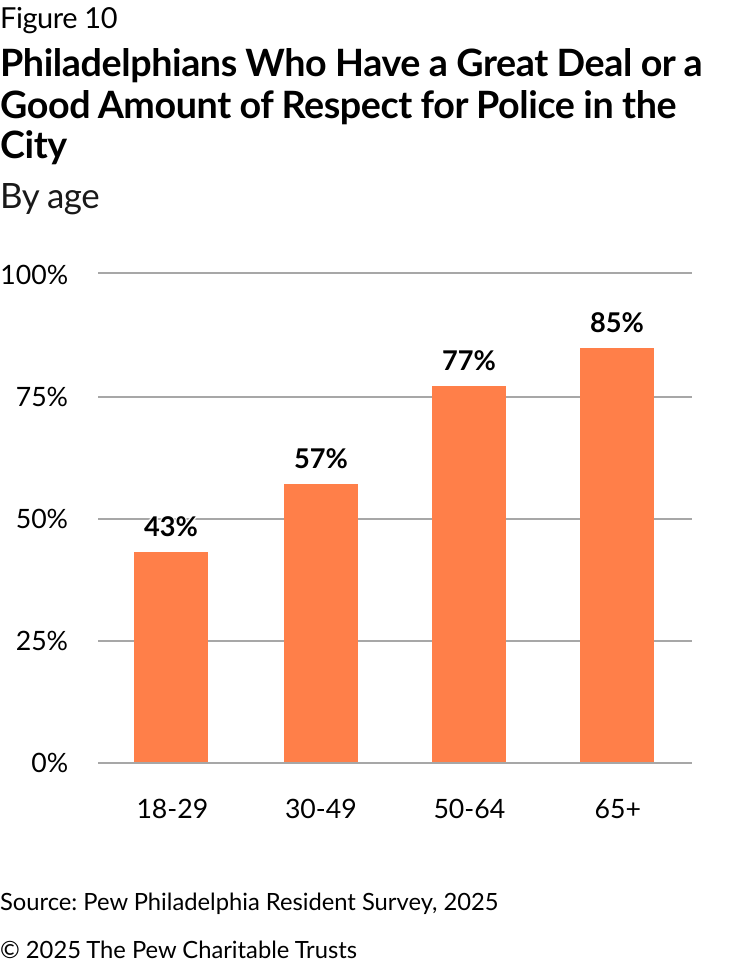
- Age is a notable factor influencing residents’ views of the Philadelphia Police Department. Only 43% of adults between the ages of 18 and 29 report having “a great deal” or “a good amount” of respect for the police, compared with 85% of those age 65 or older.
The 2025 Philadelphia Resident Survey—conducted Jan. 2 through March 10, 2025, for The Pew Charitable Trusts by SSRS, an independent research company based in Glen Mills, Pennsylvania—used address-based sampling, as individuals were originally contacted by mail. The poll focused on multiple issues, including public safety, views of Mayor Parker, perceptions of government responsiveness, immigration, and personal finance. SSRS collected data from 2,289 adults—1,776 filled out the questionnaire online, 402 on paper, and 111 over the phone. The margin of error for results involving all respondents is plus or minus 2.7 percentage points, and the analysis includes weighted percentages among all valid respondents.
Top issues facing the city
When Philadelphians have been asked over the years about the most pressing quality-of-life issues they face, crime, drugs, and public safety have consistently been their top answers. Gun violence rose sharply during the pandemic, with concern over the issue peaking at 70% in a 2022 Pew survey. In 2025, public safety remained the top concern, but it was cited by fewer Philadelphians (61%)—perhaps in part because of declining rates of violent crime throughout the city.1
In 2025, poverty and homelessness remained, jointly, the second most-mentioned issue, which was also the case in the 2020 and 2022 polls. Affordable housing and the cost of living combined represented the third most frequently cited issue: The share of people citing that as a top problem doubled since 2022, from 6% to 12%. This issue first became prominent in Pew’s 2020 poll, which may have reflected a rise in worries about affordable housing stemming from the pandemic—a concern that persists today. Other issues cited by more Philadelphians in 2025 than in 2022 were infrastructure, roads, and transportation; jobs and the economy; and sanitation, trash removal, and cleanliness. (See Table 1.)
Table 1
Philadelphians’ Most Important Issues
Percentage of respondents mentioning each topic
| Issue | 2019 | 2020 | 2022 | 2025 |
|---|---|---|---|---|
| Crime/drugs/public safety | 41% | 41% | 70% | 61% |
| Poverty/homelessness | 12% | 18% | 14% | 16% |
| Affordable housing/cost of living | N/A | 7% | 6% | 12% |
| Infrastructure/roads/transportation | 3% | 4% | 3% | 9% |
| Jobs/economy | 11% | 13% | 5% | 9% |
| Sanitation/trash removal/cleanliness | N/A | 8% | 5% | 7% |
| Education/school | 17% | 14% | 6% | 6% |
Notes: Issues are listed in order of the percentage of respondents who cited them in 2025; only issues mentioned by at least 5% of respondents in 2025 are shown. Respondents could—and often did—name more than one issue in answer to an open-ended question. Researchers organized the answers into categories. In 2019, a mayoral election year, respondents were asked about the most important issue facing “the city and the next mayor.” Polls were not conducted in 2021, 2023, or 2024.
Source: Pew Philadelphia Resident Survey, 2019, 2020, 2022, and 2025
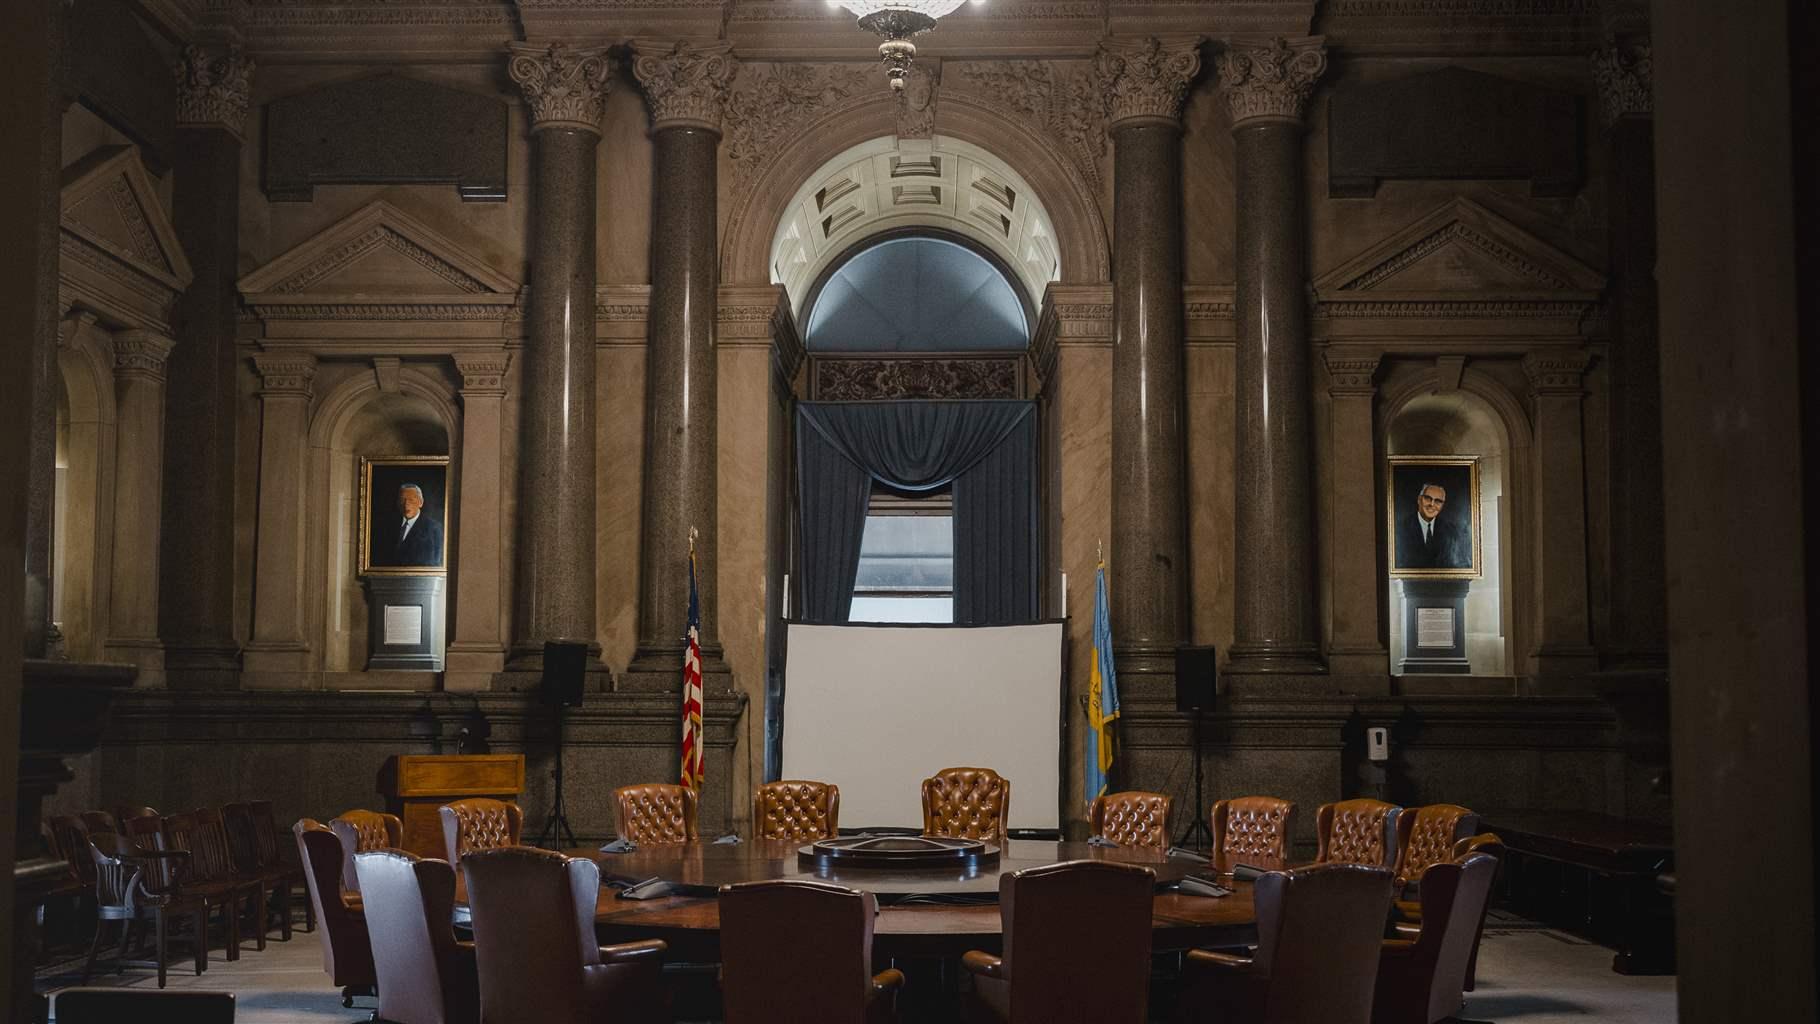
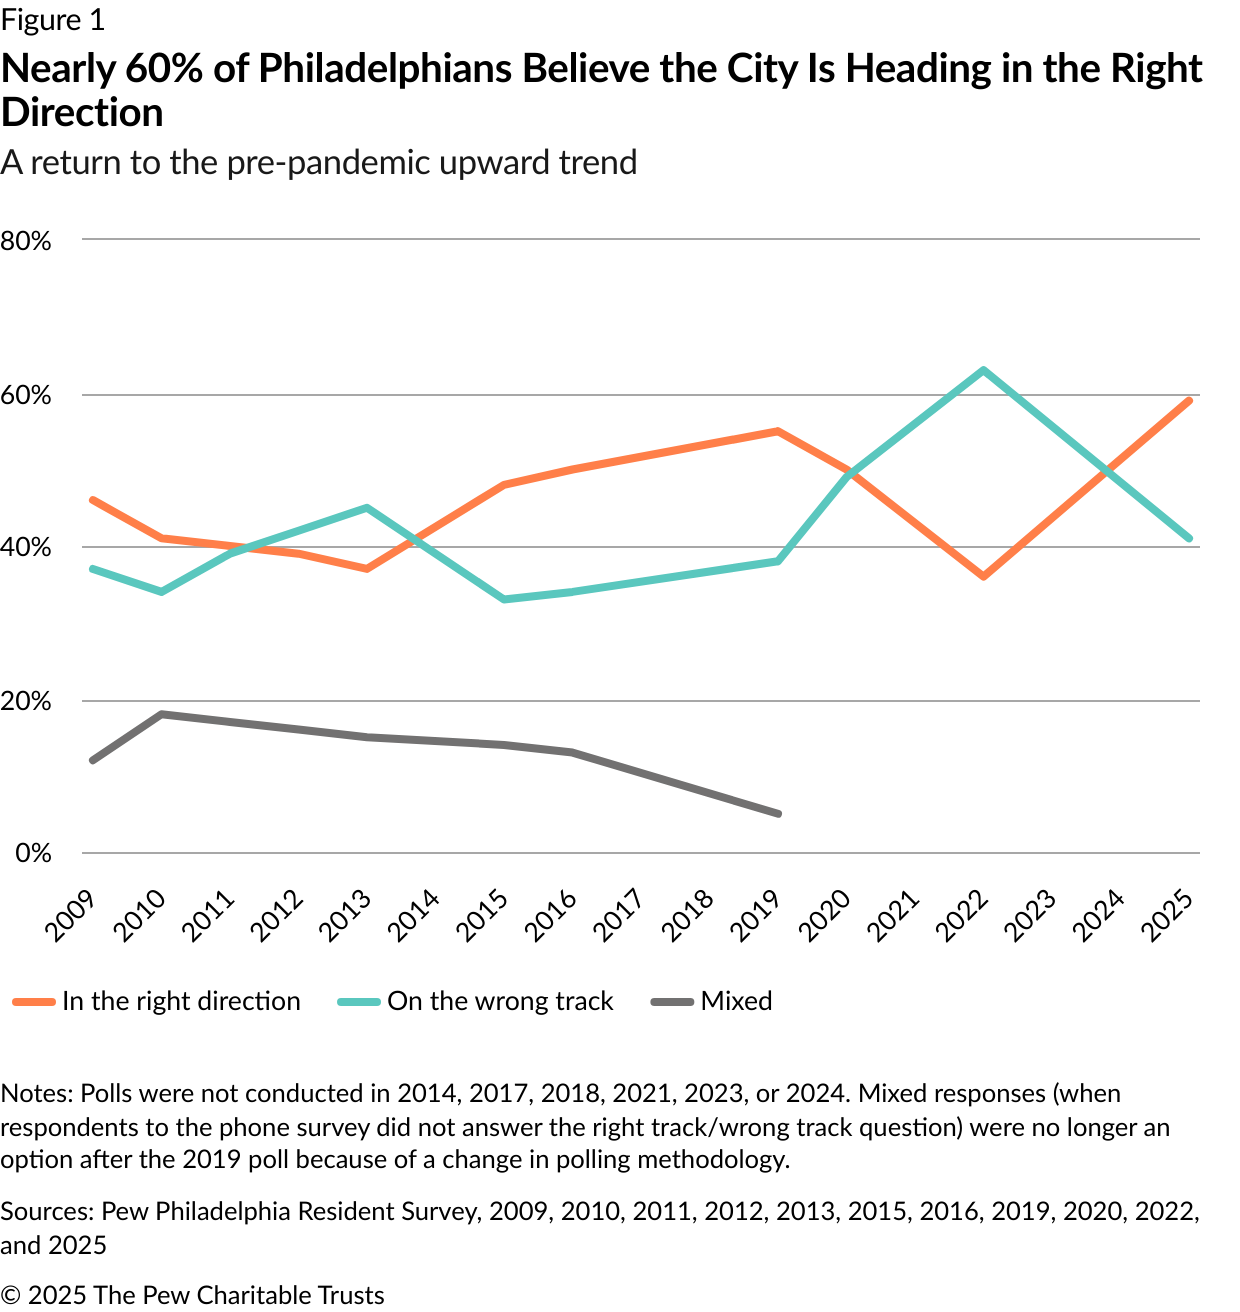
Philadelphia: Right track or wrong track?
Since its inception, Pew’s Philadelphia Resident Survey has asked Philadelphians whether they believe the city is heading in the right or wrong direction. The number of respondents indicating that they thought the city was moving in the right direction decreased between 2015 and 2022, to a low of 36% in 2022. In 2025, however, residents’ positive views appeared to be back on par with pre-pandemic perceptions: A record-high 59% of respondents to this year’s poll said they believe the city is headed in the right direction. (See Figure 1.)
Philadelphians expressing the strongest positive views about the city’s direction were Asian residents (71%), Center City residents (69%), older residents (68%), those earning $100,000 or more (68%), and those who have lived in the city for 10 years or less (67%). In each subgroup, at least 50% of respondents said the city was going in the right direction. However, a sizable percentage of respondents from the River Wards and North Philadelphia said they felt the city is on the wrong track—48% and 47%, respectively.
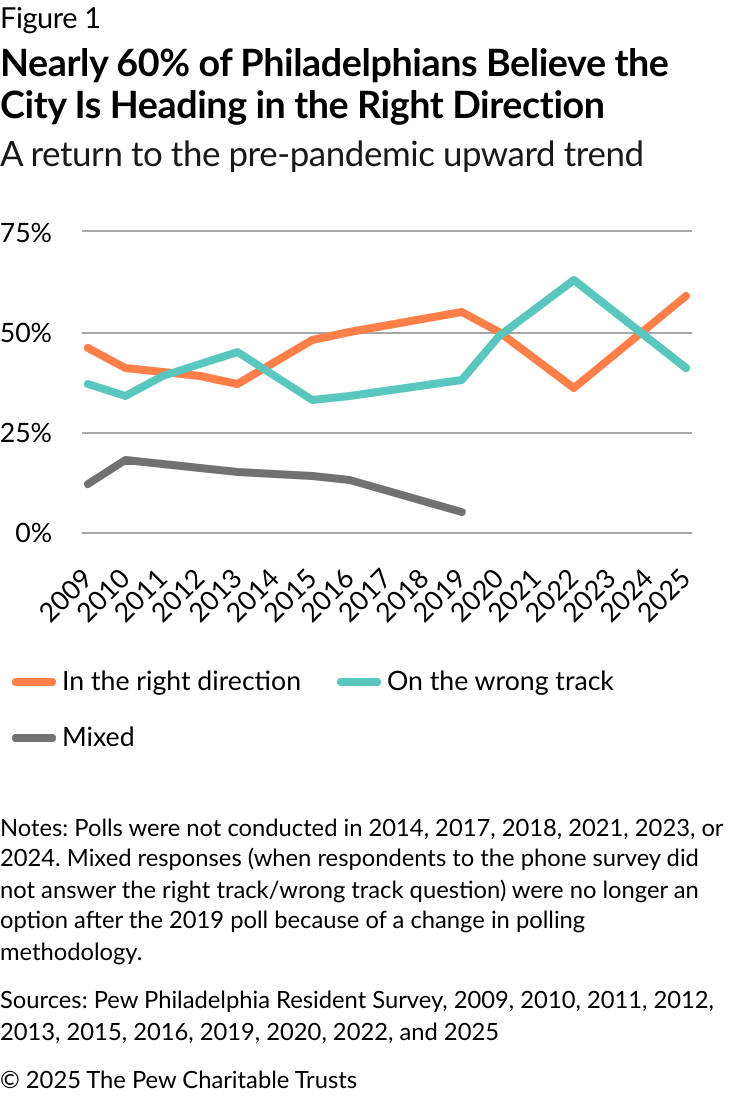
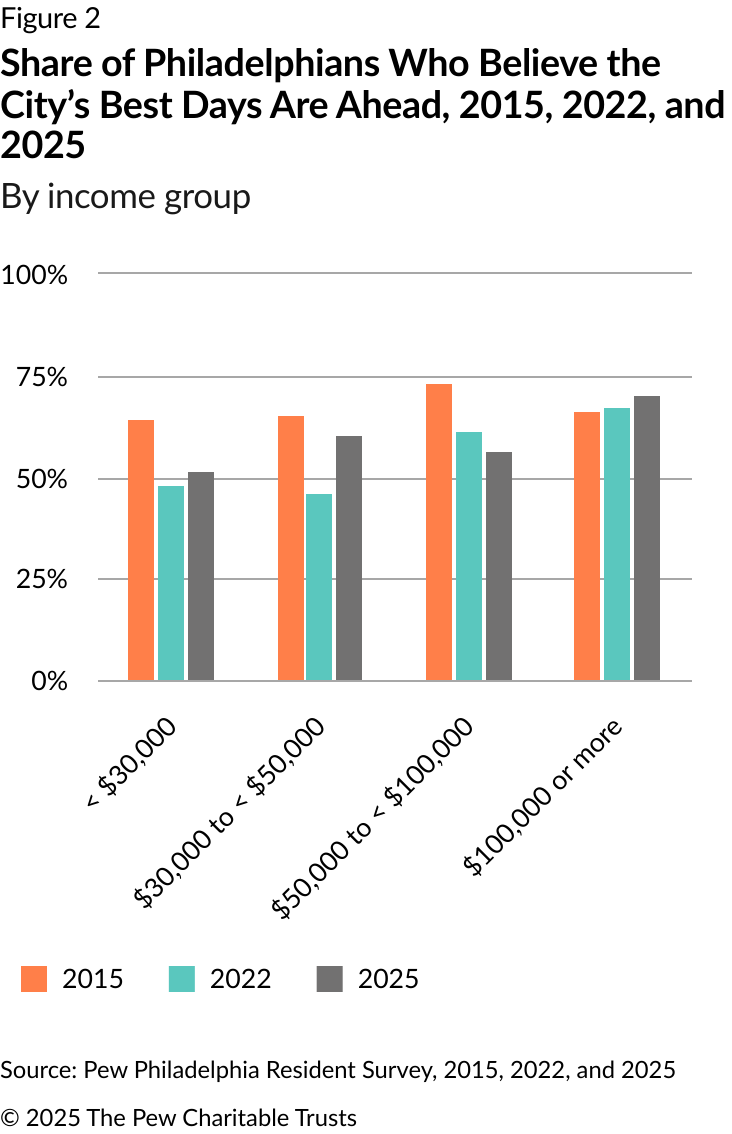
At the same time, other findings suggest that Philadelphians have a moderately optimistic outlook about the city’s future. A majority of respondents (59%) reported feeling that Philadelphia’s best days are ahead—higher than the 53% who responded that way in 2022, but lower than the 65% who held that view in 2015. Respondents with the most optimistic views about Philadelphia’s future were Center City residents (75%), people living in the city for 10 years or less (73%), college graduates (71%), and those with incomes of $100,000 or more (70%). In fact, Philadelphians earning $100,000 or more were the only income group in which more respondents said in 2025 than in 2015 that the city’s best days are ahead of it. All other income groups reported slight decreases in this sentiment since 2015, although the views of individuals in lower income groups rebounded somewhat from pandemic-era lows, when just 48% of those earning less than $30,000 and 46% earning between $30,000 and $50,000 held positive views about the city’s future. (See Figure 2.)
Mayor Parker earns high approval rating
Sixty-three percent of Philadelphians approve of the job Mayor Parker is doing after the first year of her four-year term, and her approval is above 50% for every group of respondents measured. The mayor’s approval is particularly high among older residents, those with a high school education or less, those with lower incomes, non-Hispanic Black Philadelphians, and unemployed Philadelphians.
Geographically, Mayor Parker’s approval ratings were highest in Northeast, West, and North Philadelphia. Her approval ratings were lowest in South Philadelphia, among those with college degrees, and among residents ages 18-29. Her 63% overall approval rating is among the highest recorded by an incumbent mayor since the first Pew poll in 2009.
Given the ongoing concerns about crime and safety in the city, residents were asked to rate the mayor’s handling of public safety. Nearly half (49%) said her handling of public safety was “good” or “excellent,” with 60% of respondents age 50 or over giving her this rating and nearly as many non-Hispanic Black respondents (58%) doing the same.
Mayor’s perceived effectiveness varies by issue
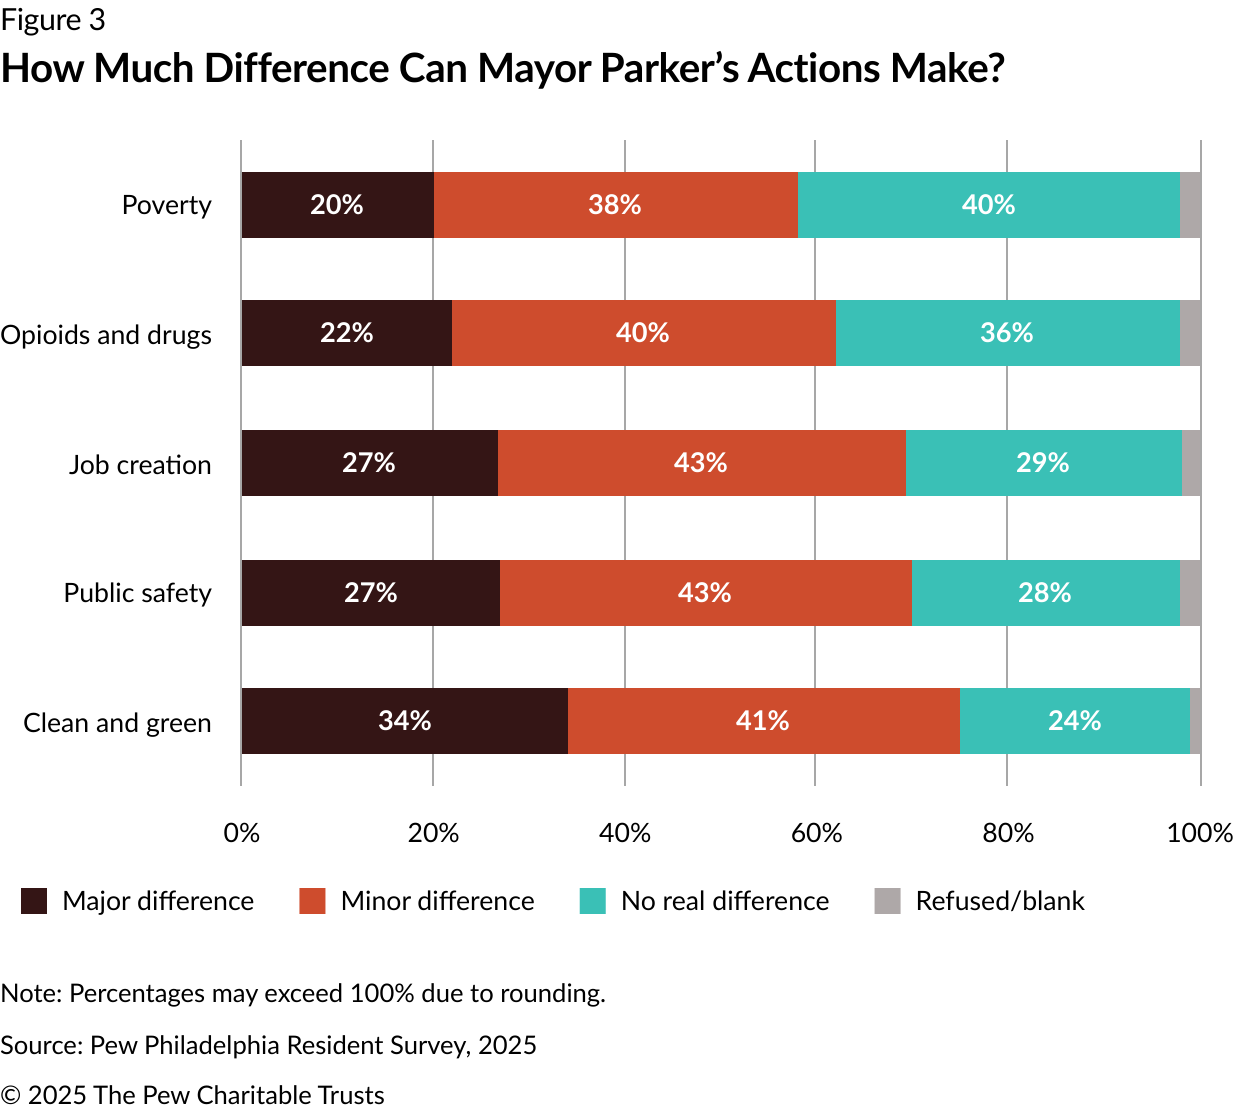
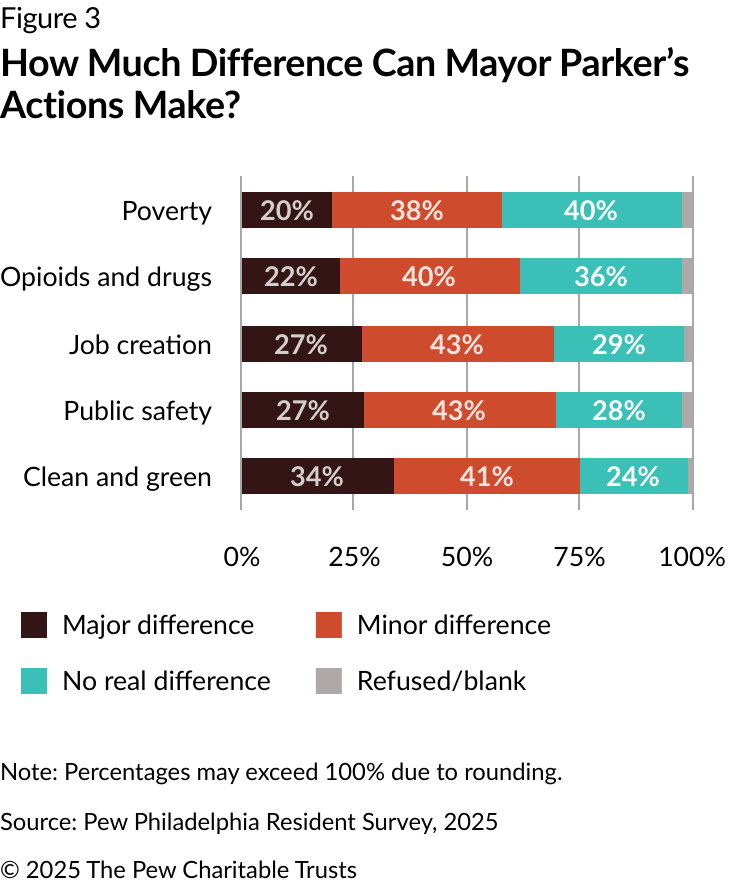
The poll asked how much of a difference Mayor Parker’s actions could make, and respondents were given three choices: a major difference, a minor difference, or no real difference. Residents felt that the mayor could have the biggest impact by making Philadelphia cleaner and greener, making it safer, and creating jobs. Residents were less inclined to think the mayor could make a big difference for people struggling with opioid use disorder or other substance misuse issues, or that her actions could reduce poverty in the city. (See Figure 3.)
Trash collection is a major component of the mayor’s plan to make Philadelphia cleaner and greener. Across all respondent groups, Philadelphians said they were largely satisfied with trash pickup in their neighborhoods, with 38% saying they were “very satisfied” and 41% “somewhat satisfied.” By contrast, 13% were “somewhat dissatisfied” and 7% “very dissatisfied.” All respondent groups feel similarly positive about trash collection in their neighborhoods.
Immigration
Asked if anyone in their immediate household was born outside the U.S., about 1 in 5 respondents said that was the case. Overall, people from immigrant households held many of the same views as their U.S.-born counterparts, except on questions relating to policing and opioid use disorder. (See Table 2.)
Table 2
Immigrants and U.S.-Born Residents Hold Similar Views on Philadelphia
| View | Percentage of foreign-born residents holding this view | Percentage of U.S.-born residents holding this view |
|---|---|---|
| Philadelphia is a good or excellent place to live. | 65% | 65% |
| Crimes/drugs/safety is the most important issue facing the city. | 60% | 61% |
| Things in Philadelphia are generally headed in the right direction. | 61% | 58% |
| Mayor Parker’s handling of public safety is good or excellent. | 48% | 49% |
| Feel somewhat or very satisfied with current housing. | 81% | 79% |
| Neighborhood is a good or excellent place to live. | 70% | 66% |
| Feel pretty safe or completely safe out in neighborhood at night. | 54% | 57% |
Source: Pew Philadelphia Resident Survey, 2025
Asked about the impact of immigration on the city, 62% of respondents—including 71% from immigrant households and 61% from U.S.-born households—said that the increase in the number of immigrants in the city is “more of a good thing.” Similarly, when asked if immigrants bring new vitality to Philadelphia’s neighborhoods, 66% of respondents agreed. Overall, people ages 18-29, as well as Hispanic and Asian residents, from both immigrant and U.S.-born households, were most likely to agree that immigration is a good thing.
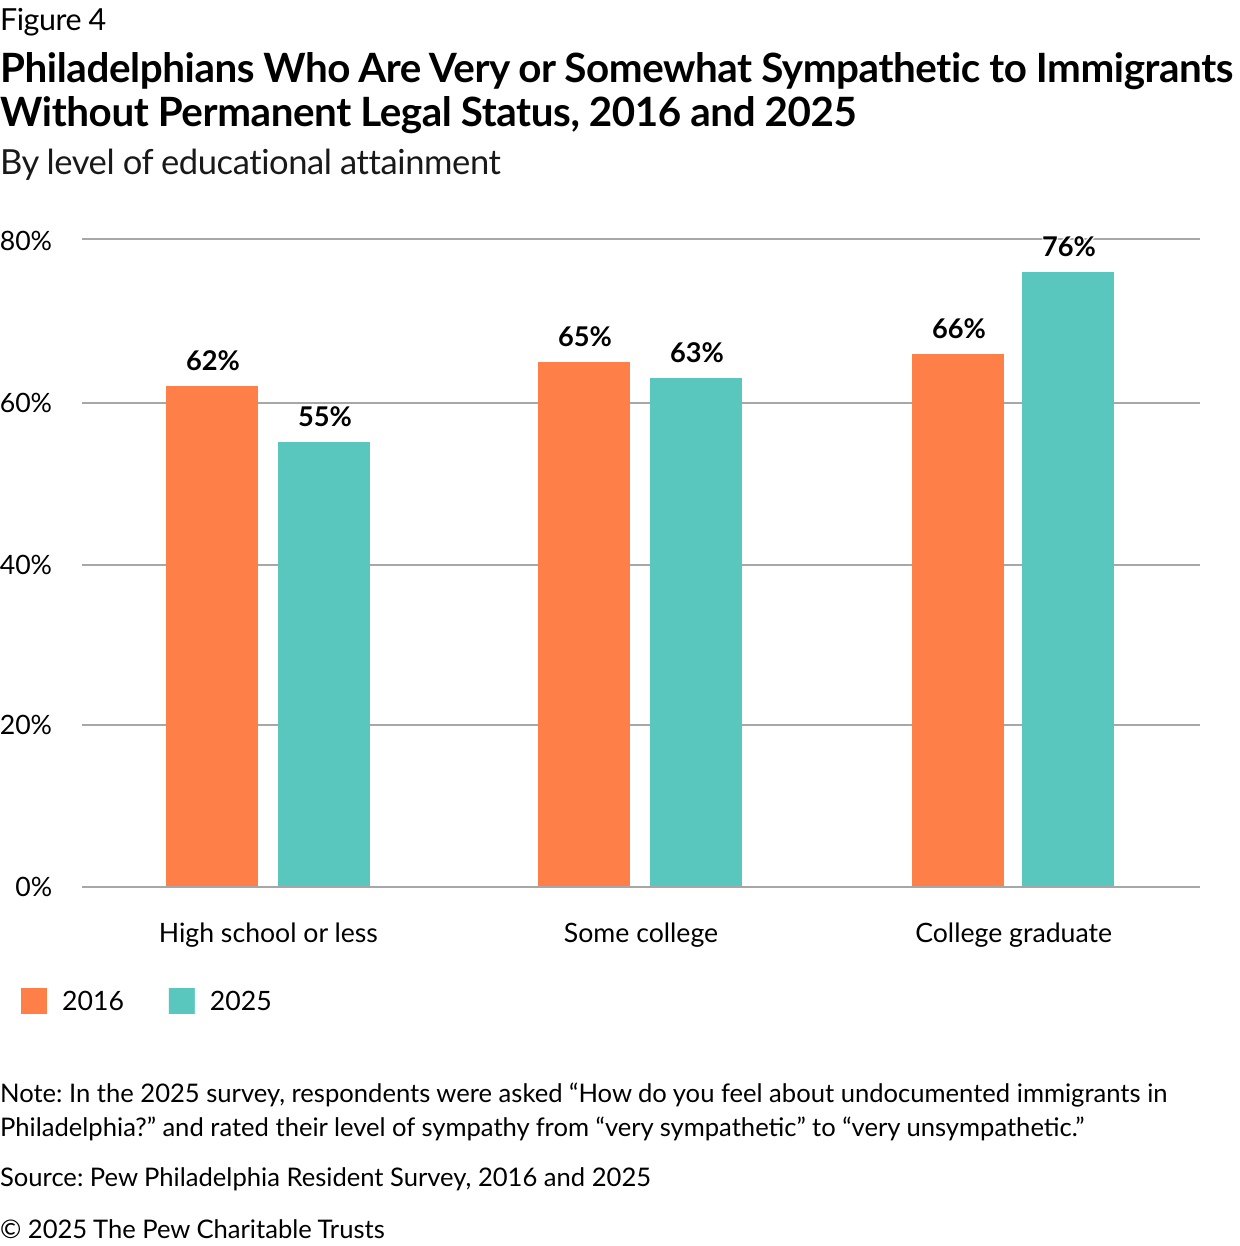
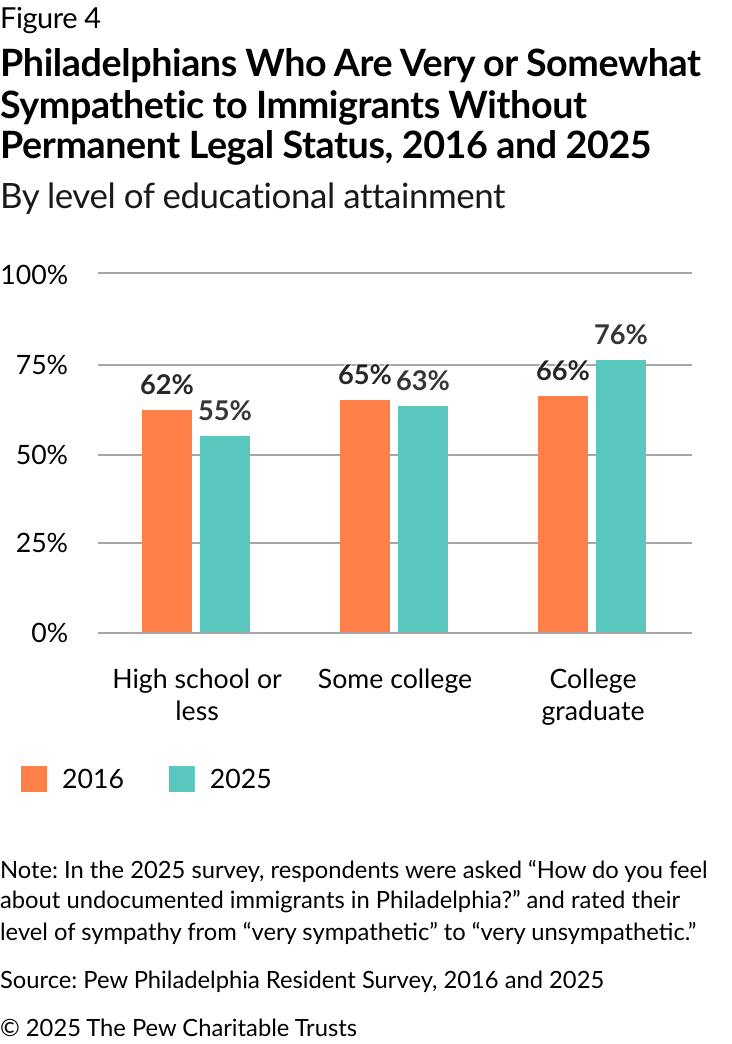
Generally speaking, Philadelphians had sympathetic views toward immigrants without permanent legal status (in the survey, respondents were asked about their views of “undocumented immigrants”). Sixty-four percent of residents said they were very or somewhat sympathetic to people in this situation, the same poll result as in 2016. However, the 2025 poll found that the degree of support varied by level of educational attainment, as it has since 2016, when Pew first asked this question. (See Figure 4.) In 2025, Philadelphians with a high school diploma or less schooling expressed less sympathy toward this group of immigrants, while those with a college degree or more education expressed more sympathy. In 2016, the amount of sympathy expressed by people in both education groups was similar.
Personal finance and housing
When asked about their personal financial situation, just 42% of respondents said it is good or excellent—a decrease from 2020, when 50% of respondents described it that way. Fifty-eight percent of respondents said their situation is fair or poor.
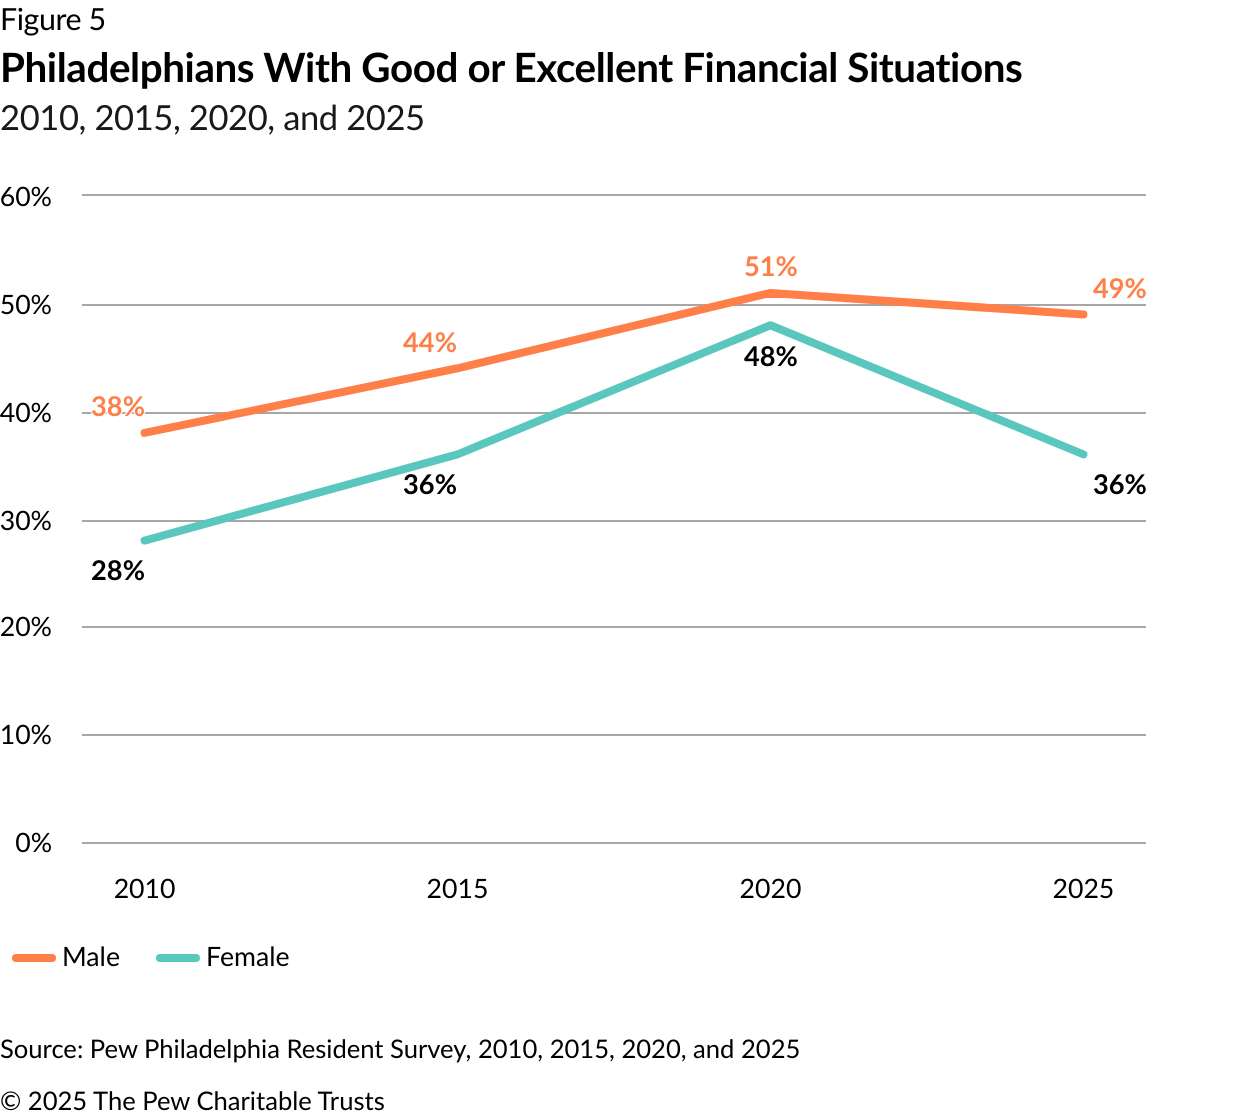
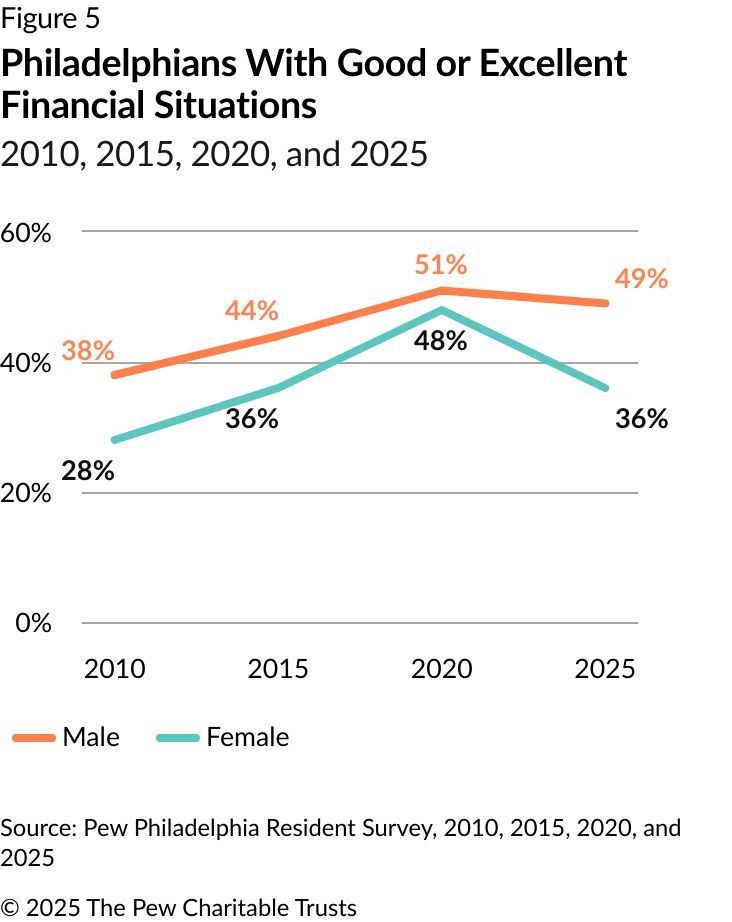
Historically, men have reported being in better financial shape than women in the poll. In 2020, the gender gap in respondents reporting that they were in “good” or “excellent” financial shape had narrowed to just 3 percentage points, with 51% of men and 48% of women describing their financial situation positively. That gap widened in 2025, however: Fewer respondents of either gender described their finances as good or excellent compared with 2020—and the decrease was greater among women. The number of men who said they were in good or excellent financial shape decreased slightly, from 51% to 49%, while the number of women reporting good or excellent financial situations fell from 48% to 36% in 2025—a historical low. The result represents the largest gender gap recorded since the poll began. (See Figure 5.)
Another set of subgroups with significantly different financial situations were homeowners and renters. Of respondents who own a home, 52% reported being in good or excellent financial shape, compared with just 33% of renters. By contrast, owners and renters answered other poll questions similarly, with a few notable exceptions. When asked whether the city should prioritize economic growth and job creation rather than directly helping low-income people, renters were more likely to choose the latter (52%, compared with 34% of owners). Owners also reported higher satisfaction with their current housing than renters did.
Philadelphians are largely satisfied with their current housing, particularly Center City residents, older residents, and college graduates.
Two-thirds of respondents reported feeling that it would be fairly difficult or very difficult to purchase a home in Philadelphia. This differed somewhat among subgroups: 70% of respondents with incomes of between $50,000 and $100,000 said they believe it would be fairly difficult or very difficult to buy a home, while only 62% of those with incomes below $30,000 felt the same way. That result was similar to responses from Philadelphians with incomes of $100,000 or higher, 64% of whom believe that buying a home would be fairly or very difficult.
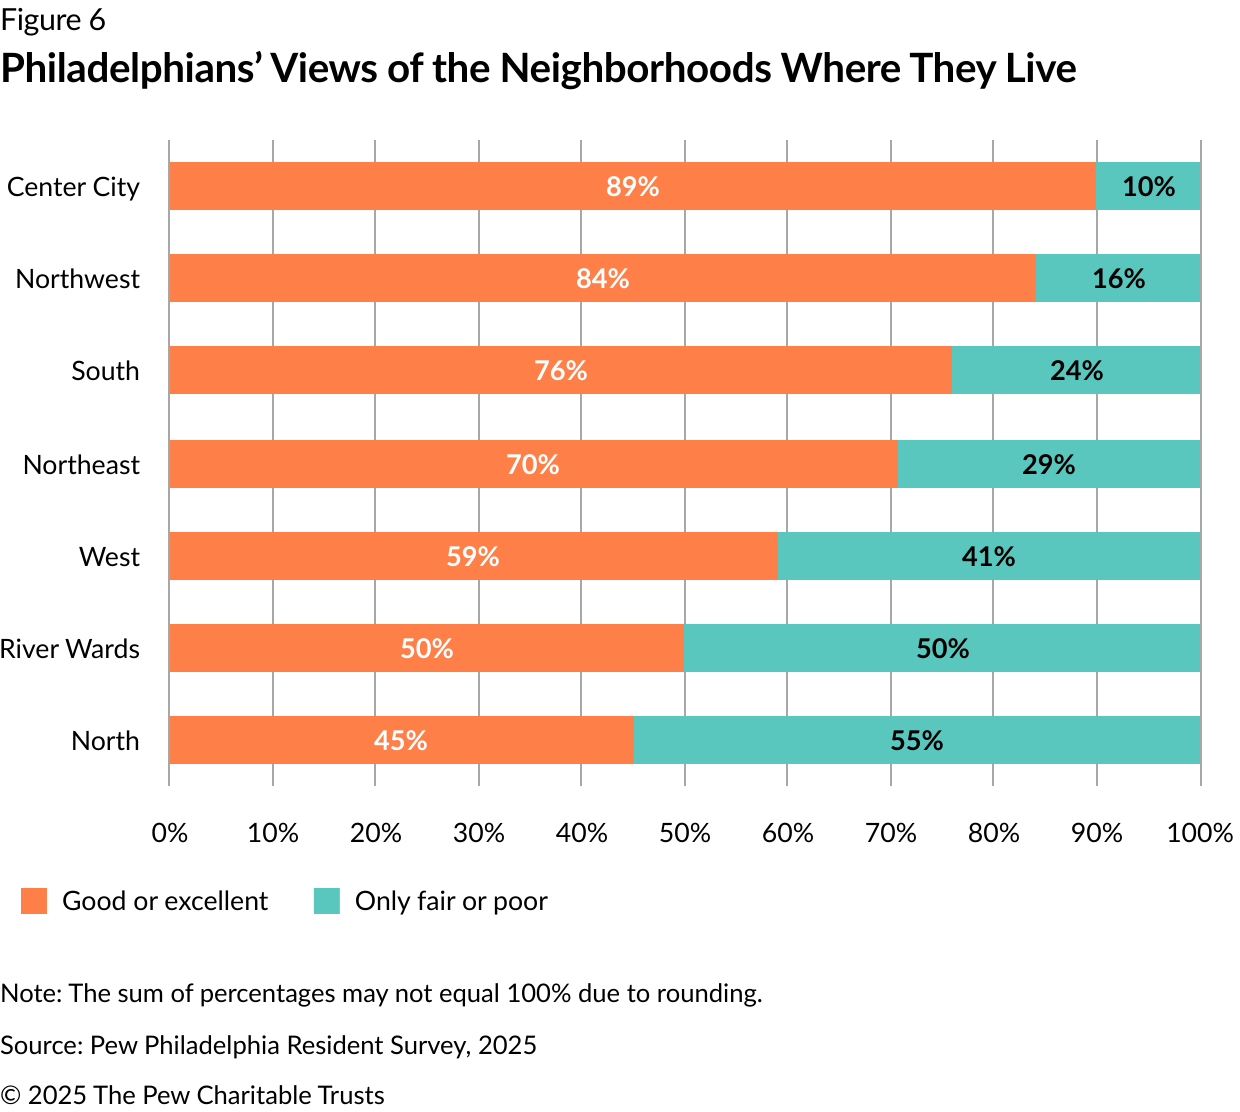
Regardless of their individual housing situations, Philadelphians are generally happy with the neighborhoods in which they live, with 67% rating them as good or excellent. Ratings are particularly high in Center City (89%), Northwest Philadelphia (84%), and South Philadelphia (76%). (See Figure 6.)
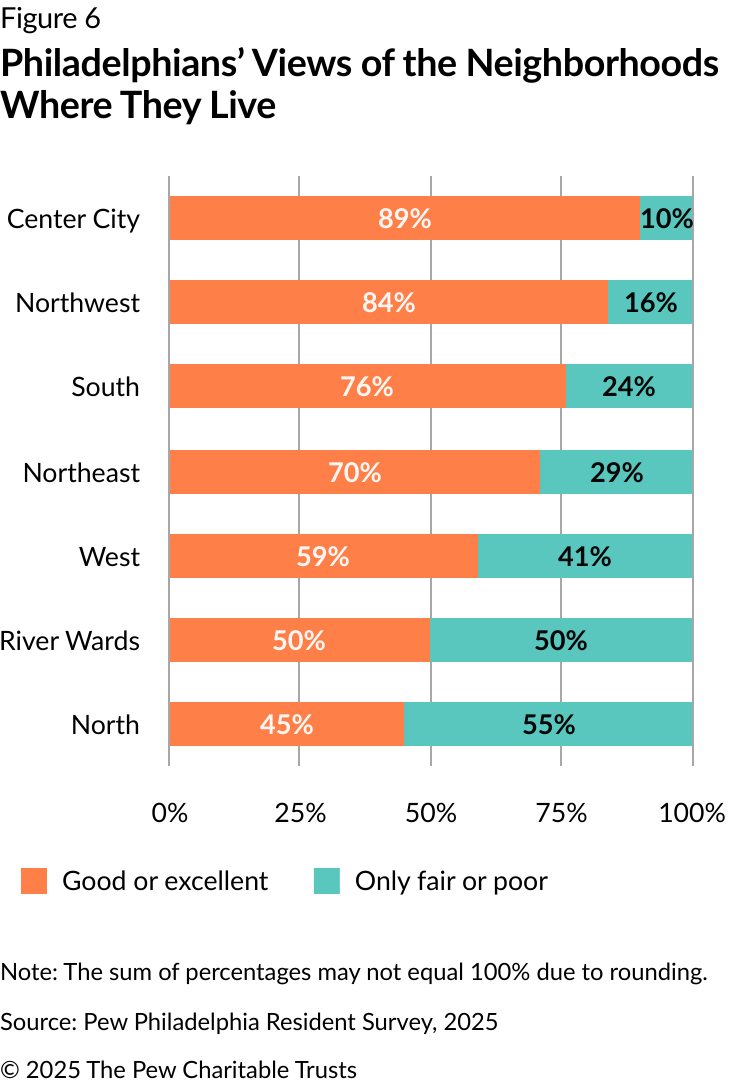
College graduates (82%), respondents earning $100,000 or more (82%), and White residents (78%) rate their neighborhoods higher than other groups do.
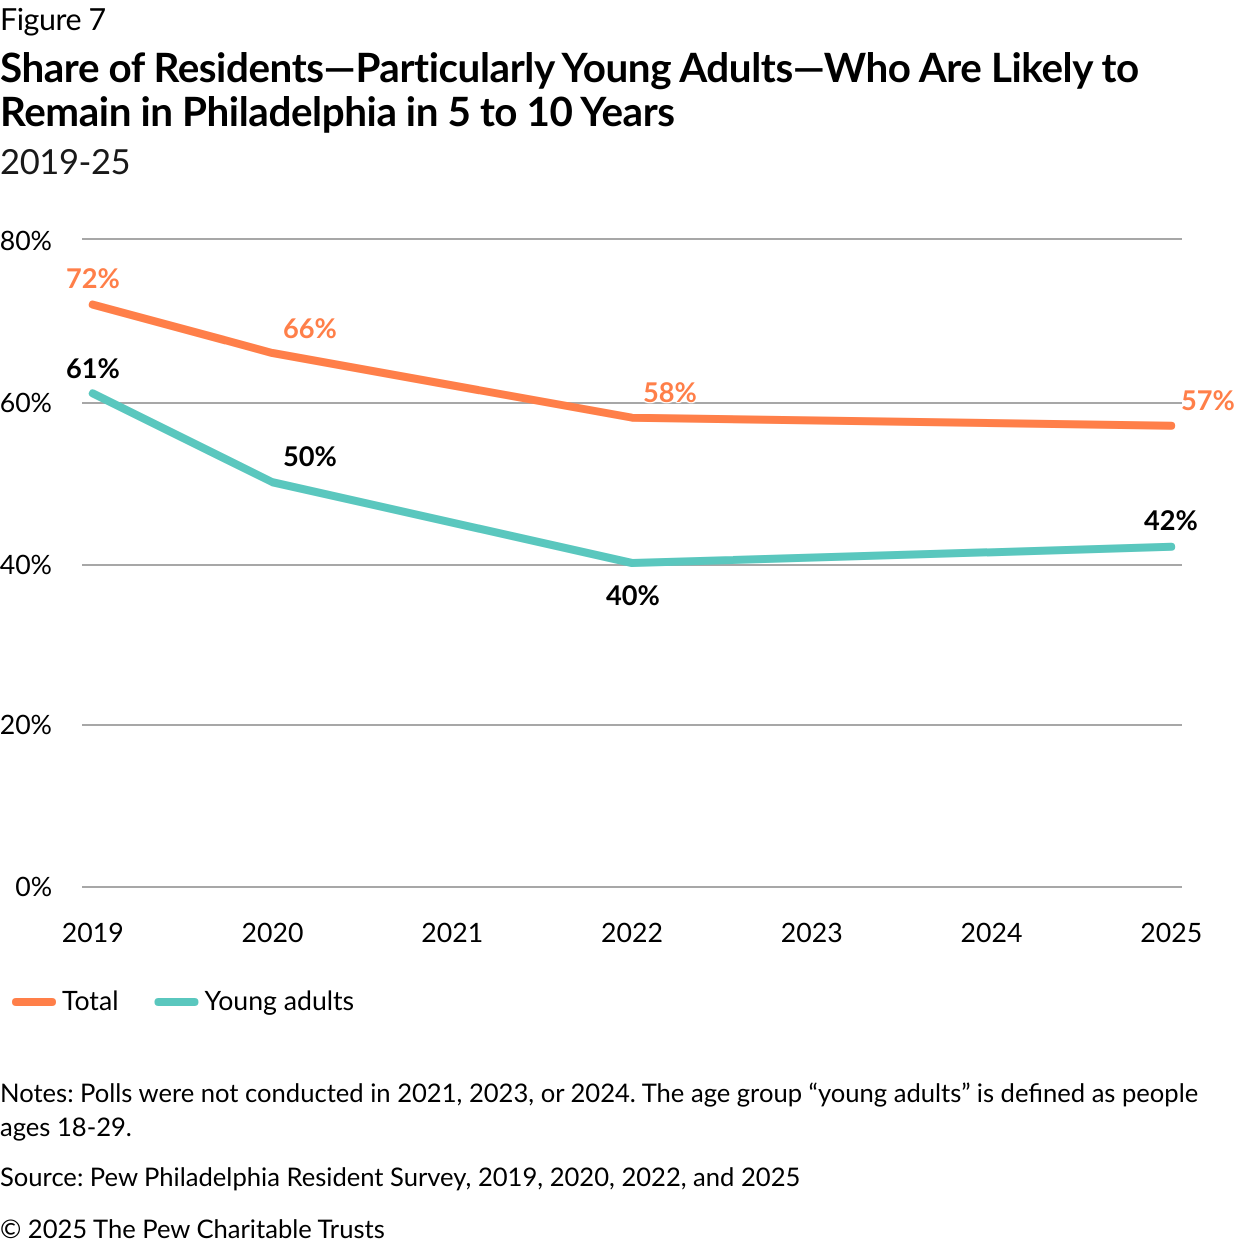
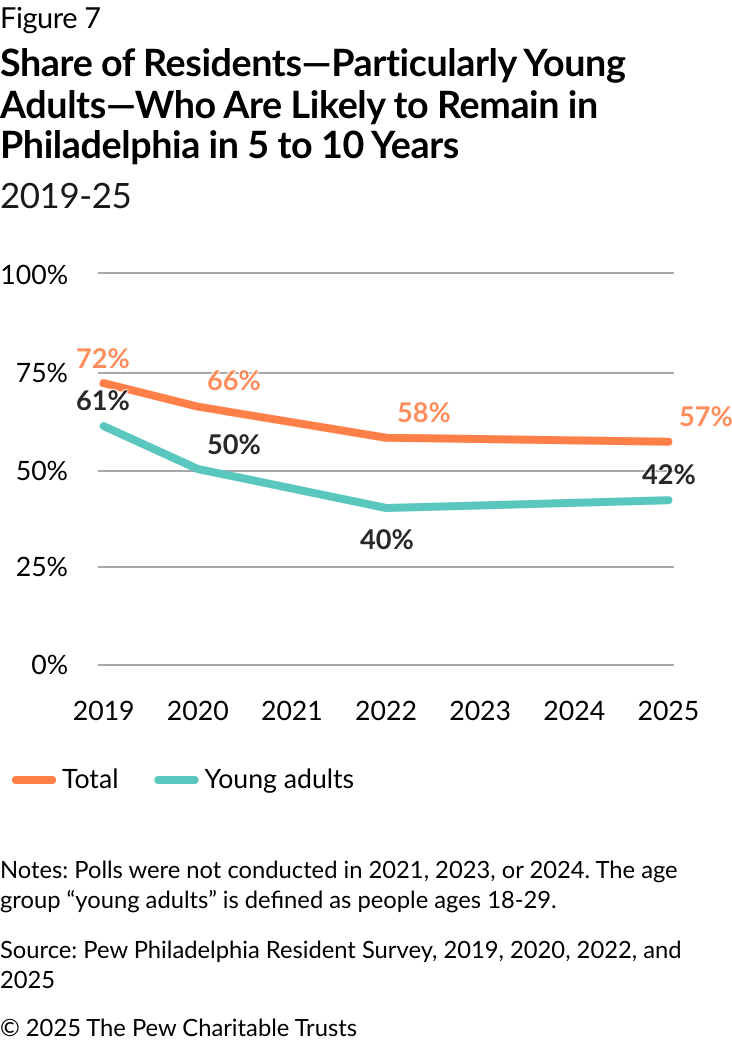
Despite generally high satisfaction with where they live, residents’ inclination to remain in the city in the near term has waxed and waned over the years, and has recently decreased. In 2025, 57% of residents said they will definitely or probably live in Philadelphia in five to 10 years, compared with 67% in 2015. Young adults under the age of 30 were least likely to say they anticipate remaining in Philadelphia—just 42% said they were likely to do so, down from 59% in 2015. (See Figure 7.)
Public safety
In 2024, violent crime in Philadelphia dropped to its lowest level in the 21st century, a per capita rate of 832 violent crimes per 100,000 residents. Homicides that year fell to their lowest level in nearly a decade, at 269.2 Despite these encouraging developments, Philadelphians have mixed perceptions about crime and public safety in the city.
Philadelphians’ opinions about the safety of their neighborhoods at night have improved since 2022, a development that largely reflects an increased sense of security felt by Black and Hispanic residents. White, non-Hispanic residents maintain high perceptions of safety in their neighborhood at night, with 66% feeling “completely” or “pretty” safe. (See Figure 8.)
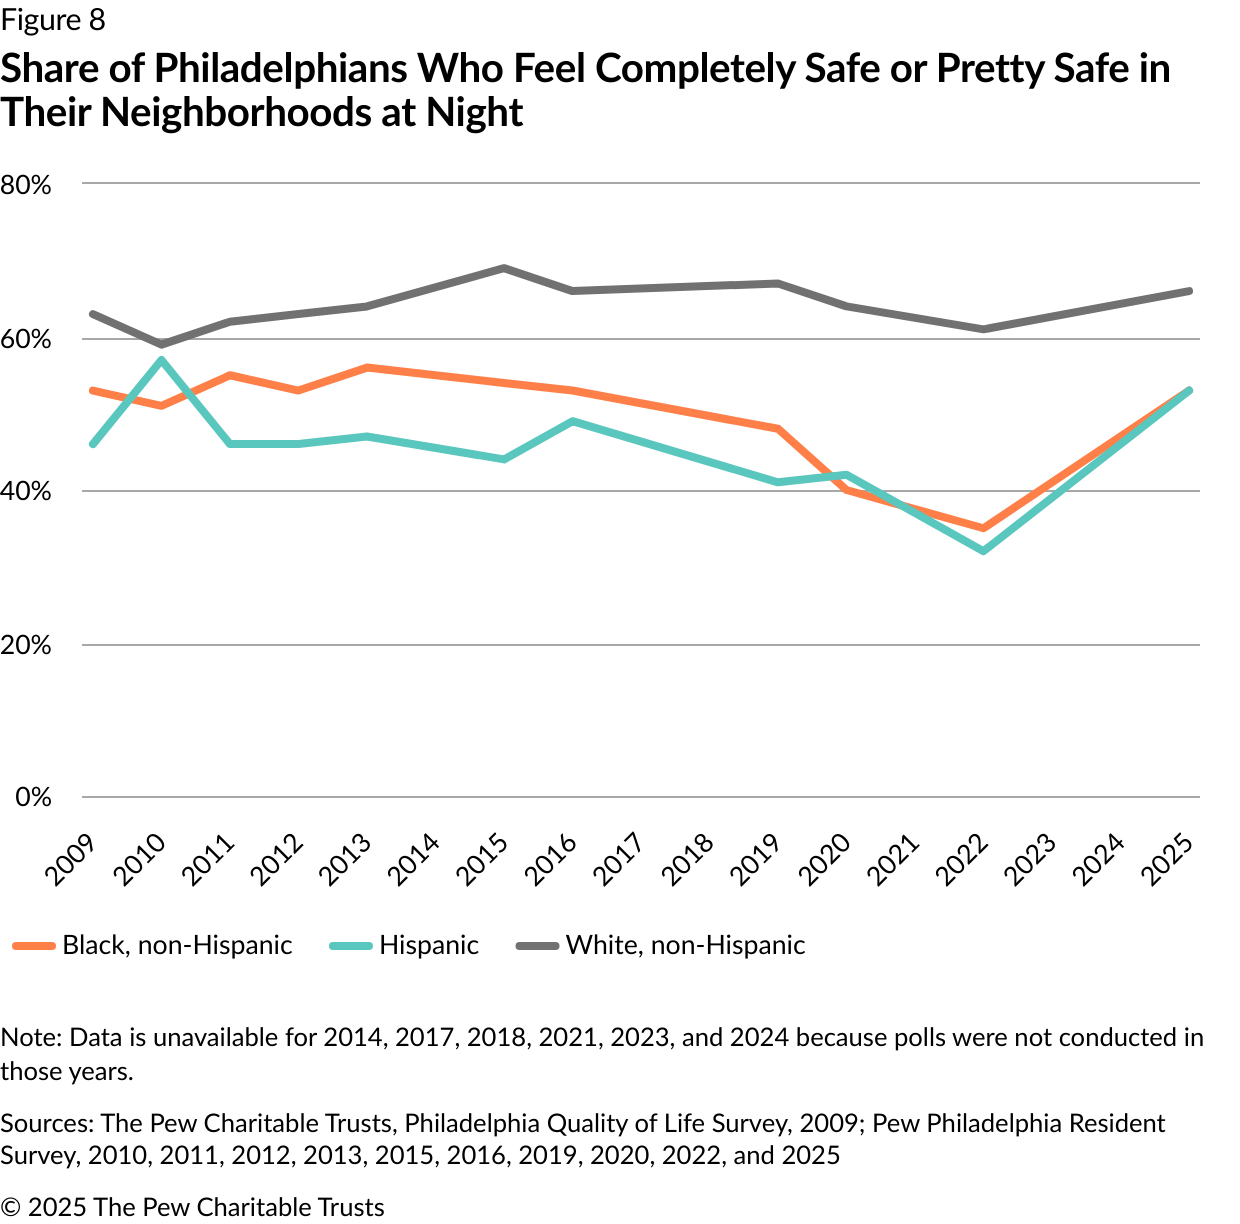
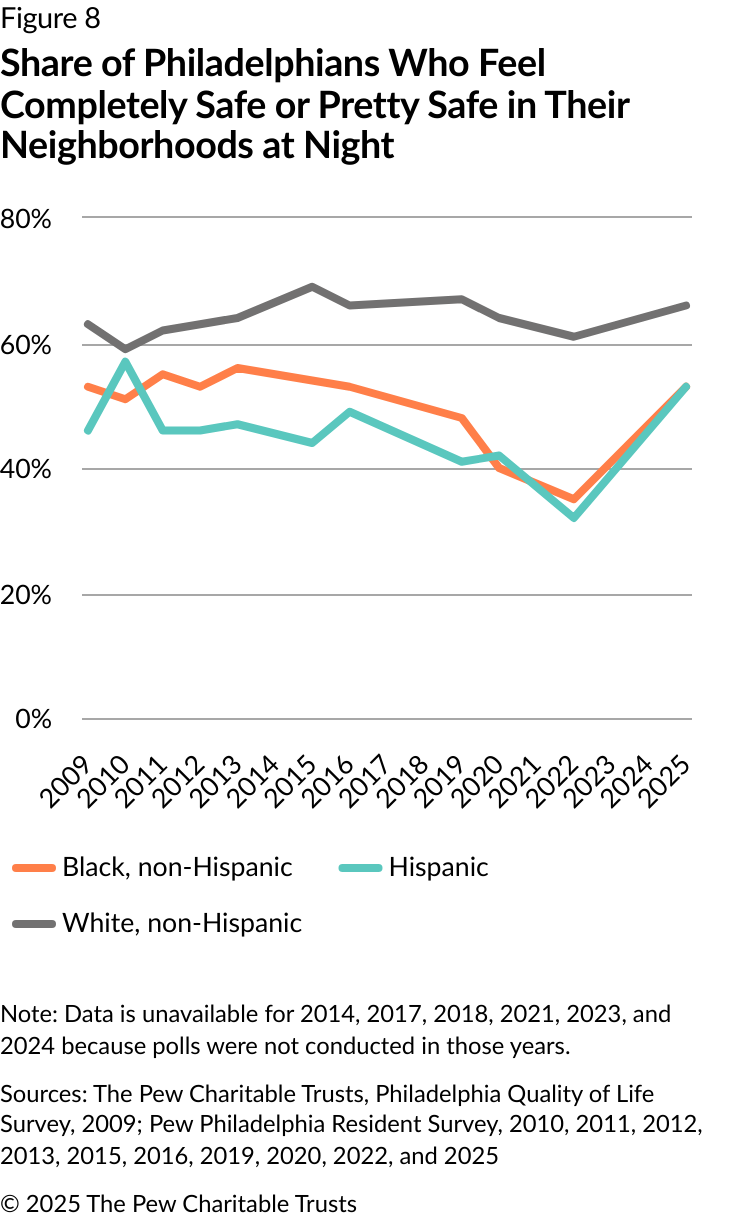
For the first time in the history of Pew’s Philadelphia Resident Survey, the sample size of Asian residents was large enough to analyze responses from members of this group. One notable finding was on the issue of public safety, with Asian respondents expressing the lowest degree of safety of any group. Only 46% reported feeling completely or pretty safe.
Gun violence
The incidence of gun violence fell significantly over the past year, with a decline in shootings and other violent crimes involving a firearm.3 Philadelphians’ apprehensiveness about gun violence mirrored these downward trends. Approximately half of Philadelphians (53%) reported hearing gunshots in their neighborhood during the past year, down from 65% in 2022. Compared with the 2022 Pew survey, fewer residents throughout the city reported that gun violence has a major impact on the quality of life in their neighborhood. Hispanic and Black Philadelphians were most likely to say that gun violence had a major or minor impact on their quality of life; residents from other racial and ethnic groups were more likely to say it had no impact. (See Figure 9.)
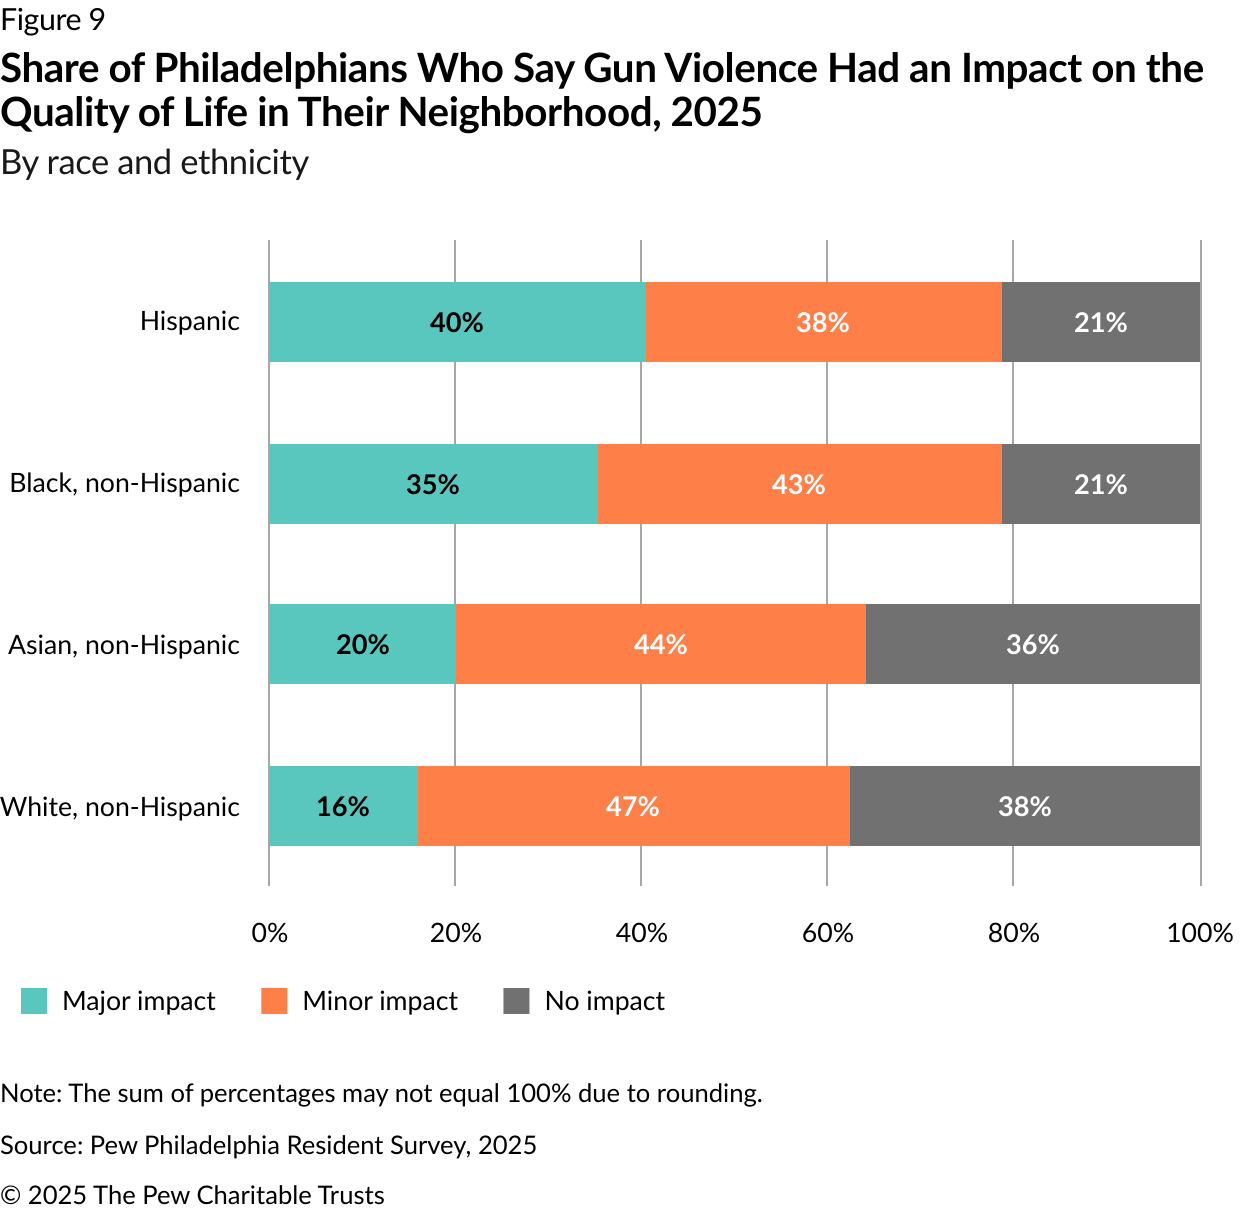
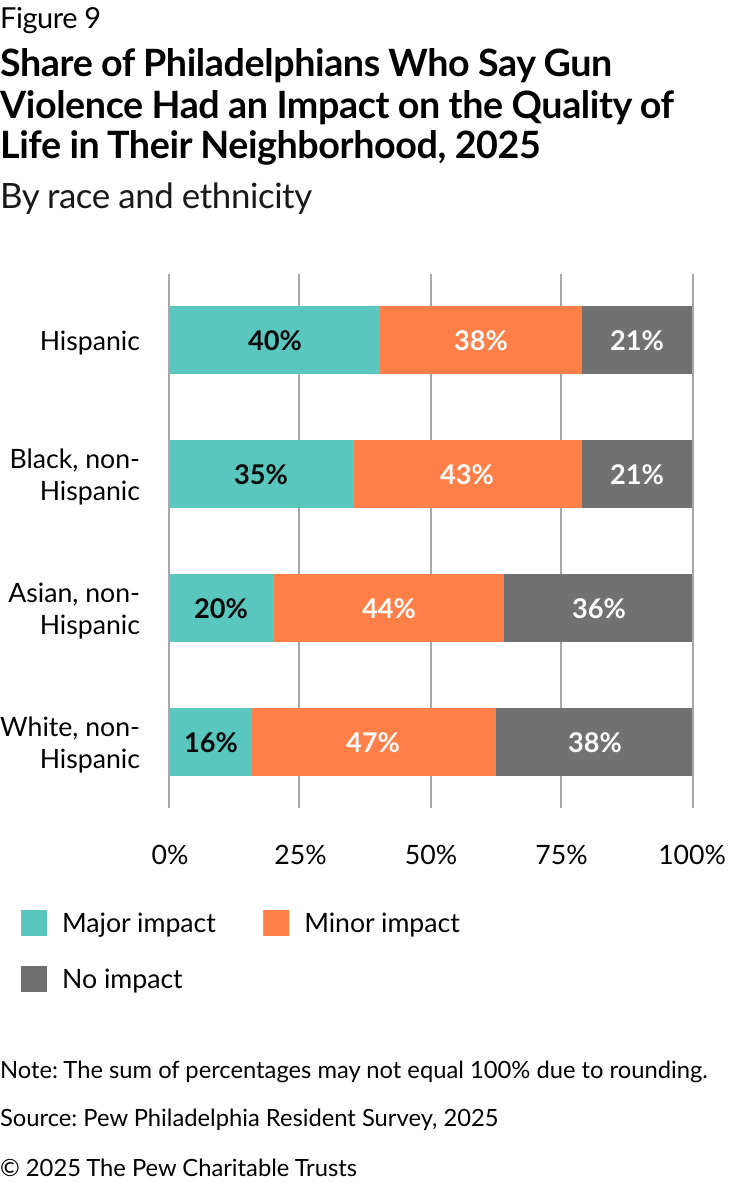
Over the past year, violent crimes—including gun violence and homicides—have decreased in Philadelphia, but not all respondents reported beliefs about violence that mirrored that decline.4 Findings varied by neighborhood: For instance, 44% of residents in North Philadelphia said gun violence has a major impact on the quality of life in their neighborhood.
The number of Philadelphians who viewed gun violence as getting worse declined significantly from 2022 to 2025, from 85% to just 41%. Residents who attended college but did not graduate (48%), people living in Northeast Philadelphia (50%), and those with incomes between $30,000 and less than $50,000 a year (50%) were most likely to say that gun violence is getting worse. However, the fact that the share of respondents who feel it is getting worse decreased by more than half is largely reflective of the reduction in gun-related crimes in the city in recent years.
Asked if they thought homicides had increased or decreased in the previous 12 months, only 38% said they believed the crimes had decreased, while 30% said they felt there had been no real change; another 31% of respondents said they felt that homicides were increasing. Young adults ages 18-29 were most likely to say that homicides were increasing (41%).
Views on police
In 2025, nearly two-thirds of Philadelphians reported having a “great deal” or a “good amount” of respect for police in Philadelphia (rather than having “just some” or “not much” respect). For residents ages 65 and older, 85% said they felt respect for police. However, less than half of residents ages 18-29 held those views. (See Figure 10.)
Race and ethnicity remain important factors in how Philadelphians regard the police, and respondents’ views have evolved over time. George Floyd’s murder in 2020 and the civil unrest that followed led to a nationwide shift in public opinion, as more people came to believe that police officers were more likely to use excessive or deadly force when interacting with Black Americans than with people from other racial and ethnic groups.5 There was a corresponding decline in the number of Philadelphians of all races who felt that the police treated Black residents and White residents equally. In Pew’s 2025 poll, a greater percentage of White and Black residents had perceptions of police that were less favorable than in 2015 (about 10 percentage points lower among White respondents, and 7 percentage points lower among Black respondents). More Hispanic residents, by contrast, held favorable perceptions about the police in 2025, compared with 2015. (See Figure 11.)
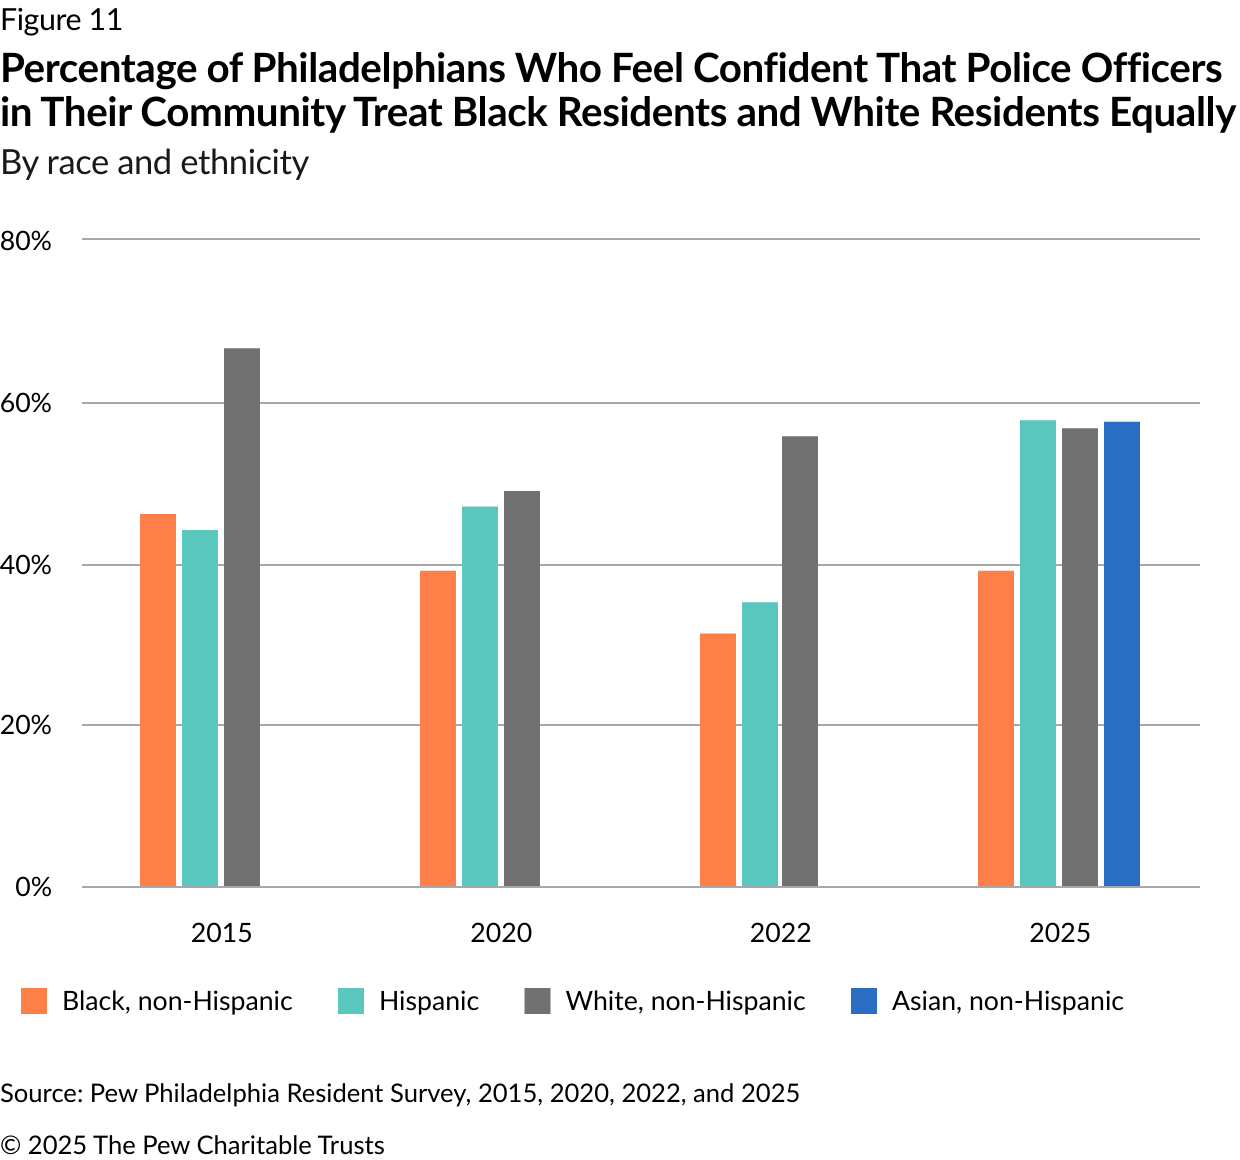
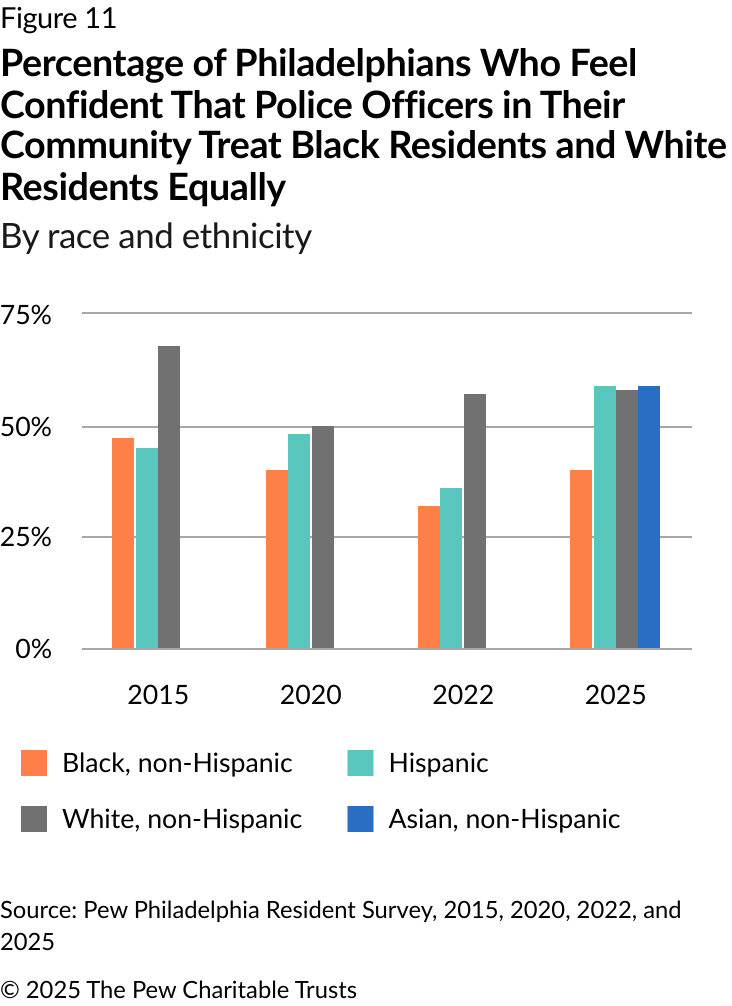
When asked their views of how police treat Hispanic Philadelphians compared with White residents, respondents reported similar views—including 58% of Hispanic residents, who reported having a great deal or a fair amount of confidence that the police will treat Hispanic people and White people equally.
The poll also explored Philadelphians’ views about the number of police officers the city should employ. In 2025, 58% said the city does not have enough police, similar to 2022, when 61% said the same. Adults over age 50, women, people with incomes between $30,000 and $50,000, and those who live in Northeast Philadelphia were most likely to say that the city does not have enough police. By contrast, people under 30, foreign-born residents, and those who have lived in Philadelphia for 10 years or less were more likely to say that the city has the right number of police. Age was the largest determinant of views on this subject. (See Table 3.)
Table 3
Philadelphians’ Views on the Number of Police Officers in the City, 2025
By age
| 18-29 | 30-49 | 50-64 | 65+ | Average | |
|---|---|---|---|---|---|
| Doesn’t have enough police | 38% | 51% | 72% | 74% | 58% |
| Has the right number of police | 46% | 37% | 26% | 23% | 33% |
| Has too many police | 16% | 11% | 2% | 2% | 8% |
Source: Pew Philadelphia Resident Survey, 2025
Conclusion
Philadelphians’ perceptions of their city have improved from the height of the COVID-19 pandemic, especially in the areas of public safety and crime prevention, although city residents still see room for improvement in those areas. They also generally approve of their new mayor’s performance as she enters her second year in office. Philadelphians seem clear-eyed about the complex challenges facing the city; but overall, they believe that the outlook is positive—a change from recent years.
Endnotes
- “Crime Data,” Philadelphia Police Department, 2024, https://www.phillypolice.com/crime-data/crime-statistics/.
- “Crime Data,” Philadelphia Police Department.
- “Crime Data,” Philadelphia Police Department.
- “Crime Data,” Philadelphia Police Department.
- Scott Clement and Dan Balz, “Big Majorities Support Protests Over Floyd Killing and Say Police Need to Change, Poll Finds,” The Washington Post, June 9, 2020, https://www.washingtonpost.com/politics/big-majorities-support-protests-over-floyd-killing-and-say-police-need-to-change-poll-finds/2020/06/08/6742d52c-a9b9-11ea-9063-e69bd6520940_story.html.
People


