What Waning Federal Disaster Aid Would Mean for State Budgets
Shifts in response and recovery responsibilities could pose fiscal challenges

Editor’s note: This map was updated on Nov. 12, 2025, to clarify that certain data is adjusted for inflation.
Overview
States play a critical and often overlooked role in paying for disaster costs, assisting communities and individuals and helping to cover cost shares required by federal relief programs. To cover these myriad costs, states draw from a range of funding sources, including dedicated disaster or emergency accounts, rainy day savings, and general fund revenue.
However, tapping these resources for an emergency can also mean directing funds away from other priorities, and policymakers increasingly face overlapping challenges related to paying for disasters.1 Not only are extreme weather events growing more frequent and expensive, but federal policymakers also are exploring ways to reduce the federal role in disasters and state budgets are tightening as pandemic-era surpluses disappear. Together, these shifts are prompting states to reconsider how they fund their efforts before, during, and after a disaster, collectively called “disaster assistance.” 2
To help policymakers across levels of government exercise sound fiscal planning amid a changing policy landscape, The Pew Charitable Trusts compared federal disaster assistance paid to states from 2003 to 2025 with recent state budget figures. The analysis uses newly available state-by-state data from the Carnegie Endowment for International Peace on a subset of federal disaster grants and from the National Association of State Budget Officers on state resources and spending, as tracked by Pew’s Fiscal 50 indicators.3 Although these data sources do not offer a comprehensive accounting of federal disaster aid to states or an exact measure of states’ fiscal exposure to disaster costs, they provide an opportunity to explore the scale of states’ historical reliance on federal disaster funding and their own fiscal capacity to respond to emergencies.4
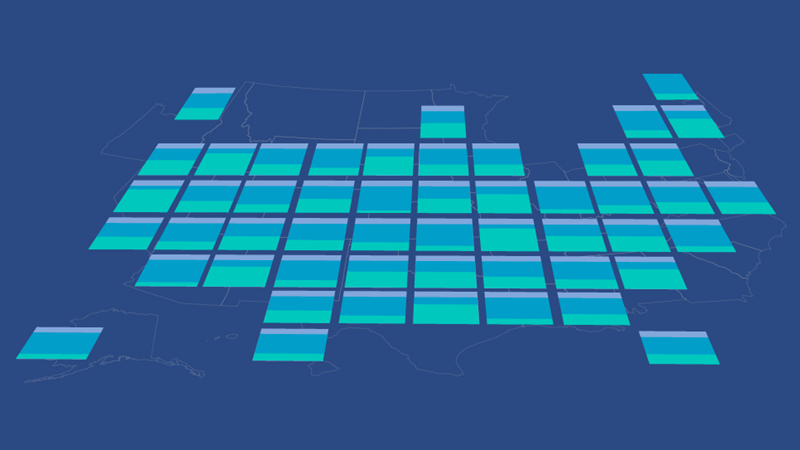
For each state, Pew looked at the highest single-year and average annual federal disaster aid received alongside total fiscal year 2024 reserves—which for purposes of this analysis includes only rainy day funds and excess general fund dollars—and fiscal 2024 general fund spending. (See Figure 1.) Comparing these metrics shows how a major crisis can drain savings and how much states have typically received in federal disaster aid as a share of their overall operating expenditures. Pew found that:
- In some states’ most catastrophic years, federal assistance was probably critical to avoiding exhaustion of their reserves. For instance, Vermont’s highest single-year federal disaster aid surpassed 90% of its savings.
- On average, federal disaster aid has been a small but meaningful share of state budgets—comparable to targeted investments that states make in key public services, such as child care assistance. The percentage ranged from 0.02% in Arizona to 18.91% in Louisiana.
These findings can help state and federal policymakers better understand trends in disaster assistance relative to state budgets as they consider changes to the roles that different levels of government play in disaster assistance. In the context of overlapping fiscal pressures, Pew recommends that states adopt proactive and resilient budgeting strategies, such as establishing dedicated disaster reserves, integrating disaster costs into long-term fiscal planning, and increasing transparency around spending.5 Additionally, as federal policymakers explore reducing the federal government’s role in disaster assistance, their deliberations should be grounded in a realistic assessment of the potential impact for state budgets.
Note: Federal disaster aid is adjusted for inflation.
The costliest disasters could deplete state reserves
Comparing the highest year of federal disaster aid with states’ reserves illustrates how dependent states are on federal support when extreme disasters strike and whether states’ own resources could realistically cover the costs of a worst-case scenario. Pew’s analysis indicates that while dependency on federal support varied significantly among states, overall, federal disaster aid for states’ most expensive events far exceeded what states had available in reserves. (See Figure 2.)
Importantly, Louisiana and Mississippi stand apart from other states in the magnitude of federal support they received, largely because of the devastating impacts of Hurricane Katrina in 2005, and so are not included in this analysis. Louisiana’s highest one-year federal aid totaled $31.8 billion—nearly 30 times the state’s reserve balance in 2024—and Mississippi’s $15.9 billion was 25 times its reserves. Although these states are omitted to provide more comparable data across states, Hurricane Katrina and the destruction these states endured also provide an important lesson about the essential nature of federal support when the worst events strike.
The remaining states show wide disparities in potential fiscal exposure. Vermont’s highest one-year federal aid equaled more than 90% of the state’s 2024 reserves, meaning that absent federal assistance or significant budget management action by state leaders, a comparable disaster in 2024 could have depleted almost all the state’s savings. Five other states—Colorado, Hawaii, Iowa, New Jersey, and New York—had one-year federal disaster aid that exceeded 50% of their available reserves. At the other end of the spectrum, federal disaster aid never exceeded 1% of reserves in Arizona, Delaware, or Wyoming during the 22-year period, and in 27 other states, the highest single-year aid amount fell below 20% of reserves.
Further, although historic federal aid and strong pandemic-era tax collections helped state rainy day funds reach record highs in in fiscal 2024—about 70% above pre-pandemic (fiscal 2019) levels—states would be unwise to expect similarly high balances in future years.6 And because many states’ reserves are primarily intended to buffer economic downturns, tapping them to fund disaster assistance could threaten states’ readiness for other unforeseen circumstances.7
Even small amounts of federal disaster aid can rival key state spending
In some states, average federal disaster aid reached levels typically associated with major state budget categories. Once again, Louisiana and Mississippi are excluded as outliers, having received 2024 disaster assistance equal to 18.9% and 11.1% of their general fund spending, respectively—figures that are comparable to national spending averages for Medicaid (18.7%) and higher education (9.4%).8
But for most states, the per-year average was less than 2% of general fund spending. (See Figure 3.) Florida’s share was the highest at 2.76%, and Arizona’s was the lowest at 0.02%. Although these percentages are low, important initiatives can be affected by even relatively small shares of state budgets. For instance, Alabama’s share—1.2%— is equivalent to the state’s recent spending on its Reading Initiative to increase K-12 literacy skills.9 And New York’s $1.8 billion annual spending on child care assistance—accounting for 1.7% of general fund expenditures—is roughly the same as its average annual federal disaster assistance received during the study period.10 Taken together, these figures show that historically, federal disaster aid has been comparable to significant state investments and highlights how changes to federal policy could move enough disaster funding onto state ledgers to prompt trade-offs with other critical spending priorities.
Conclusion
As states face growing disaster costs, declining revenue, and an uncertain federal funding landscape, the need to build more disaster-resilient budgets is greater than ever. At the same time, as federal policymakers weigh proposals to reduce disaster assistance to states, they will need to account for the availability of state resources relative to the federal aid they have historically received and recognize that even modest changes in state budgets can have significant effects on other key initiatives.
For their part, states can prioritize forward-looking budgeting practices, such as setting aside dedicated disaster reserves, integrating disaster costs into long-term fiscal planning, and improving transparency around spending to help ensure that they are prepared to respond to worst-case scenarios and manage their fiscal sustainability over time.
Methodology
The analysis uses two datasets: the Carnegie Endowment for International Peace’s database of funding from the Federal Emergency Management Agency’s Public Assistance Program and Individuals and Households Program and the Department of Housing and Urban Development’s Community Development Block Grant-Disaster Recovery from 2003 to 2025; and Pew’s Fiscal 50 indicators on state reserves and general fund expenditures for fiscal years 2003 to 2024, which in turn rely on data reported by states to the National Association of State Budget Officers. All spending figures have been adjusted for inflation to 2024 dollars.11
These datasets have some important limitations. The Carnegie Endowment’s data shows only a subset of federal programs. And although state general fund expenditures and reserves are important measures, they do not illustrate all of the resources that states have on hand to pay for disaster costs. For instance, states may use bonds or other financial instruments to obtain capital.
Pew researchers chose to compare historic disaster aid data with these state fiscal indicators to illustrate two specific dynamics. From a budgeting perspective, disaster costs can be understood as either one-time or ongoing expenses. Pew paired the largest federal disaster year with total reserves to show the one-time impact of a major disaster on a state’s primary general-purpose reserves, which are often—but not exclusively—used as the first line of defense against unexpected fiscal shocks. Similarly, Pew paired average annual disaster aid with general fund expenditures to show the relationship between two critical recurring financial flows that states must manage year over year: their typical disaster-related expenses and their ongoing, everyday expenses.
Expert reviewers
This brief benefited from the insights and expertise of outside reviewers Kathryn Vesey White, director of budget process studies, National Association of State Budget Officers, and Juliette Tennert, senior adviser, Kem C. Gardner Policy Institute, University of Utah. Although they have reviewed the brief, neither they nor their organizations necessarily endorse its findings or conclusions.
Acknowledgments
This brief was primarily authored by Pew staff members Jad Maayah, Peter Muller, and Colin Foard. The authors thank their colleagues who made this work possible, including Catherine An, Jennifer V. Doctors, Carol Hutchinson, Terri Law, Mathew Sanders, Drew Swinburne, Justin Theal, Sophie Jabés, and Alan van der Hilst for communications, editorial, and research support.
Endnotes
- The Pew Charitable Trusts, “How States Pay for Natural Disasters in an Era of Rising Costs,” 2020, https://www.pew.org/en/research-and-analysis/reports/2020/05/how-states-pay-for-natural-disasters-in-an-era-of-rising-costs.
- “Federal Emergency Management Agency Review Council,” U.S. Department of Homeland Security, https://www.dhs.gov/federal-emergency-management-agency-review-council. The Pew Charitable Trusts, “How a Pandemic-Era Surge in Tax Collections Drove a Revenue Wave—and What It Means for Future State Budgets,” 2024, https://www.pew.org/en/research-and-analysis/issue-briefs/2024/08/how-a-pandemic-era-surge-in-tax-collections-drove-a-revenue-wave. “What’s Driving the Boom in Billion-Dollar Disasters? A Lot,” Mathew Sanders, The Pew Charitable Trusts, Oct. 12, 2023, https://www.pew.org/en/research-and-analysis/articles/2023/10/12/whats-driving-the-boom-in-billion-dollar-disasters-a-lot.
- National Conference of State Legislatures, “State Policy Considerations for Disaster Risk and Resilience,” 2023, https://www.ncsl.org/environment-and-natural-resources/state-policy-considerations-for-disaster-risk-and-resilience. National Association of State Budget Officers, “2024 State Expenditure Report, Fiscal Years 2022-2024,” 2024, https://higherlogicdownload.s3.amazonaws.com/NASBO/9d2d2db1-c943-4f1b-b750-0fca152d64c2/UploadedImages/SER%20Archive/2024_SER/2024_State_Expenditure_Report_S.pdf. “Reserves & Balances,” The Pew Charitable Trusts, March 27, 2025, https://www.pew.org/en/research-and-analysis/data-visualizations/2014/fiscal-50/reserves-and-balances#4-notes.
- Other recent studies have addressed a similar research question around the potential effects of cuts to federal disaster assistance and state fiscal capacity using different methods. See Elena Krieger, “Facing Disaster Alone: FEMA Rollback Threatens to Overwhelm States,” Just Solutions, 2025, https://justsolutionscollective.org/wp-content/uploads/2025/06/FEMA-Rollback-Threatens-to-Overwhelm-States-Final.pdf. “The Trump Administration Wants to Shrink the Federal Government’s Role in Disaster Management. Do States Have the Fiscal Capacity to Weather the Storm?,” Urban Institute, 2025, https://www.urban.org/urban-wire/trump-administration-wants-shrink-federal-governments-role-disaster-management-do-states.
- The Pew Charitable Trusts, “How States Can Build Disaster-Ready Budgets,” 2025, https://www.pew.org/en/research-and-analysis/issue-briefs/2025/04/how-states-can-build-disaster-ready-budgets.
- “State Rainy Day Fund Growth Slowed in Fiscal 2024,” Justin Theal and Page Forrest, The Pew Charitable Trusts, March 27, 2025, https://www.pew.org/en/research-and-analysis/articles/2025/03/27/state-rainy-day-fund-growth-slowed-in-fiscal-2024.
- For more information on states’ use of reserves for disasters and other purposes, see The Pew Charitable Trusts, “How States Pay for Natural Disasters.”
- National Association of State Budget Officers, “2024 State Expenditure Report, Fiscal Years 2022-2024.”
- Trisha Powell Crain, “Alabama House Approves Record $12.2 Billion Education Budget Package,” Alabama Daily News, April 25, 2025, https://aldailynews.com/alabama-house-approves-record-12-2-billion-education-budget-package/.
- New York State Division of the Budget, “Governor Hochul Unveils Highlights of FY 2025 Executive Budget,” https://www.budget.ny.gov/pubs/press/2025/fy26-executive-budget.html. New York State Assembly, “2025-26 Assembly Budget Proposal,” 2025, https://nyassembly.gov/Reports/WAM/AssemblyBudgetProposal/2025/2025AssemblySummary.pdf.
- “Understanding FEMA Individual Assistance Versus Public Assistance,” Federal Emergency Management Agency, 2025, https://www.fema.gov/fact-sheet/understanding-fema-individual-assistance-versus-public-assistance. “Community Development Block Grant Disaster Recovery Grant Funds,” U.S. Department of Housing and Urban Development, 2025, https://www.hud.gov/hud-partners/community-cdbg-dr. “Tracking U.S. Federal Disaster Spending: The Disaster Dollar Database,” Carnegie Endowment for International Peace, 2025, https://carnegieendowment.org/features/disaster-dollar-database. “Fiscal Survey of States,” National Association of State Budget Officers, https://www.nasbo.org/reports-data/fiscal-survey-of-states. “Reserves & Balances,” The Pew Charitable Trusts.


