Modern Multifamily Buildings Provide the Most Fire Protection
Rate of fire death in modern apartments is one-sixth the rate of single-family houses and older apartment buildings

Overview
A large body of research has demonstrated that apartment buildings and other types of multifamily housing can provide many benefits to a community, especially when built in high-demand areas where housing is badly needed. Multifamily housing can boost economic opportunity and foster growth while improving affordability; by increasing the availability of housing near jobs, stores, and transportation, it can also reduce commute times, traffic, energy consumption, and water usage. The United States is also experiencing both a nationwide housing shortage and record levels of homelessness. More multifamily housing can help address both problems.1
But many barriers to multifamily construction make it difficult—and expensive—to build. Fire safety concerns are among them. These concerns stem partly from design features inherent to multifamily housing—more kitchens, and more heating and electrical equipment that can pose fire hazards. And simply because there are more residents, there is an increased potential for there to be tenants who use hazardous materials such as cigarettes or lithium-ion battery-powered vehicles (i.e., e-bikes and e-scooters). There are also concerns, particularly in high-rises, about firefighter access and the ability of residents to escape from upper floors during a fire. Beyond design, critics of multifamily housing have expressed concern about demographic factors, such as concentrations of older or lower-income residents, that have been associated with increased fire risk.2

However, these concerns are largely not supported by research, and, in fact, multifamily housing in the U.S. has been getting safer over time. Fire safety researchers have documented a downward trend in the number of injuries and deaths in apartment building fires since 1980.3 The rate of deaths in multifamily buildings, for example, fell from 7.1 deaths per 1,000 reported fires in 1980 to 5.2 deaths per 1,000 fires in 2023, a lower rate than in single-family homes.4 But to date, there has been little research on the relative fire safety of modern (post-2000) multifamily housing in the United States compared with other types of housing. New research from The Pew Charitable Trusts now demonstrates that multifamily buildings constructed since 2000 enjoy far better fire safety outcomes than other types of housing, because additional safety measures, such as self-closing doors, fire-safe materials, and sprinklers have been adopted widely. Yet, restrictive zoning codes severely limit where apartments can be built. Cumbersome and uncertain permitting processes drive up costs. Concerns about fire safety likewise inhibit construction even when research demonstrates that those concerns are misplaced: In almost every jurisdiction in the U.S., building codes mandate that four-to six-story apartment buildings have two separate stairways, making it difficult to fit them on urban lots, even though buildings with single staircases are as safe as two-stair buildings.5 (For more information on single-stair buildings, see the 2025 Pew and Center for Building in North America report, “Small Single-Stairway Apartment Buildings Have Strong Safety Record.”) 6
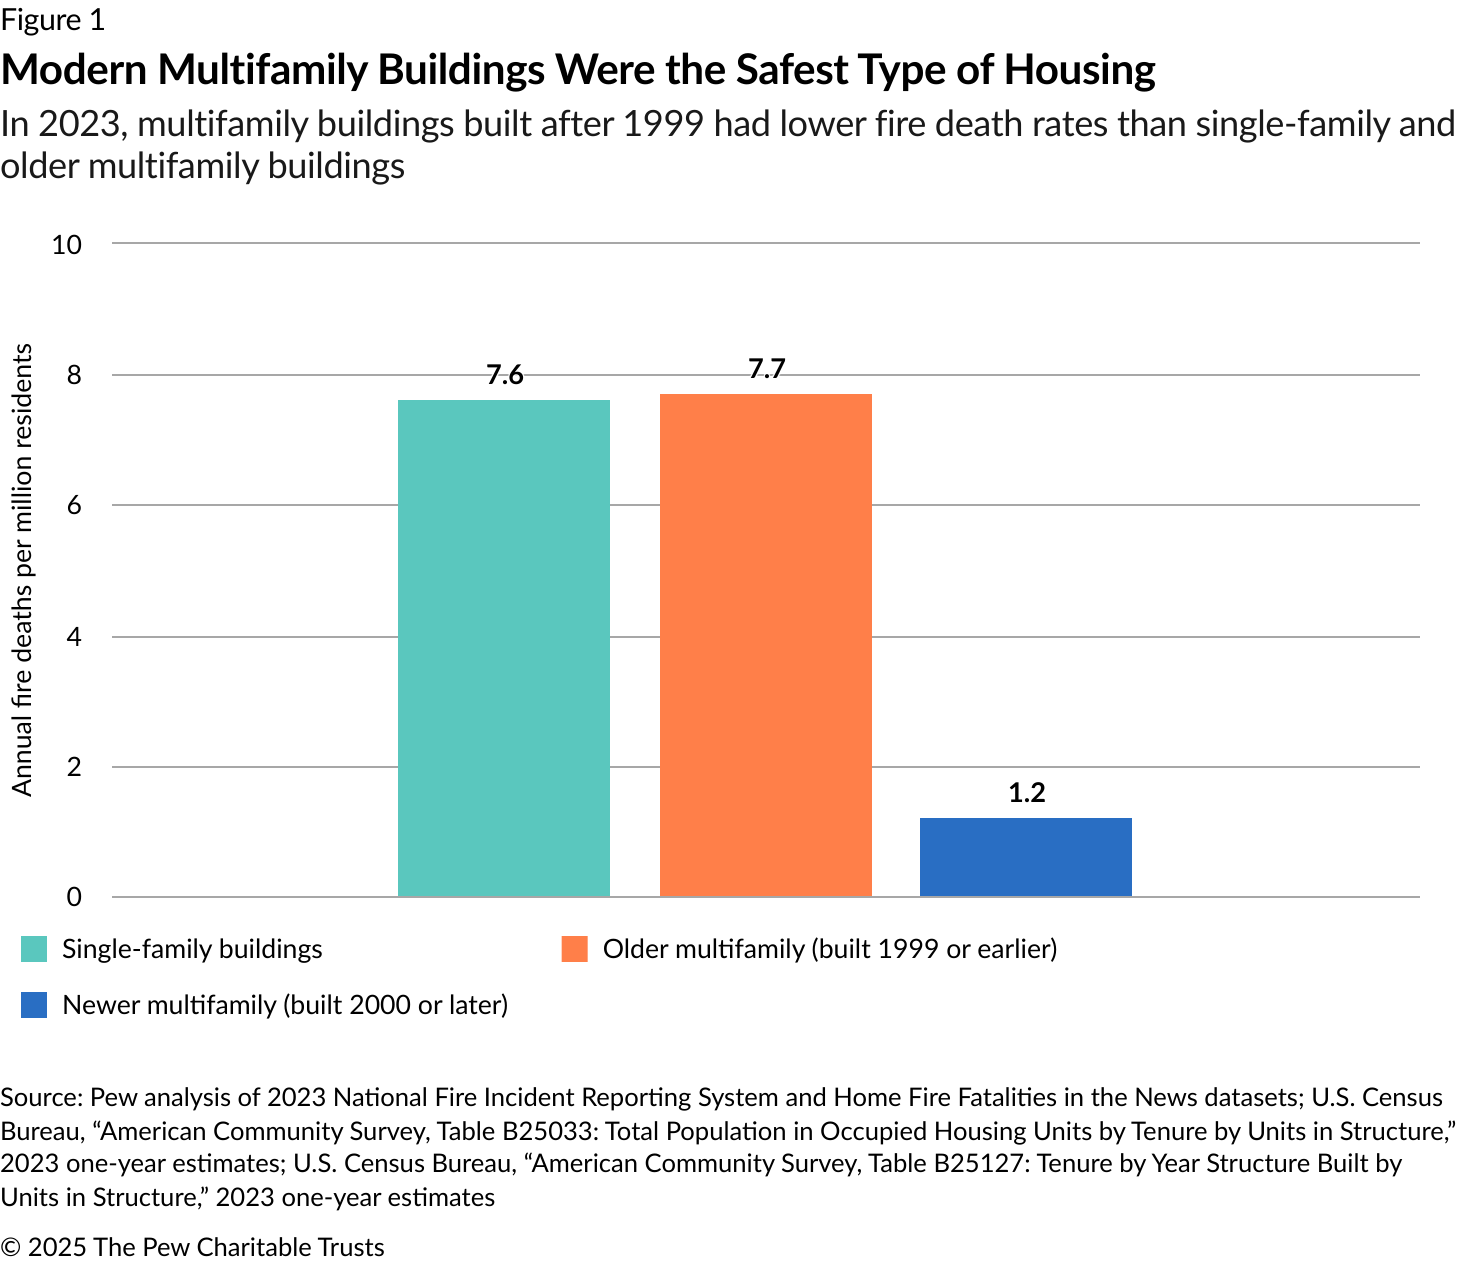
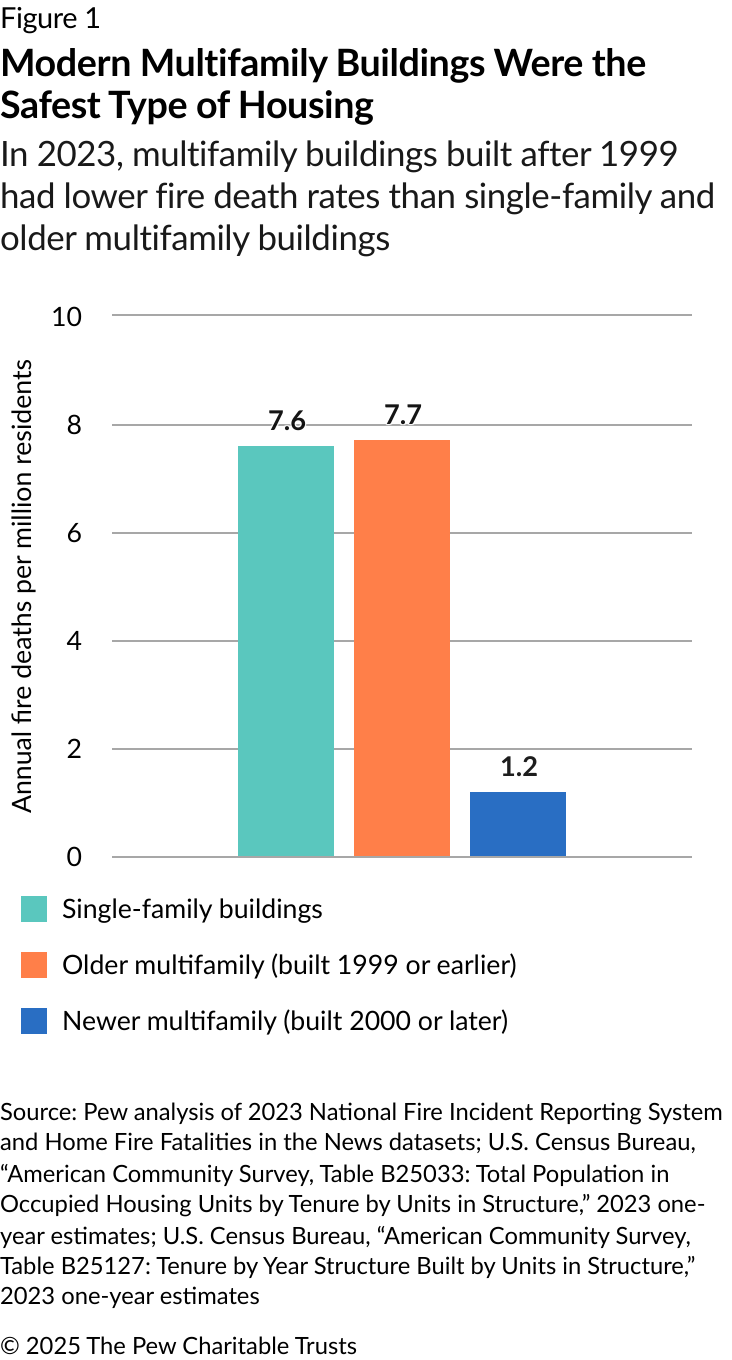
For this report, Pew tracked all publicly reported residential fire deaths in the United States in 2023 (the most recent year for which extensive data is available). Pew found that the fire death rate in modern multifamily buildings nationwide was less than one-sixth the rate found in both single-family homes and pre-2000 apartment buildings. The fire death rate for modern apartments was 1.2 per million residents in 2023, compared with 7.6 per million residents in single-family homes and 7.7 per million in older apartments. The new multifamily fire death rates are lower in both small and large apartment buildings. In all but one case, state-level fire death rates were also lower in new multifamily buildings, demonstrating the consistency of this result across regions.
This research indicates that building more new multifamily buildings would reduce fire deaths. What’s more, multifamily buildings are less likely than single-family homes to be built in areas prone to wildfires, which would further reduce fire death rates.7
The key findings from Pew’s research are:
- Modern multifamily housing has a fire death rate one-sixth the rate of single-family homes and multifamily housing built before 2000.
- 6% of Americans live in modern apartments, but only 1% of residential fire deaths in 2023 occurred in these buildings.
- The fire death rate for modern multifamily buildings was less than one-fourth the rate in modern single-family homes.
- The results were similar across multiple states, indicating a consistent trend.
- The 2023 results show the same pattern as data examined for certain states from 2013 to 2024, demonstrating that 2023 was not an outlier.
- Modern single-family homes are also much safer than older ones. Single-family homes built since 2010 have a fire-death rate that is one-third the death rate of homes built prior to 1970.
Multifamily buildings have lower fire death rates than single-family homes
Prior research has examined fire safety outcomes in both multifamily and single-family housing in the United States. Most of that research has focused on the relative deadliness of fires when they occur—how many fatalities there were compared to the number of fires—according to building type. The number of deaths per 1,000 fires has decreased sharply in multifamily buildings since 1980, but not in one- or two-family homes.8 There has been little research comparing fire death rates in modern buildings to death rates in older buildings and different types of homes.

For this report, researchers attempted to identify every residential fire death in the United States in a single year, 2023 (the most recent for which comprehensive data was available). Two U.S. Fire Administration datasets were used to identify fatal fires: the National Fire Incident Reporting System (NFIRS), a voluntary reporting system used by local fire departments; and Home Fire Fatalities in the News (USFA Media), a daily scan for media mentions of fatal fires.9 Researchers then used property and building records to identify the type of housing in which each death occurred—both the number of units and the year of construction.10 (Where public records indicated that the building had been updated significantly, the year in which the remodeling occurred—the “effective construction” year—was used.) Researchers excluded deaths in which the fire was caused by arson or occurred in a nonresidential structure, or if the death was not fire-related (i.e., homicide). (For a full description of the methodology, see the Appendix.)
After excluding non-valid fire incidents, researchers identified 1,969 fatal residential fire incidents: 1,641 in single-family homes and 328 in multifamily buildings. In total, 2,377 people died in a residential fire in 2023—1,985 in single-family homes and 392 in a multifamily structure (two units or more).
To understand the effect of age and modern construction materials and techniques, researchers looked separately at single-family and multifamily homes, and at older and newer (“modern”) buildings. Modern buildings were defined as those that were constructed or substantially remodeled in or after 2000. This date was chosen because before 2000, there was not a consistent, national model building code that was adoptable across states, and many states had differing codes that could vary by region or jurisdiction. Starting in 2000, local and state governments began adopting building codes published by the International Code Council (ICC). The ICC, a U.S.-based nonprofit organization that serves building safety professionals and facilitates the development of model codes, publishes two model codes of its own: the International Residential Code (IRC), which covers most one- and two-family dwellings, including townhouses; and the International Building Code (IBC), which generally covers all other buildings, including commercial structures and residential buildings with three or more homes. Most countries, however, don’t use the IRC or the IBC. The U.S. is by far the most populous country that uses the ICC’s codes; they are also used as the basis for building codes in several other countries, including nations in the Caribbean and Middle East.
Researchers estimated the number of Americans living in each type of housing with data from the American Community Survey (ACS) and calculated an annual fire fatality rate per million residents. Analysis at the per-resident level was chosen (rather than per unit, as in many previous studies) because single-family homes have more occupants per dwelling unit than multifamily buildings. In 2023, the annual fire fatality rates for single-family homes and older multifamily homes were roughly equivalent, at 7.6 and 7.7 deaths per million, respectively. In contrast, the annual fire fatality rate for newer multifamily homes was 1.2 deaths per million, a difference that was statistically significant when compared with death rates in single-family homes and older multifamily buildings. (See Figure 1.)
A large majority of both fatal fires (1,641 or 83%) and fire deaths (1,985 or 84%) in 2023 occurred in single-family homes. Although 6% of Americans lived in modern multifamily housing, only 1% of fire-related deaths occurred there. (See Table 1.)
Table 1: The Fire Death Rate in Modern Apartments Was Less Than One-Sixth the Death Rate in Other Housing Types
Multifamily homes built in 2000 or later were safer than other housing in 2023
| Single-family homes | Older multifamily (built before 2000) | Modern multifamily (built in 2000 or later) | |
|---|---|---|---|
| Fatal fire incidents | 1,641 | 308 | 20 |
| Deaths | 1,985 | 369 | 23 |
| Share of fatal fires | 83% | 16% | 1% |
| Share of fatal fire deaths | 84% | 16% | 1% |
| Share of housing stock | 74% | 19% | 7% |
| Share of Americans living in each type of housing | 80% | 15% | 6% |
| Number of occupants | 259,510,510 | 47,944,526 | 18,904,677 |
| Annual fire death rate, per million occupants | 7.6 | 7.7 | 1.2*** |
Note: ***(P-value) The lower rate of fire deaths in modern apartments was a highly statistically significant difference, when compared with both single-family and older multifamily death rates (p <0.001).
Source: Pew analysis of 2023 National Fire Incident Reporting System and Home Fire Fatalities in the News datasets; U.S. Census Bureau, “American Community Survey, Table B25033: Total Population in Occupied Housing Units by Tenure by Units in Structure,” 2023 one-year estimates; U.S. Census Bureau, “American Community Survey, Table B25127: Tenure by Year Structure Built by Units in Structure,” 2023 one-year estimates
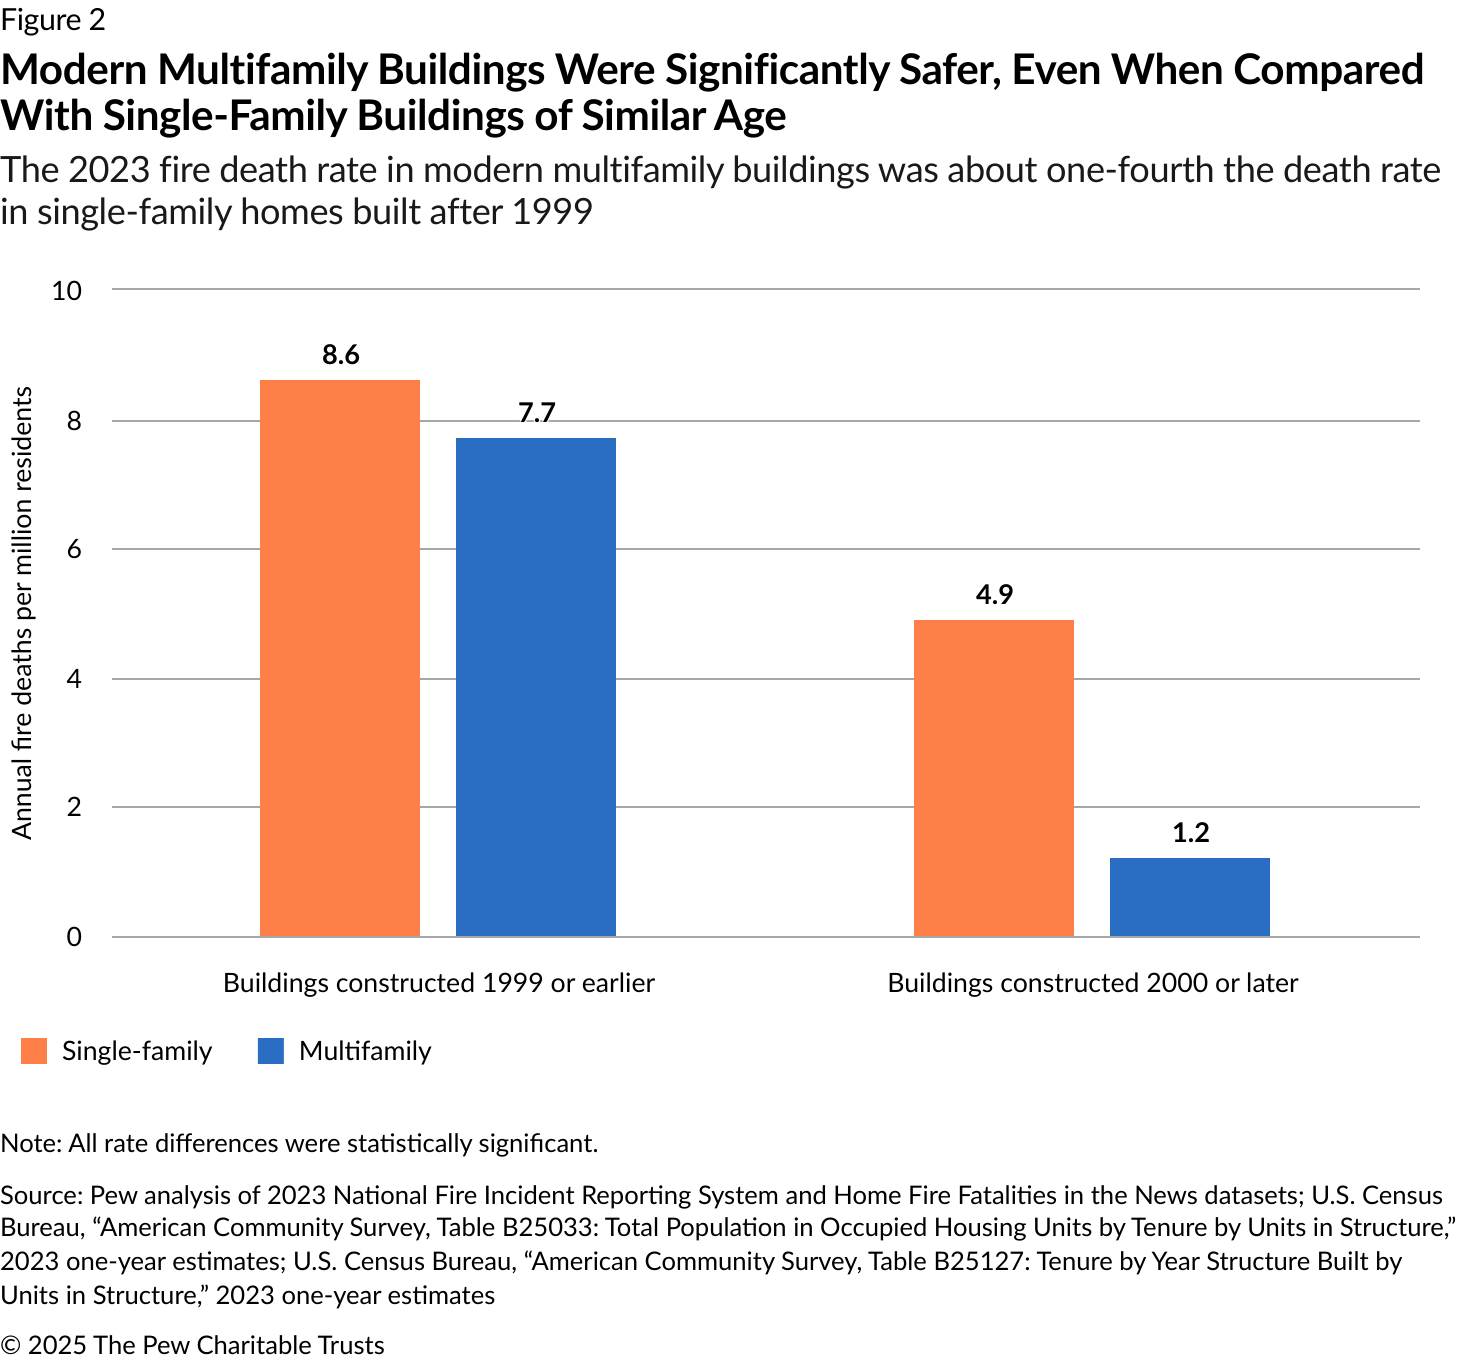
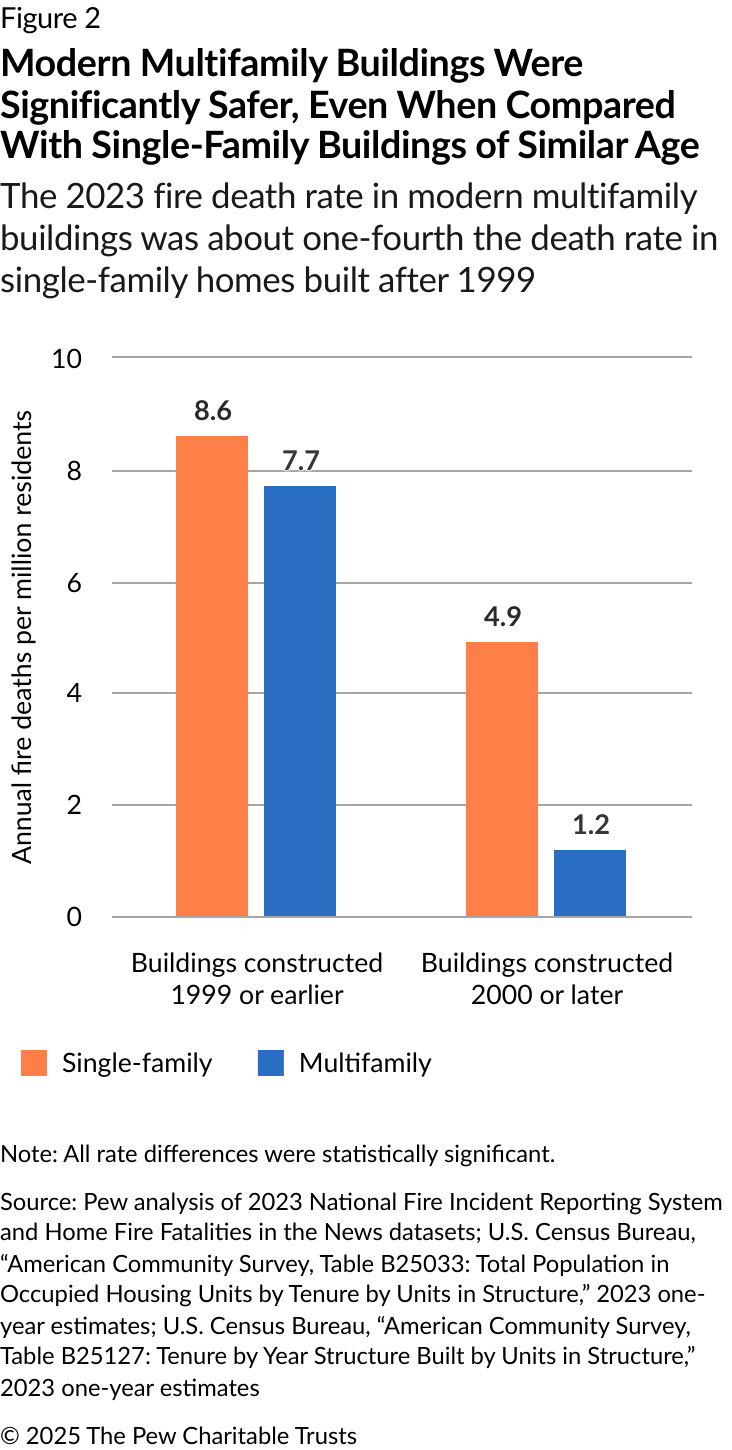
Multifamily homes were safer than single-family homes even when building age was taken into account. When researchers categorized single-family buildings by age (with modern homes defined as those built in or after 2000 and older homes defined as those built before 2000) and recalculated the death rates, the death rate in older single-family homes (8.6 deaths per million occupants) was higher than the death rate in older multifamily housing (7.7 deaths per million occupants), with that difference being statistically significant. But the difference in modern housing was more striking: Although modern single-family homes had a much lower death rate than older single-family homes, the fire death rate in modern multifamily buildings was just one-fourth the death rate in modern single-family homes (1.2 deaths per million occupants versus 4.9 deaths per million occupants in modern single-family homes). This difference was highly significant statistically. The discrepancy in death rates between the two types of buildings, even those of similar age, suggests that the reduction in fatalities was not solely due to the newness of multifamily buildings, but rather to differences in design and construction standards that led to differing safety outcomes. Those differences include a higher penetration of operable smoke alarms in multifamily housing, greater compartmentation, sprinkler mandates, self-closing doors, and fire-safe materials.
Modern multifamily buildings had the best fire safety record across states
To understand whether geographical differences affected fire safety and whether national data might be obscuring results that varied by state, researchers calculated fire death rates for the 19 states that had 50 or more fire-related deaths in 2023. By focusing on states with the most deaths, researchers sought to avoid potential anomalies that might come with small sample sizes.
State-level analysis yielded similar results to the national findings: Modern multifamily housing was substantially safer than older multifamily housing or single-family homes in 2023. Of the 19 states that experienced 50 or more deaths, 18 had lower fire death rates in modern multifamily buildings than in single-family homes. Michigan was the only state where the death rate in new multifamily buildings exceeded the single-family death rate, but this difference was not statistically significant. Multifamily fire death rates were also lower in every state except Michigan for buildings constructed since 2000, compared with those built before 1999. (See Table 2.)
There was substantial variation in fire death rates by state, which could be due to the stringency of building codes, age and upkeep of the housing stock, fire service funding and preparedness, and numerous other factors. There may be additional variation between urban and rural areas within states. However, while death rates differed from state to state, the overall trend was clear: Newer multifamily housing had substantially lower fire death rates than single-family homes or older multifamily buildings.
Table 2: New Multifamily Housing Was Typically Much Safer Than Other Homes
In 2023, this pattern held across nearly all states examined
| State | Fire death rate, single-family, per million residents | Fire death rate, older multifamily (1999 or earlier), per million residents | Fire death rate, newer multifamily (2000 or later), per million residents | Total fire deaths in 2023 |
| AL | 15.3 | 10.7 | 0.0 | 71 |
|---|---|---|---|---|
| CA | 2.6 | 3.3 | 0.5 | 100 |
| FL | 3.9 | 4.0 | 0.6 | 80 |
| GA | 10.3 | 4.5 | 3.1 | 101 |
| IL | 7.8 | 11.1 | 3.2 | 101 |
| IN | 9.1 | 17.2 | 4.2 | 65 |
| KY | 12.1 | 12.1 | 0.0 | 51 |
| LA | 14.5 | 10.0 | 5.3 | 61 |
| MI | 11.9 | 6.1 | 12.5 | 111 |
| NC | 9.3 | 9.1 | 0.0 | 91 |
| NJ | 7.3 | 8.2 | 1.7 | 65 |
| NY | 7.9 | 7.4 | 2.3 | 139 |
| OH | 9.7 | 14.8 | 2.6 | 116 |
| OK | 13.3 | 19.4 | 0.0 | 52 |
| PA | 10.0 | 11.3 | 0.0 | 124 |
| SC | 14.4 | 11.2 | 0.0 | 70 |
| TN | 15.2 | 24.0 | 2.7 | 107 |
| TX | 4.9 | 4.9 | 0.4 | 135 |
| WA | 7.6 | 10.0 | 0.0 | 56 |
| National | 7.6 | 7.7 | 1.2 | 2,377 |
Note: The share of housing stock that was newer multifamily (constructed 2000 or later) in 2023 for each state was: Alabama, 6%; California, 7%; Florida, 10%; Georgia, 6%; Illinois, 6%; Indiana, 5%; Kentucky, 6%; Louisiana, 6%; Michigan, 4%; North Carolina, 9%; New Jersey, 8%; New York, 8%; Ohio, 5%; Oklahoma, 5%; Pennsylvania, 4%; South Carolina, 7%; Tennessee, 7%; Texas, 11%; Washington, 10%.
Source: Pew analysis of 2023 National Fire Incident Reporting System and Home Fire Fatalities in the News datasets; U.S. Census Bureau, “American Community Survey, Table B25033: Total Population in Occupied Housing Units by Tenure by Units in Structure,” 2023 one-year estimates; U.S. Census Bureau, “American Community Survey, Table B25127: Tenure by Year Structure Built by Units in Structure,” 2023 one-year estimates
Because more populous states typically have more fire-related deaths than less-populated states, focusing on states with 50 or more deaths in a single year meant concentrating heavily on higher-population states. To expand the geographic comparisons further, researchers looked at fire deaths for other years in states where fewer than 50 people had died in 2023, examining as many years as was necessary to observe at least 50 residential fire fatalities. This expansion allowed researchers to analyze a wider variety of states, including some that are less populated and heavily rural.
For those additional states of varied size, population, and geography, researchers collected data on fire fatalities from more years to see if a similar pattern emerged. In 10 out of 14 states, the death rate from fire was highest in single-family homes. (See Table 3.) In 13 out of 14 states, the death rate was lowest in multifamily homes constructed since 2000. Across the 14 states, researchers tracked 905 total deaths. Only six—less than 1%—occurred in a multifamily building constructed since 2000. These findings demonstrate that this pattern of modern multifamily housing having the best fire safety record holds across states in every region of the country, including those that are mostly urban and those that are mostly rural. Limitations in the available data prevent analysis of variations between urban and rural areas within states.
Table 3: Fire Deaths Are Very Rare in Modern Multifamily Buildings
Historical data confirms fire safety record of new multifamily buildings across multiple years
| State | Annual fire death rate, single-family, per million residents | Annual fire death rate, older multifamily (1999 or earlier), per million residents | Annual fire death rate, new multifamily (2000 or later), per million residents | Total deaths from years collected |
| AZ | 4.3 | 6.4 | 0.0 | 62 |
|---|---|---|---|---|
| CO | 2.7 | 2.5 | 1.1 | 59 |
| DE | 10.3 | 7.1 | 0.0 | 58 |
| HI | 3.0 | 4.1 | 0.0 | 51 |
| MA | 5.8 | 4.7 | 0.0 | 69 |
| MD | 7.3 | 4.8 | 1.5 | 80 |
| ME | 10.6 | 7.5 | 0.0 | 67 |
| MT | 8.0 | 6.2 | 0.0 | 58 |
| NM | 8.3 | 2.8 | 0.0 | 62 |
| RI | 6.5 | 3.2 | 0.0 | 50 |
| UT | 2.7 | 2.9 | 0.0 | 60 |
| VA | 5.0 | 3.2 | 0.0 | 77 |
| WI | 7.8 | 10.8 | 3.0 | 92 |
| WY | 9.3 | 4.0 | 4.6 | 60 |
| Totals | 784 deaths | 115 deaths | 6 deaths | 905 deaths |
Note: Results include National Fire Incident Reporting System (NFIRS) and Home Fire Fatalities in the News (USFA Media) for 2023 and earlier, but only USFA Media for 2024 because NFIRS data for 2024 was not available at time of analysis. To collect at least 50 deaths for each state in Table 3, data was collected from the following years: Arizona, 2023 and 2024; Colorado, 2021-24; Delaware, 2019-24; Hawaii, 2013-24; Maine, 2020-24; Maryland, 2023 and 2024; Massachusetts, 2023 and 2024; Montana, 2018-24; New Mexico, 2021-24; Rhode Island, 2016-24; Utah, 2018-24; Virginia, 2023 and 2024; Wisconsin, 2023 and 2024; Wyoming, 2013-24. The share of housing stock that was newer multifamily (constructed 2000 or later) in 2023 for each state was: Arizona, 8%; Colorado, 11%; Delaware, 5%; Hawaii, 6%; Maine, 3%; Maryland, 7%; Massachusetts, 7%; Montana, 6%; New Mexico, 5%; Rhode Island, 4%; Utah, 10%; Virginia, 8%; Wisconsin, 8%; Wyoming, 5%.
Source: Pew analysis of National Fire Incident Reporting System and Home Fire Fatalities in the News datasets; U.S. Census Bureau, “American Community Survey, Table B25033: Total Population in Occupied Housing Units by Tenure by Units in Structure,” 2023 one-year estimates; U.S. Census Bureau, “American Community Survey, Table B25127: Tenure by Year Structure Built by Units in Structure,” 2023 one-year estimates
Modern multifamily buildings are far safer than older multifamily buildings
Newer buildings are generally safer from fire than older buildings—much safer. Both multifamily and single-family buildings developed since 2000 have lower fire death rates than older ones. (See Figure 2.)
To understand the effect of building age on fire mortality rates, researchers sorted all 2,377 fire deaths in 2023 according to the decade of original construction (or, if the building was remodeled significantly, its year of remodeling, or “effective construction” year).11
The fire death rates for both single- and multifamily housing are very similar for homes built up until 1980, after which multifamily begins to show a greater reduction in fire deaths. This increasing gap in death rates is in line with research from the National Fire Protection Association (NFPA) on fire death trends since 1980, which shows that the rate of deaths per incident has declined in multifamily housing, while the rate in one- and two-family homes has not.12
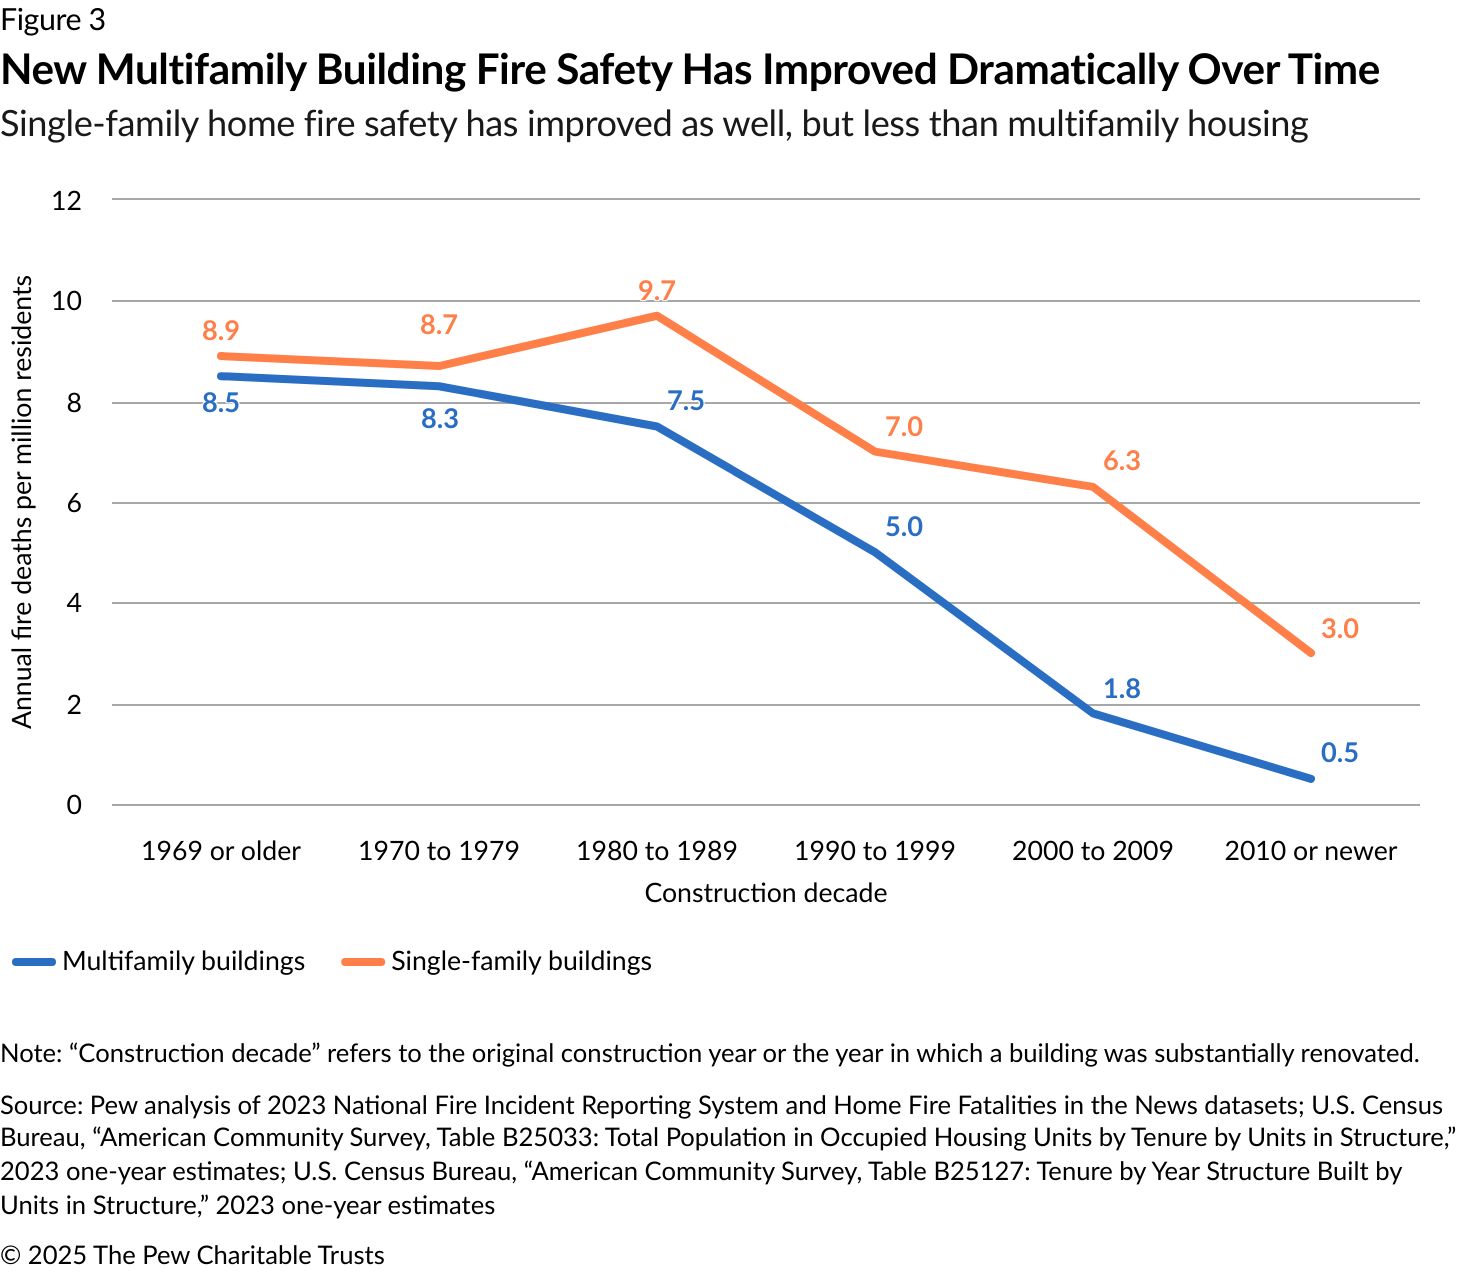
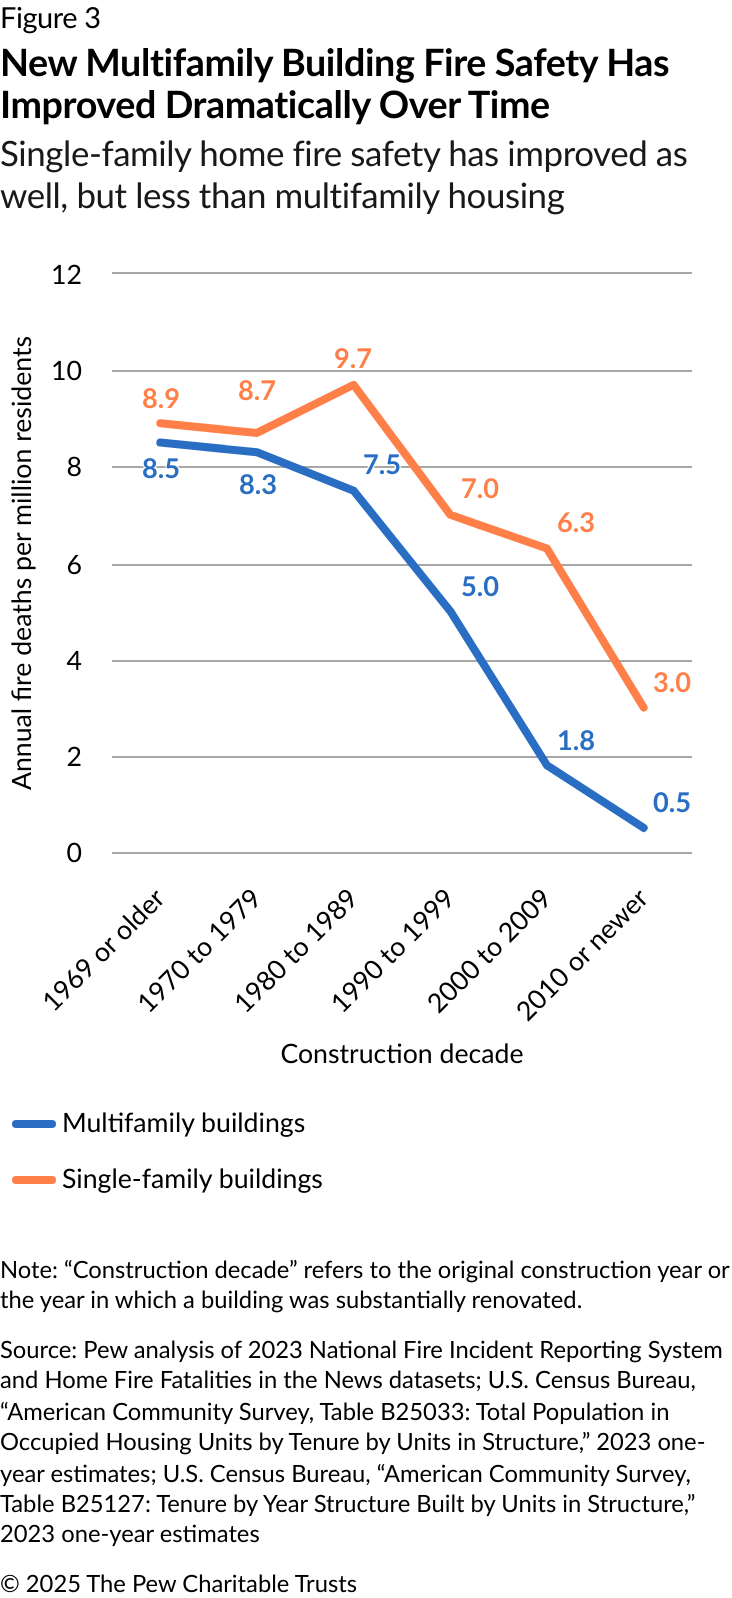
Pew’s research on fire deaths in 2023 shows that fire death rates decreased for all housing types built since 1970, but the post-2000 construction drop was most striking for multifamily buildings. Multifamily housing built since 2010 had a fire death rate of 0.5 per million occupants, about one-fifteenth the fire death rate in either single-family homes (7.6 per million) or pre-2000 apartments (7.7 per million). Put another way, among the roughly 8.3 million Americans who lived in apartments built since 2010, just four died in a residential fire in 2023. Far more people—at least 20—died in homelessness-related fires than in fires in apartments built since 2010.13
If the 340 million people in the U.S. all lived in old multifamily buildings or single-family homes, there would be roughly 2,600 expected residential fire deaths per year, compared with a little more than 400 if the entire population lived in modern multifamily buildings; the projected number would be fewer than 200 if everyone lived in multifamily housing built in 2010 or later. Each additional percentage point of the population that lived in modern multifamily housing would save roughly 22 lives per year from fire deaths.
New multifamily buildings are fire-safe regardless of building size
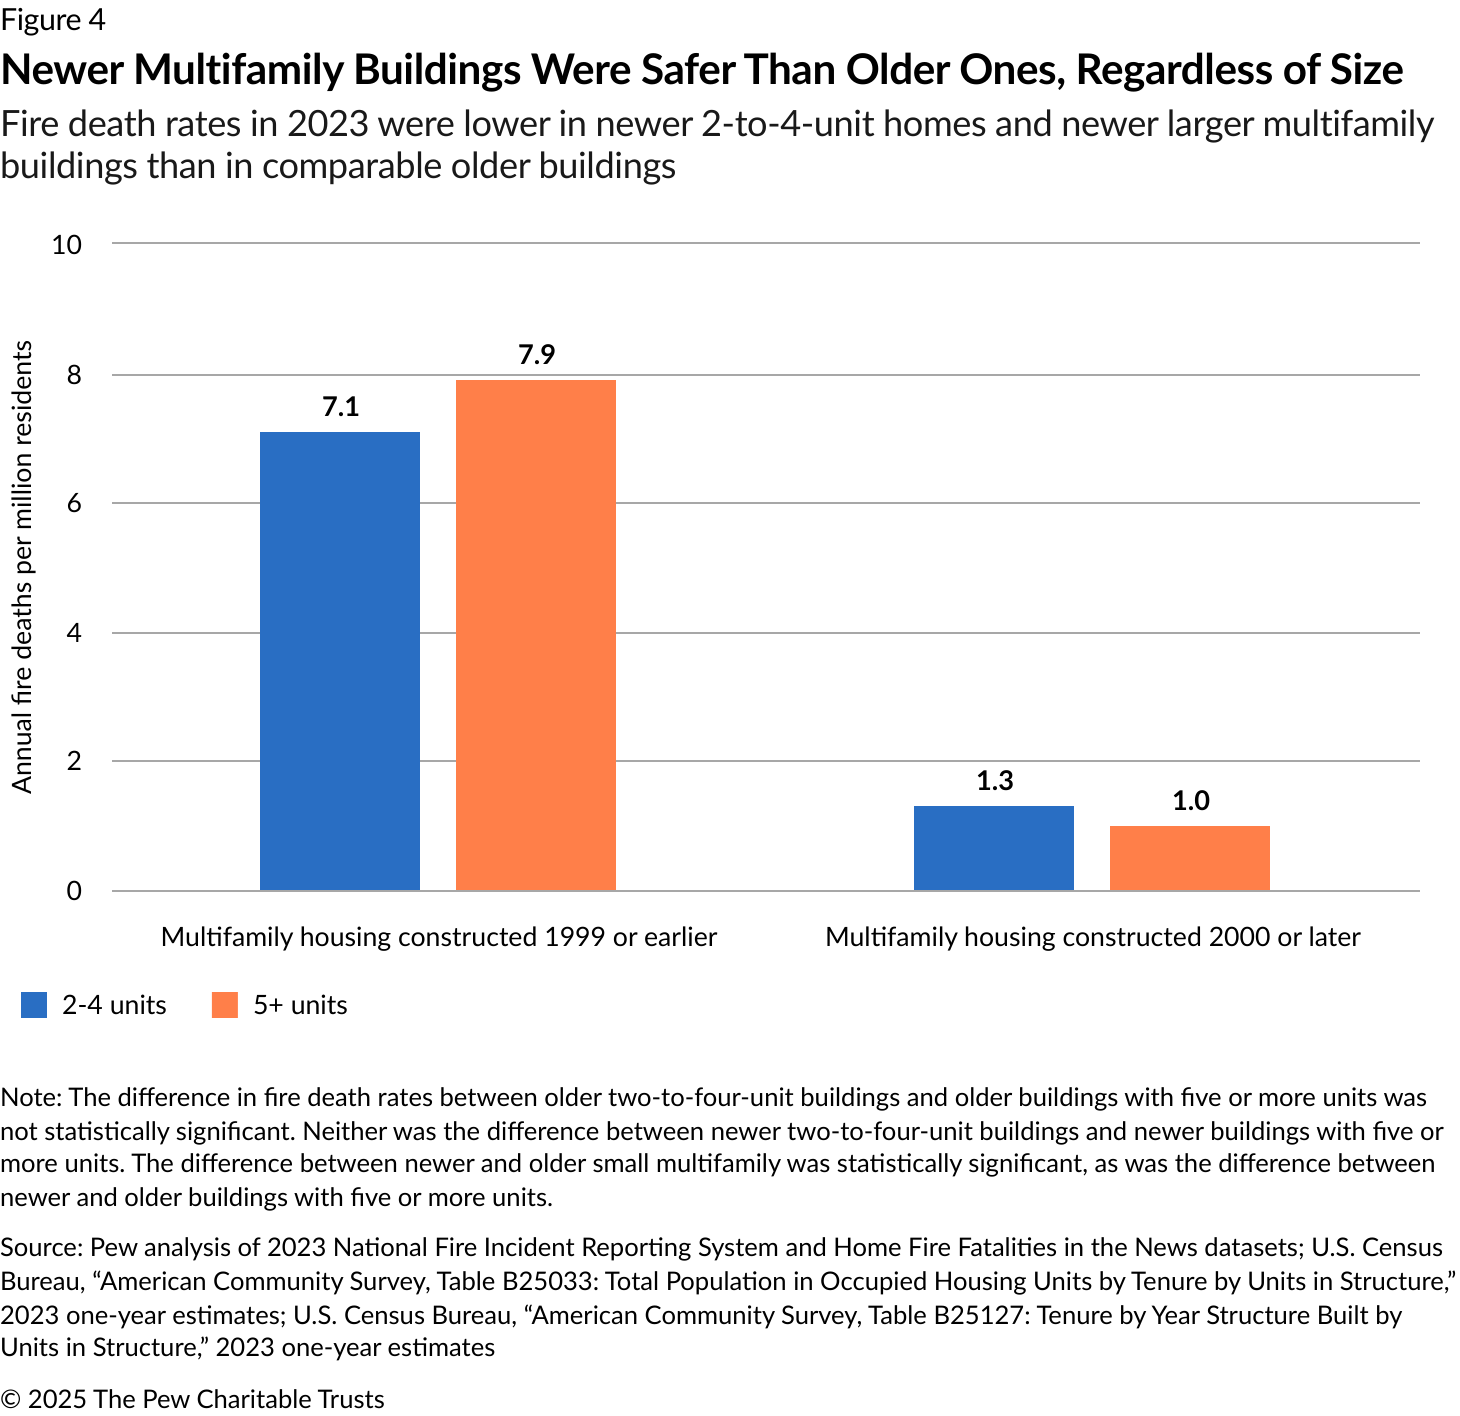
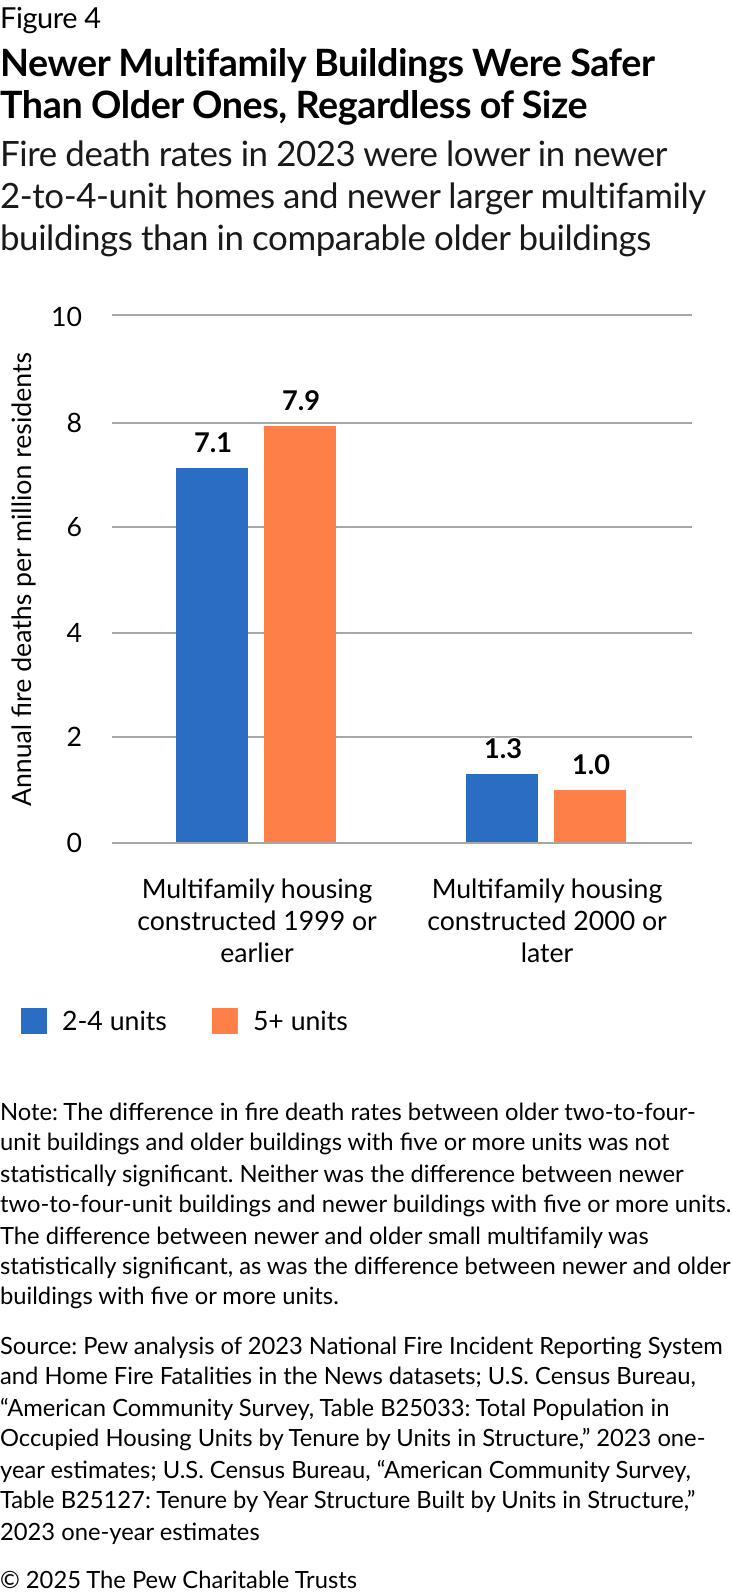
About 30% of all multifamily housing units in the United States are in smaller buildings with just two to four homes (duplexes, triplexes, and fourplexes). These buildings tend to be older than larger multifamily buildings because restrictive building codes and zoning codes have made it difficult to build new, small multifamily housing. Only one-sixth of the country’s two-to-four-unit buildings have been built since 2000, while nearly one-third of buildings with five or more units were constructed in the past 25 years.14
Two-unit buildings (duplexes) in the United States are generally regulated under the IRC, while buildings with three units or more are usually regulated under the IBC.15 Other than California, Maryland, and Washington, D.C., states that adopt the IRC do not require sprinklers for duplexes. High-rise multifamily buildings (usually at least seven stories or 75 feet tall) are subject to additional safety requirements, including compartmentation; the use of different, fire-resistant construction materials; and active protection systems like sprinklers, alarms, and smoke control devices.16 (Compartmentation refers to design and construction methods that divide a building into smaller fire-resistant compartments or sections to help prevent the spread of smoke and fire.)
Despite falling under very different building codes, both two-to-four-unit and larger multifamily buildings have had significant improvements in fire death rates since 2000. (See Figure 4.) This broad improvement indicates that, within multifamily buildings, construction year is a more important factor in fire safety than building size.
Why do newer multifamily buildings have the lowest death rates?
There are many possible reasons for the sharp reduction in the fire death rate in modern multifamily buildings in the United States. This section examines the role of the national model building code, sprinklers, smoke alarms, and other construction improvements, as well as resident demographics, including age and income. It is beyond the scope of this paper to determine exactly why modern multifamily housing has a much stronger fire-safety performance record than other types of homes. Instead, the purpose of this research is to identify which type of housing has the best fire safety record and examine whether it’s the buildings themselves or other characteristics that drive those outcomes.
National model building code adoption. One potential cause for the low rate of fire deaths in modern multifamily buildings is the widespread adoption of safety features, such as sprinklers, that were added to building codes, many of them between 2000 and 2010. Although versions of a model building code have existed since the mid-1800s, for most of U.S. history, building codes (and safety standards) varied greatly by region and jurisdiction.17 That began to change with the establishment of the ICC in 1994.18 Organized specifically to issue model codes for adoption by states and municipalities, the ICC published the first editions of the IRC and IBC in 2000. States began adopting those codes that same year, with a majority adopting the IBC for multifamily housing within four years of the first IBC publication.19

Although widespread adoption of uniform codes may explain why modern multifamily buildings have lower fire death rates than older multifamily buildings, the difference in fire safety performance between multifamily and single-family construction may lie in the fact that the ICC does not treat single-family homes and multifamily buildings the same: Multifamily buildings have stricter safety requirements. The IBC covers a broad range of building types, so comparing it with the residential code (the IRC) can be difficult. However, even the smallest multifamily buildings that fall under the IBC are subject to more stringent requirements than buildings covered by the IRC: requirements to use fire-resistant construction materials; requirements for “fire-rated” (fire resistant) construction assemblies for interior walls and floors between adjoining units; the use of balanced supply/exhaust ventilation systems; fire-rated exterior walls; self-closing doors for each unit; and other design elements.20
Sprinklers. Most significantly, the IBC requires sprinklers—which have been shown to greatly improve safety outcomes—for all newly built or remodeled multifamily buildings. The IRC also requires sprinklers in new single-family homes, but most states override this requirement because of sprinklers’ cost, relative to their perceived benefits, in single-family homes.
Sprinklers, when installed, are highly effective. A 2024 NFPA study on the impact of sprinklers found that they effectively control fire in 98% of residential incidents and contain fire to the room of origin 96% of the time.21 This study found that the fire death rate is 90% lower in properties with sprinklers than in buildings without sprinklers; the injury rate for both residents and firefighters is also lower, as is property damage.22 But sprinklers were present in just 8% of homes and apartment buildings that had a reported fire incident.23 Sprinklers are mandatory only for new multifamily construction nationally, and new single-family construction in Maryland, California, and Washington, D.C.
Some research has found that sprinkler mandates do not pass cost-benefit analyses for single-family homes. For example, a 2023 study in Massachusetts found a negative net value for the installation of sprinklers in new construction one- and two-family homes, with costs exceeding benefits by $7,000 per home, on average.24 The study pointed to barriers, such as restrictive sprinkler installation licensing requirements, that contributed to the high cost of sprinklers in Massachusetts, and suggested incentives like tax deductions and insurance discounts to help lower costs.25 A 2024 New York state study estimated the total cost of installing sprinklers in single-family homes to range from $23,963 in Utica to $33,327 in New York City.26 This additional cost amounts to more than 62% of a builder’s typical profit margin, suggesting that sprinkler mandates could reduce housing construction by raising costs for builders and buyers.27
In addition to installation costs, homeowners incur ongoing maintenance costs—and, surprisingly, sometimes higher insurance premiums. In rural areas, there is not always enough water pressure for a sprinkler system to work properly.
In 2023, the fire death rate in newer single-family homes was much lower than the fire death rate in older single-family homes, even though most single-family homes included in this research did not have sprinklers. Requiring sprinklers in single-family homes would likely reduce housing production because it would increase construction costs. A slowdown in new housing construction would lead more people to live in older, less-safe homes, increasing the probability of fire death, because the fire death rate in pre-1970 construction single-family homes is three times as high as the fire death rate in post-2010 single-family homes. (See Figure 3, above.) Additionally, the high cost of housing, largely driven by a lack of housing supply, is the leading cause of homelessness.28 Increasing construction costs and reducing the number of new housing units built would likely drive up homelessness. The estimated number of deaths directly caused by homelessness each year is higher than the number caused by residential fires.29
Smoke detectors. Smoke detectors also reduce fire deaths and injuries. Prior research has shown that the fire death rate is reduced by half when smoke alarms are present and functional.30 The American Healthy Homes survey conducted in 2018-19 estimated that about 82% of all U.S. homes had a working smoke alarm.31 Newer homes (86%) were more likely than older homes (less than 74%) to have at least one working smoke alarm. Multifamily homes (91%) were more likely than single-family homes (80%) to have working smoke alarms.32
A 2021 analysis by the NFPA of historical data showed a steep decrease in the number of homes without smoke alarms from 1977 to the 1990s.33 NFPA researchers also found that in reported fire incidents, smoke alarms were more likely to be present—and more likely to be operable—in apartment buildings than in single-family homes.34 A functioning smoke alarm reduces the likelihood of death and injury in a fire.35 Because many multifamily buildings are rentals, which are typically subject to more stringent fire prevention statutes than owner-occupied housing, smoke alarms are more likely to be present and operational in apartments.36
Other construction improvements. Construction requirements other than sprinklers and smoke alarms may help explain the difference in fire death rates between single-family homes and multifamily buildings. These requirements include:
- Materials: More than 90% of one- and two-family homes in the United States are constructed with “unprotected wood-frame or unprotected ordinary construction” materials, while many multifamily buildings use fire resistive or noncombustible materials.37
- Systems: Modern apartment buildings more frequently have centralized heating and cooling, which are less likely to ignite than older systems. Although modern single-family homes usually have centralized heating systems, many older homes rely on woodstoves or portable electric and gas space heaters—which pose a greater fire risk than centralized systems.38
- Compartmentation requirements: Multifamily buildings have design features, such as fire-resistant doors and walls, that deter fire from spreading from one room to another and from one unit to the next; individual units are built as compartments, a safety feature designed to prevent the spread of fire and death. Single-family homes are not required to have compartmentation features between rooms, such as self-closing doors, that contain fires.39
Resident age. Occupant age is another known fire risk factor. Previous studies have shown that adults over 55 years old, and especially those over 85, have a greater risk of death in a home fire relative to the general population.40 On the other hand, although children overall have a lower fire risk than the general population, younger children (those under 4 years old) are inherently more vulnerable than older children due to the physical ability and mental awareness needed to escape quickly in an emergency.41
More Americans ages 55 and older (67%) live in single-family homes built before 2000—the riskiest type of housing, according to Pew’s analysis of 2023 data—than overall (59%). Also, proportionally fewer Americans ages 55 and older (3%) live in multifamily units built after 2000—the safest type of housing, according to Pew’s analysis of 2023 data—than the overall share of the population nationwide (6%). (See Appendix Table 1.) If resident age explained the difference in fire death rates between older and newer multifamily housing, and between older and newer single-family homes, a lower share of fire deaths among those aged 55 and older would be expected in newer multifamily units, and a higher share of deaths would be expected in older single-family homes.
Researchers tested this theory by comparing the expected share of fire deaths in 2023 by age group, by housing type, and by building age to actual deaths in those categories. The expected death shares were calculated by multiplying fire death rates within age groups in NFPA research times the number of people in each age group living in each type and age of housing from the American Housing Survey.42 For actual death shares, researchers looked at victim age data from NFIRS and USFA Media.43 Although victim age data was available for only about 42% of fire deaths in which the construction year was also available, death rates by age group were similar to and highly correlated with the rates in NFPA’s 2021 analysis of home fire deaths from 2015 to 2019, suggesting that they were representative of overall trends. (See Appendix Table 2.) Pew’s research found that age was not a confounding factor in death rate differences by home type and construction year: The share of deaths among those aged 55 and older was lower than expected in single-family homes built before 2000, and higher than expected in multifamily buildings newer than 2000. (See Table 4.) These results demonstrate that the stark difference in fire death rates between newer multifamily housing and other types of homes is not primarily due to the age distribution of residents.
Table 4: Age of Residents Doesn’t Explain Difference in Fire Death Rates Between Building Types
Expected and actual share of fire deaths by age group, building type, and construction year, 2023
| Expected share of deaths | Actual share of deaths | ||||||||
| Age group | Newer single-family (post-2000) | Older single-family (pre-2000) | Newer multifamily (post-2000) | Older multifamily (pre-2000) | Newer single-family (post-2000) | Older single-family (pre-2000) | Newer multifamily (post-2000) | Older multifamily (pre-2000) | |
| 0-19 | 14% | 10% | 11% | 11% | 16% | 18% | 14% | 22% | |
|---|---|---|---|---|---|---|---|---|---|
| 20-54 | 33% | 26% | 38% | 35% | 23% | 25% | 21% | 24% | |
| 55 and older | 53% | 64% | 51% | 54% | 61% | 56% | 64% | 54% | |
| All ages | 100% | 100% | 100% | 100% | 100% | 100% | 100% | 100% | |
Notes: The table shows the expected and actual share of fire deaths by age group for each building type and year of construction or remodeling. Data on victim age was only available for 606 (42%) of the 1,432 fire deaths for which year of construction was calculated. See Appendix Table 2 for details. Expected share of deaths is based on Pew’s analysis of data from the National Fire Protection Association (2021) and American Housing Survey (2023). Actual shares are based on Pew’s analysis of 2023 National Fire Incident Reporting System (NFIRS) and Home Fire Fatalities in the News (USFA Media) datasets. Percentages are rounded to the nearest whole number, so may not total 100.
Resident income and neighborhood income. Another factor that requires further exploration is the correlation between fire death rates and income. Prior research has documented an increased fire risk associated with having a low income and living in a high-poverty neighborhood, risks that are exacerbated when the neighborhood has an older housing stock.44 If lower-income households were more likely to live in older single-family homes, or if new multifamily homes were less likely to be located in low-poverty neighborhoods, those previously observed trends might explain why death rates in newer multifamily housing are so much lower than death rates in older single family homes.
The NFIRS and USFA Media datasets relied on for this report contain no information about household or neighborhood income, making a direct test of the effect of income beyond the scope of this report. It is possible to consider the role of income indirectly, by comparing the share of higher-income households and fire death rates by building type and construction age. More than half of households living in single-family homes built since 2000 (52%) have incomes above $100,000, well above the overall share of the population that earns that much (36%).45 Median household incomes for single-family homes generally are much higher than those for multifamily homes. (See Table 5.) If having a high income led to a lower fire risk, then new single-family homes should have the lowest fire death rates. Despite the higher median income of residents, single-family homes—even modern ones, built since 2000—do not have the same miniscule fire death rate as modern apartments. (See Figure 3, above.)
Table 5: Apartment Residents Generally Have Lower Incomes Than Single-Family Home Dwellers
Residents’ income doesn’t explain the difference in fire death rates by building type
| Household income | Older single-family (1999 or earlier) | Newer single-family (2000 or later) | Older multifamily (1999 or earlier) | Newer multifamily (2000 or later) | All housing types |
| Median household income | $74,000 | $101,000 | $46,000 | $56,000 | |
|---|---|---|---|---|---|
| Less than $50,000 | 33% | 21% | 52% | 44% | 35% |
| $50,000 to $100,000 | 29% | 27% | 29% | 32% | 29% |
| $100,000 or greater | 37% | 52% | 19% | 25% | 36% |
| All incomes | 100% | 100% | 100% | 100% | 100% |
Note: Percentages are rounded to the nearest whole number, so may not total 100.
Source: Pew analysis of 2023 American Housing Survey data.
Although prior research has found an increased fire risk associated with living in a low-income neighborhood, that association does not explain the better safety record of modern multifamily housing documented in this report. Fire death data from NFIRS and USFA Media doesn’t contain information about neighborhood income, preventing direct comparisons. Data from the ACS, however, shows that older multifamily and single-family homes are more likely to be located in lower-income neighborhoods. (See Table 6.) For housing built since 2000, multifamily homes are more likely to be located in lower-income neighborhoods than are single-family units. These trends suggest that neighborhood income may be influencing the higher death rates in older homes generally, but differences in neighborhood income can’t explain the much lower death rates in newer multifamily units.
In addition, approximately one-fourth of all apartment units built between 2000 and 2019 were financed at least in part with low-income housing tax credits, so a meaningful share of those new homes can only be rented to lower-income households.46 As a result, newer multifamily units are available to lower-income residents in both low- and high-income neighborhoods. The interactive effects of resident income, neighborhood income, building type, and building age require further study, but are beyond the scope of this report.
Table 6: Neighborhood Incomes Don’t Explain Differences in Fire Death Rates by Building Type
Share of housing units by construction year by income in ZIP code
| Older single-family (1999 or earlier) | Newer single-family (2000 or later) | Older multifamily (1999 or earlier) | Newer multifamily (2000 or later) | All housing types | |
| Units in all ZIP codes | 70,401,286 | 22,557,671 | 26,548,607 | 7,921,300 | 127,482,865 |
|---|---|---|---|---|---|
| Units in bottom 40% of ZIP codes by income | 23,323,742 | 4,741,226 | 8,682,000 | 1,996,443 | 38,743,410 |
| Share of units in bottom 40% of ZIP codes by income | 33% | 21% | 33% | 25% | 30% |
Source: U.S. Census Bureau, “American Community Survey, Table B25127: Tenure by Year Structure Built by Units in Structure,” 2023 five-year estimates; U.S. Census Bureau, “American Community Survey, Table B25033: Total Population in Occupied Housing Units by Tenure by Units in Structure,” 2023 five-year estimates; U.S. Census Bureau. “American Community Survey, Table B19013: Median Household Income in the Past 12 Months (in 2023 Inflation-Adjusted Dollars),” 2023
Urban versus rural setting. Another factor that could be influencing death rates by building type and construction year is whether a building is located in a rural or an urban area.47 A 1997 study by the U.S. Fire Administration analyzed fires from 1983 to 1988 and found that rural areas had higher fire death rates than non-rural areas; more recent data was unavailable.48
The combined USFA Media and NFIRS data used in this report didn’t indicate whether fires were in rural locations, precluding a direct comparison. Based on data from the ACS, researchers did calculate how much new housing has been built in both rural and urban areas since 2000. If all new housing had been built in urban areas, a rural location might contribute to the higher fire death rates in older homes. However, both urban (plus 25%) and rural (plus 20%) areas have added significantly to their housing stock since 2000, but the type of units added was different. Twenty-eight percent of new urban units were in multifamily housing, but only 12% of new rural units were multifamily. (See Table 7.) While rural areas have built less new multifamily housing, they have added single-family at almost the same rate as urban areas. And newer single-family housing has lower death rates than older single-family. Nevertheless, more research is needed to understand the impact of rural location on the differences in fire death rates between multifamily and single-family homes.
Table 7: More New Units Built in Urban Areas Were Multifamily, Compared With New Units in Rural Areas
Multifamily housing is mostly concentrated in non-rural areas
| 2023 housing stock | Rural | Non-rural | Total |
| Total units | 17,993,235 (14%) | 109,489,630 (86%) | 127,482,865 (100%) |
|---|---|---|---|
| Units built since 2000 | 3,681,222 | 26,914,035 | 30,595,257 |
| Share built since 2000 | 20% | 25% | 24% |
| Share of newer homes that are single-family | 88% | 72% | 74% |
| Share of newer homes that are multifamily | 12% | 28% | 26% |
Note: Rural units are in counties outside government-designated metropolitan areas; non-rural units are located in metropolitan area counties.
Source: U.S. Census Bureau, “American Community Survey, Table B25127: Tenure by Year Structure Built by Units in Structure,” 2023 five-year estimates
Why isn’t there more construction of multifamily homes?
The findings of Pew’s fire safety research are particularly alarming because an aging housing stock in the U.S. is creating more fire risk for residents. The median age of homes has been rising since the late 2000s, and was 41 years old for owner-occupied housing as of 2023.49 For tenant-occupied housing, the median age was 43 years old in 2023, the oldest it has ever been.50 Obstacles to the construction of new homes, such as restrictive zoning and building codes, are leading people to live in old, fire-prone housing.
High construction costs in the U.S. are a major obstacle to the construction of modern apartments. In countries such as Germany and Italy, the cost to build single-family and multifamily housing is about the same per square foot; in the U.S., low-rise (up to three stories) and mid-rise (up to 75 feet; four to seven or eight stories) multifamily construction costs are about 40% and 55% higher, respectively, than construction costs for single-family homes, driven by higher land acquisition costs, more expensive financing, and higher labor and material costs, relative to the costs of building single-family homes.51 Recent research from the National Association of Home Builders and National Multifamily Housing Council estimates that regulations contribute to about 40% of the cost of multifamily development in the United States (including permits, additional fees and studies, development requirements beyond what’s written in the building code, and the cost of delays).52 Lowering the cost of multifamily housing development would help reduce the country’s housing shortage. It would also improve fire safety by making additional modern apartment buildings financially viable.
There are ways to meaningfully reduce the cost of developing apartments without reducing safety for residents:
- Change zoning laws to allow multifamily housing on more land (zoning as a matter of landowner right).
- Simplify building permit processes (e.g., allow third-party plan review, allow preapproved plans, allow more housing types by right).
- Reform elevator regulations.
- Allow one stairway in small four-to-six-story apartment buildings.
Making the development of multifamily buildings easier and less costly would help save lives because modern multifamily housing is so much safer than older housing. (See Table 8.)
Table 8: 2023 Multifamily Fire Death Rate, by Year of Construction
Multifamily housing has grown far safer with time and modern construction
| Construction year | Number of fatal fires | Number of fire deaths | Estimated total population | Multifamily fire death rate (per million occupants) |
| 2010 or newer | 4 | 4 | 8,295,727 | 0.5 |
|---|---|---|---|---|
| 2000 to 2009 | 16 | 19 | 10,608,950 | 1.8 |
| 1990 to 1999 | 33 | 41 | 8,260,634 | 5.0 |
| 1980 to 1989 | 51 | 58 | 7,733,619 | 7.5 |
| 1970 to 1979 | 66 | 81 | 9,744,315 | 8.3 |
| 1969 or older | 158 | 189 | 22,205,959 | 8.5 |
Note: Construction year is the year that the building was built; if the building was significantly renovated, as noted in property records, then the renovation year was used instead.
Source: Pew analysis of 2023 National Fire Incident Reporting System and Home Fire Fatalities in the News datasets; U.S. Census Bureau, “American Community Survey, Table B25033: Total Population in Occupied Housing Units by Tenure by Units in Structure,” 2023 one-year estimates; U.S. Census Bureau, “American Community Survey, Table B25127: Tenure by Year Structure Built by Units in Structure,” 2023 one-year estimates
Allowing small single-stairway buildings could expand opportunities for development and lower costs
As noted above, the per-square-foot cost of developing low-rise and mid-rise multifamily housing in the U.S. is significantly higher than the cost of building single-family homes. More restrictive zoning and building codes and higher land-acquisition costs contribute significantly to this problem.
One way to lower development costs and increase the availability of multifamily housing—particularly in already-developed towns and cities, where large parcels of land are scarce—would be to allow small four-to-six-story apartment buildings to have one stairway instead of two. This single change would reduce construction costs by 6% to 13%.53 Land-acquisition costs would also be lower, as buildings could be developed on smaller, unbuilt parcels or above existing retail stores.
In the past few years, there have been extensive efforts in the United States to allow one stairway in small apartment buildings of four to six stories, generally with as many as four units per floor.54 From 2023 to 2025, 14 states passed bills to enable, legalize, or explore allowing one stairway in such buildings, and several cities have already legalized them; Nashville, Tennessee, and Austin, Texas, did so in 2025.55
Having one stairway instead of two allows buildings to fit on small lots and enables family-sized apartments with windows on multiple sides. Many high-income countries already allow this type of construction, but most of the U.S. and Canada does not, instead mandating two stairways plus a connecting corridor on every level.56 The rationale for this requirement is fire safety.
Research published in February 2025 by Pew and the Center for Building in North America found that in New York City and Seattle—the two U.S. cities that have allowed single-stairway buildings for decades—the lack of a second stairway had not led to a single fire-related death in the study period (more than 11 years).57 Using New York City data, that research demonstrated there is no added fire death risk from having only one stairway in four-to-six-story buildings, even though some of the single-stairway buildings in both cities are already decades old.
Newly permitted single-stair buildings would, of course, necessarily be modern multifamily housing, with sprinklers, fire-rated walls, noncombustible materials, enclosed stairways, and self-closing doors, as well as other modern safety features. Single-stair buildings would be much safer than the roughly 93% of American homes that are not modern multifamily buildings. (See Table 1 and Figure 3, above.) In short, legalizing single-stairway construction would meaningfully improve fire safety.
Conclusion
Housing supporters across the United States promote the construction of new apartments as a way to provide affordable and cost-efficient housing, reduce energy usage, and decrease commute times. This analysis demonstrates another benefit of new construction apartments: improved fire safety.
Fire safety is of prime societal importance. As the U.S. looks for ways to increase the availability of homes that are affordable to all sectors of the population, policymakers and advocates should keep fire safety in mind. This new analysis finds that newer multifamily buildings have the lowest fire death rates, compared to single-family homes or older multifamily housing. This report corroborates previous findings by the National Fire Protection Association and other researchers showing that multifamily buildings have gotten much safer over the past 45 years. Efforts to consolidate and adopt modern building codes, including the adoption of sprinklers, and to increase the use and upkeep of fire alarms in multifamily buildings, have paid dividends. Multifamily construction also uses fire-resistant or fire-rated materials, heating and cooling systems with low fire risk, and is designed to reduce fire spread.
Removing obstacles to new multifamily construction would reduce the U.S. housing shortage. Allowing more new apartments would also save lives by making the safest types of homes available for more Americans.
Acknowledgments
This brief was researched and written by Pew staff members Liz Clifford, Seva Rodnyansky, and Alex Horowitz. The team thanks Caroline Dufour, Nathaniel De Jonge, Sophie Jabés, Adam Staveski, and Jacqueline Uy for their valuable research support. The team also thanks Stephen Smith and Sandip Trivedi of the Center for Building in North America for originally developing the methodology used and for the use of the organization’s database with NFIRS data.
Appendix
Methodology
To collect fire incident data, Pew researchers drew upon the two largest publicly available sources for fire death records in the United States: NFIRS and USFA Media. The U.S. Fire Administration maintains both datasets, but the data in each system comes from different sources. NFIRS collects fire data directly from local fire departments through a voluntary reporting system; about 70% of departments participate.58 USFA Media collects information via a daily scan for media mentions of fatal fires. By using both datasets, researchers were able to compile a comprehensive list of publicly available fire fatality data. Researchers analyzed fire incidents from 2023 because it was the most recent year for which data was available from both sources.59
The datasets provided some data on building type (single-family versus multifamily) and building location (yes for NFIRS, no for USFA Media), but no data on building age. For USFA Media data, Pew researchers reviewed news sources about each fire to identify the incident address. Researchers used incident address data to validate building type, understand unit count, and obtain construction year60 using nationwide property assessor data from ATTOM Data Solutions, county records, real estate transaction records, and other online information. Duplicate incidents were eliminated.
The initial combined data from USFA Media and NFIRS contained a total of 2,652 fatal fire incidents from 2023. After review, a total of 683 incidents were excluded from analysis: 477 duplicate incidents; 166 incidents that occurred somewhere other than in a residential structure (including vehicles, commercial structures such as barns and storage units, tents or encampments, and condemned homes); two incidents that had been errantly coded as having fatalities; 26 arson incidents; 11 incidents where the death was not fire-related (such as fatal gunshot wounds); and one multifamily incident that was excluded because researchers could not confirm building age. Building age was confirmed for every single-family fire in NFIRS, but not all of the incidents in the USFA Media dataset, since they did not contain easily identifiable addresses. Single-family home age was weighted by the age distribution in NFIRS. The final count of valid fatal fire incidents was 1,969, which resulted in 2,377 deaths.
For single-family fires, because there were many incidents with fewer links to media coverage that contained addresses in USFA Media, researchers relied solely on NFIRS data (which did provide an address). In total, there were 910 single-family incidents from NFIRS. Using the known addresses, researchers then used ATTOM, a nationwide property database, to collect year built and effective year built for 712 incidents. For the remaining incidents, researchers manually searched on county assessor websites (from which researchers could not find data for 15 incidents). After all single-family incidents from NFIRS were reviewed, four were removed after being identified as multifamily incidents; five incidents were removed for being intentional fires; one was removed because it occurred in a condemned structure; one was removed for being a death unrelated to fire; and 15 were removed because researchers were unable to confirm building age. This process resulted in a final total of 884 validated single-family fire incidents resulting in 1,058 deaths. After reviewing the 478 NFIRS incidents that overlapped with USFA Media, researchers determined that the missing USFA Media building age data was random, and the fact that it was missing was not related to building age. To obtain an estimate of the full count of single-family deaths by age, NFIRS deaths were multiplied by a weight of 1.88 (full USFA Media death count of 1,987 divided by 1,058 NFIRS deaths) and incidents were multiplied by a weight of 1.86 (full USFA Media incident count of 1,641 divided by 884 NFIRS incidents).
Supporting analysis
Appendix Table 1: Younger People (Under 55) Are Much More Likely to Live in Both Newer and Older Multifamily Housing
59% of all Americans—and 67% of older adults—live in older single-family homes
| Age Group | ||||
| 0-19 | 20-54 | 55+ | All ages | |
| Newer single-family units (post 2000) | 19,180,999 | 31,453,180 | 18,075,666 | 68,709,845 |
|---|---|---|---|---|
| Older single-family units (pre-2000) | 44,167,745 | 79,930,003 | 67,760,160 | 191,857,908 |
| Newer multifamily units (post-2000) | 2,703,914 | 9,141,141 | 3,299,695 | 15,144,750 |
| Older multifamily units (pre-2000) | 9,360,560 | 25,786,770 | 12,013,754 | 47,161,084 |
| All housing units | 75,413,218 | 146,311,094 | 101,149,275 | 322,873,587 |
| Newer single-family share | 25% | 21% | 18% | 21% |
| Older single-family share | 59% | 55% | 67% | 59% |
| Newer multifamily share | 4% | 6% | 3% | 5% |
| Older multifamily share | 12% | 18% | 12% | 15% |
| All housing share | 100% | 100% | 100% | 100% |
Source: Pew analysis of 2023 American Housing Survey.
Appendix Table 2: Relative Risk of Fire Death by Age in 2023 Was Similar to Previous Nationally Representative Rates
Relative death risk rate by age group similar in NFPA and Pew data
| Age group | 2023 home fire deaths with victim age and construction year available | 2023 death rate per million | 2023 relative risk | NFPA death rate per million (2015-19) | NFPA relative risk (2015-19) |
| 0-4 | 34 | 2.2 | 1.2 | 7.1 | 0.9 |
|---|---|---|---|---|---|
| 5-9 | 36 | 1.9 | 1.0 | 5.3 | 0.7 |
| 10-14 | 31 | 1.5 | 0.8 | 2.6 | 0.3 |
| 15-19 | 16 | 0.8 | 0.4 | 1.9 | 0.2 |
| 20-24 | 12 | 0.6 | 0.3 | 2.5 | 0.3 |
| 25-34 | 31 | 0.7 | 0.4 | 4.2 | 0.5 |
| 35-44 | 53 | 1.2 | 0.6 | 5.2 | 0.6 |
| 45-54 | 52 | 1.3 | 0.7 | 8.1 | 1.0 |
| 55-64 | 94 | 2.1 | 1.1 | 12.7 | 1.6 |
| 65-74 | 128 | 3.9 | 2.1 | 16.0 | 2.0 |
| 75-84 | 83 | 4.5 | 2.4 | 21.2 | 2.6 |
| 85 and older | 36 | 6.2 | 3.3 | 26.8 | 3.3 |
| All ages | 606 | 1.9 | 1.0 | 8.1 | 1.0 |
Notes: The correlation coefficient between the 2023 relative risk by age group and the NFPA 2015-19 relative risk by age group is 0.96. This is extremely highly correlated, suggesting that the 2023 data hews closely to the patterns observed in the NFPA 2021 analysis of home fire deaths.
Sources: Pew analysis of 2023 National Fire Incident Reporting System and Home Fire Fatalities in the News datasets; Marty Ahrens, “Home Fire Victims by Age and Gender.” 2021; U.S. Census Bureau “AHS 2023 National Public Use File (PUF),” 2023; U.S. Census Bureau, “American Community Survey, Table B25033: Total Population in Occupied Housing Units by Tenure by Units in Structure,” 2023 one-year estimates; U.S. Census Bureau, “American Community Survey, Table B25127: Tenure by Year Structure Built by Units in Structure,” 2023 one-year estimates.
Endnotes
- “Make It Count: Measuring Our Housing Supply Shortage,” Elena Patel, Aastha Rajan, and Natalie Tomeh, The Brookings Institution, Nov. 26, 2024, https://www.brookings.edu/articles/make-it-count-measuring-our-housing-supply-shortage/. Tanya de Sousa and Meghan Henry, “The 2024 Annual Homelessness Assessment Report (AHAR) to Congress,” U.S. Department of Housing and Urban Development, Office of Community Planning and Development, 2024, https://www.huduser.gov/portal/sites/default/files/pdf/2024-AHAR-Part-1.pdf.
- Donna Shai, “Income, Housing, and Fire Injuries: A Census Tract Analysis,” Public Health Reports 121, no. 2 (2006): 149-54, http://www.jstor.org/stable/20056933.
- “Fires and Numbers—NFSA Investigates Structure Fire Trends in the U.S.,” Jon Nisja, April 30, 2024, https://nfsa.org/2024/04/30/structure-fire-trends-in-the-us/.
- Shelby Hall, “Fire Loss in the United States,” National Fire Protection Association, 2024, https://www.nfpa.org/education-and-research/research/nfpa-research/fire-statistical-reports/fire-loss-in-the-united-states.
- Sophia Bollag, “L.A. Fires Fuel Opposition to New Bay Area Housing Development,” San Francisco Chronicle, Feb. 6, 2025, https://www.sfchronicle.com/politics/article/housing-development-fire-california-20136604.php..
- Seva Rodnyansky et al., “Small Single-Stairway Apartment Buildings Have Strong Safety Record,” The Pew Charitable Trusts, 2025, https://www.pew.org/en/research-and-analysis/reports/2025/02/small-single-stairway-apartment-buildings-have-strong-safety-record.
- Aleksander K. Berg et al., “Remapping California’s Wildland Urban Interface: A Property-Level Time-Space Framework, 2000–2020,” Applied Geography 167 (2024): 103271, https://www.sciencedirect.com/science/article/pii/S0143622824000766.
- Shelby Hall, “Fire Loss in the United States.”
- NFIRS data is voluntarily reported, and only about 70% of fire departments respond in the NFIRS system. “About NFIRS,” U.S. Fire Administration, https://www.usfa.fema.gov/nfirs/about/. “Home Fire Fatalities in the News,” U.S. Fire Administration, https://apps.usfa.fema.gov/civilian-fatalities/.
- These included county public records, online real estate listings and transaction records, other online information, and nationwide county assessor data from ATTOM Solutions Inc.
- The number of valid fire deaths is 2,377 and doesn’t include non-valid fire incidents. See the Appendix Methodology for more details.
- Shelby Hall, “Fire Loss in the United States.”
- It is worth noting that researchers identified 14 incidents involving homeless individuals in condemned or vacant buildings and six incidents involving homeless encampments, for a total of 20 homelessness-related fatal incidents in 2023. This count of homelessness-related deaths was not systematically collected, as it is not the focus of the analysis. Although researchers could not confirm the total number of homelessness-related fatal fire incidents in 2023 (the true count is likely much higher), the number identified was equal to the number of fatal fire incidents in all multifamily buildings constructed since 2000 and five times greater than the number of incidents in multifamily buildings constructed since 2010.
- “American Community Survey, Table B25127: Tenure by Year Structure Built by Units in Structure,” U.S. Census Bureau, 2023 one-year estimates, https://data.census.gov/table/ACSDT1Y2023.B25127?q=B25127:%20Tenure%20by%20Year%20Structure%20Built%20by%20Units%20in%20Structure.
- While duplexes fall under the IRC and are often regulated the same as single-family homes, the census reports two-to-four-unit buildings as a single category. As a result, researchers were not able to determine the exact number of duplexes within the housing stock and instead treated them as multifamily.
- “High-Rise Building Requirements: An Overview for Architects and Engineers,” The Building Code Blog, March 19, 2025, https://www.buildingcode.blog/blog/high-rise-building-requirements-an-overview-for-architects-and-engineers.
- Glenn Mathewson, “A History of U.S. Building Codes,” Fine Homebuilding 317 (2023): https://www.finehomebuilding.com/2023/07/19/a-history-of-u-s-building-codes.
- “The International Code Council: Through the Years,” International Code Council, https://www.iccsafe.org/30th-anniversary/timeline.
- “Tech Today: A Building Code Update Discusses Code Adoption and Applicability,” Mark Graham, Professional Roofing, March 2004, https://www.professionalroofing.net/articles/article/431.
- “Code Differences Between IRC and IBC for Residential Buildings,” Ian Story, MODE Architecture, April 2, 2025, https://modearchitecture.com/code-differences-between-irc-and-ibc/.
- Tucker McGree, “U.S. Experience With Sprinklers,” National Fire Protection Association, 2024, https://www.nfpa.org/education-and-research/research/nfpa-research/fire-statistical-reports/us-experience-with-sprinklers.
- Tucker McGree, “U.S. Experience With Sprinklers.”
- Tucker McGree, “U.S. Experience With Sprinklers.”
- Felix I. Zemel, “Reframing How Complex Building Code Proposals Are Assessed: The Case of Home Fire Sprinklers” (doctoral dissertation, Tufts University, 2023).
- Felix I. Zemel, “Reframing How Complex Building Code Proposals Are Assessed.”
- New York State Builders Association, “Housing & Feasibility of Residential Fire Sprinkler Systems Study,” 2024, https://www.nahb.org/-/media/NAHB/advocacy/docs/top-priorities/codes/ATT-2-Intro-and-Exec-Summary.pdf.
- New York State Builders Association, “Housing & Feasibility of Residential Fire Sprinkler Systems.”
- “America’s Rental Housing 2024,” Joint Center for Housing Studies of Harvard University, https://www.jchs.harvard.edu/americas-rental-housing-2024. “Restrictive Zoning Is Raising Housing Costs and Homelessness in Arizona,” Alex Horowitz and Tushar Kansal, The Pew Charitable Trusts, Dec. 7, 2023, https://www.pew.org/en/research-and-analysis/articles/2023/12/07/restrictive-zoning-is-raising-housing-costs-and-homelessness-in-arizona.
- Bruce D. Meyer, Angela Wyse, and Ilina Logani, “Life and Death at the Margins of Society: The Mortality of the U.S. Homeless Population” (working paper, National Bureau of Economic Research, 2023), http://www.nber.org/papers/w31843.
- David Rohde et al., “The Association Between Smoke Alarm Presence and Injury and Death Rates: A Systematic Review and Meta-Analysis,” Fire Safety Journal 81 (2016): 58-63, https://www.sciencedirect.com/science/article/pii/S037971121630008X.
- David C. Cox et al., “American Healthy Homes Survey II: Additional Environmental Findings, Final Report,” U.S. Department of Housing and Urban Development, Office of Lead Hazard Control and Healthy Homes, 2024.
- David C. Cox et al., “American Healthy Homes Survey II.”
- Marty Ahrens and Birgitte Messerschmidt, “Fire Safety in the United States Since 1980: Through the Lens of the NFPA Fire & Life Safety Ecosystem,” National Fire Protection Association, 2021, https://go.nfpa.org/l/14662/2021-05-24/8hkgts.
- Marty Ahrens and Birgitte Messerschmidt, “Fire Safety in the United States since 1980.”
- Marty Ahrens and Birgitte Messerschmidt, “Fire Safety in the United States since 1980.”
- U.S. Fire Administration, “Topical Fire Report Series: Multifamily Residential Building Fires (2017-2019),” 2021, https://www.usfa.fema.gov/downloads/pdf/statistics/v21i7.pdf.
- Leslie R. Richardson, “What Fire Statistics Tell Us About Our Fire and Building Codes for Housing and Small Buildings and Fire Risk for Occupants of Those Structures,” Fire and Materials 25, no. 6 (2002): 255-71, https://onlinelibrary.wiley.com/doi/10.1002/fam.774.
- Leslie R. Richardson, “What Fire Statistics Tell Us About Our Fire and Building Codes.”
- Marty Ahrens and Birgitte Messerschmidt, “Fire Safety in the United States Since 1980.”
- U.S. Fire Administration, “Topical Fire Report Series: Fire Risk in 2022,” 2024, https://www.usfa.fema.gov/downloads/pdf/statistics/v22i6.pdf. Marty Ahrens, “Home Fire Victims by Age and Gender,” National Fire Protection Association, 2021, https://content.nfpa.org/-/media/Project/Storefront/Catalog/Files/Research/NFPA-Research/US-Fire-Problem/oshomevictims.pdf?rev=3256e437e60d4fd98d5704be5ea4e533.
- U.S. Fire Administration, “Fire Risk in 2022.”
- Expected share of deaths is based on Pew’s analysis of data from Marty Ahrens, “Home Fire Victims by Age and Gender.” “AHS 2023 National Public Use File (PUF),” U.S. Census Bureau, 2023, https://www.census.gov/programs-surveys/ahs/data/2023/ahs-2023-public-use-file--puf-/ahs-2023-national-public-use-file--puf-.html.
- Actual shares are based on Pew’s analysis of 2023 NFIRS and USFA Media datasets.
- Donna Shai, “Income, Housing, and Fire Injuries.”
- Household incomes are calculated from the American Housing Survey. Income sources in the calculation are comprehensive and include wages and salaries; self-employment income; interest, dividend, and rental income; social security or railroad retirement income, retirement or survivor pensions; supplementary security income; public assistance or public welfare; farm income; and other income such as worker’s compensation and alimony.
- “LIHTC Provides Much-Needed Affordable Housing, but Not Enough to Address Today’s Market Demands,” Yonah Freemark and Corianne Payton Scally, Urban Institute, July 11, 2023, https://www.urban.org/urban-wire/lihtc-provides-much-needed-affordable-housing-not-enough-address-todays-market-demands.
- Data completeness and reporting are unlikely to contribute to observed differences between rural and urban fire death rates. Rural fire departments report data to NFIRS at a similar if not greater rate than urban departments, and rural fire deaths are picked up by USFA Media data. This information comes from U.S. Fire Administration and Federal Emergency Management Agency, “The Rural Fire Problem in the United States,” 1997, https://www.usfa.fema.gov/downloads/pdf/statistics/rural.pdf. More contemporary data could provide additional insights to or validation of this trend.
- U.S. Fire Administration and Federal Emergency Management Agency, “The Rural Fire Problem.”
- “American Community Survey, Table B25037: Median Year Structure Built by Tenure,” U.S. Census Bureau, 2023 one-year estimates, https://data.census.gov/table/ACSDT1Y2023.B25037?q=B25037:+Median+Year+Structure+Built+by+Tenure.
- “American Community Survey, Table B25037,” U.S. Census Bureau. “America’s Rental Housing 2024,” Joint Center for Housing Studies of Harvard University.
- Seva Rodnyansky et al., “Small Single-Stairway Apartment Buildings.” “Small Apartment Buildings Can Help Address Housing Shortages, but High Land Costs and Interest Rates Are Limiting Construction,” Yonah Freemark, Urban Institute, Feb. 12, 2025, https://www.urban.org/urban-wire/small-apartment-buildings-can-help-address-housing-shortages-high-land-costs-and.
- Paul Emrath and Caitlin Sugrue Walter, “Regulation: 40.6 Percent of the Cost of Multifamily Development,” National Association of Home Builders and National Multifamily Housing Council, 2022, https://www.nmhc.org/globalassets/research--insight/research-reports/cost-of-regulations/2022-nahb-nmhc-cost-of-regulations-report.pdf.
- Seva Rodnyansky et al., “Small Single-Stairway Apartment Buildings.”
- “Cracking the Code: One Man’s Quest to Fix the Way We Build,” Henry Grabar, Slate, Feb. 28, 2025, https://slate.com/business/2025/02/housing-crisis-apartments-development-single-stair-reform-codes.html.
- An Ordinance Amending Title 16 of the Metropolitan Code of Laws to Adopt Updated Building Codes, BL2025-898, Metropolitan Government of Nashville and Davidson County, 2025, https://nashville.legistar.com/LegislationDetail.aspx?ID=7433986&GUID=B8491A2F-6B1C-4507-A310-2058064BA422&FullText=1. City of Austin, “City of Austin Adopts 2024 Technical Building Codes, Effective July 10,” news release, April 10, 2025, https://www.austintexas.gov/news/city-austin-adopts-2024-technical-building-codes-effective-july-10. “Reform Efforts Across North America,” Center for Building in North America, https://www.centerforbuilding.org/trackers.
- Seva Rodnyansky et al., “Small Single-Stairway Apartment Buildings.”
- Seva Rodnyansky et al., “Small Single-Stairway Apartment Buildings.”
- “About NFIRS,” U.S. Fire Administration.
- 2023 had about a typical number of residential fire deaths, according to available USFA data from 2013 to 2023 and NFIRS data from 2012 to 2023.
- Where available, researchers used the “effective construction” year or major renovation year, since homes and buildings were redone to a higher safety standard.
People


