Expanding Mortgage Access Can Help Reduce Reliance on Land Contracts
Lack of traditional financing can push buyers toward riskier options

Overview
When homebuyers can’t obtain a mortgage, they sometimes turn to a potentially risky alternative: land contracts. Also known as contracts for deed or land installment contracts, these arrangements have been a small but notable fixture of the U.S. housing market for decades. But only recently has there been enough data available to comprehensively study why homebuyers use this type of financing.
A significant amount of research on land contracts has focused on the risks they pose to buyers.1 Land contracts are usually costlier than mortgages, with many charging high interest rates and hidden fees. Unlike 15- and 30-year mortgages, land contracts often last for just a few years and require a balloon payment at the end of the term—a large payment, either of cash or from a new loan―that makes it difficult for many buyers to fulfill the contract.2 In some states, buyers who fall behind on payments can be removed from their home within weeks, often forfeiting any equity they’ve accumulated in the property.3 Many land contract buyers are also responsible for home repairs and property taxes even though it’s not clear if or when they have legal ownership of the home.4
Despite the risks, some homebuyers use land contracts because they are unable to get a mortgage.5 In some cases, the inability to get a mortgage is due to a borrower’s financial characteristics: They have a low income, a damaged credit history, or irregular employment, which makes lenders hesitant to extend financing. But in other cases, creditworthy borrowers find that their home does not qualify for a mortgage because of its assessed value, how it was built, its repair needs, or where the home is located.
Researchers from The Pew Charitable Trusts explored the relationship between mortgage access and land contract usage by analyzing a property records database that tracks single-family home sales nationwide. Since many states do not require home sellers to publicly record land contracts with local governments, researchers also looked closely at the nine states with the highest number of recorded land contracts to understand the characteristics of properties that are frequently purchased with this type of financing. This analysis builds upon Pew’s prior research on land contracts, especially a 2021 survey of Americans that found that 610,000 households were financing their home with a land contract.6
The key findings of this report are as follows:
- About 715,000 land contracts were recorded in the United States over the last two decades. This figure almost certainly undercounts the true number of land contracts because many states do not have a law that requires sellers to publicly record these arrangements or, if they do, the law is poorly enforced. About 410,000 of all land contracts nationwide (57%) were used to purchase single-family homes, with the remainder used for farms, businesses, vacant land, and other properties.
- Land contracts are used to finance 0.4% of home sales nationwide but are more common in the Midwest. From 2005 to 2025, the share of single-family home sales that were financed with a land contract was far above the national average in Michigan (2.9%), Minnesota (2.1%), Iowa (1.9%), Wisconsin (1.5%), Ohio (1.2%), and Indiana (1.1%).
- Homebuyers often use land contracts when mortgages are difficult to obtain. Data from the nine states with the highest number of recorded land contracts reveals that they are often used to finance homes for which access to a traditional mortgage is limited: manufactured homes; homes valued at less than $150,000; homes located in rural areas; and older homes, which more often have repair needs.
- Expanding mortgage supply could help reduce reliance on land contracts. Pew’s research found that increasing mortgage availability by 10 percentage points (for example, by increasing the share of homes financed with a mortgage from 53.5% to 63.5%) could reduce land contract usage by 0.4 percentage points (for example, reducing the share of homes financed with a land contract from 2.7% to 2.3%).
Although expanding mortgage access could help reduce homebuyers’ reliance on land contracts, these arrangements are likely to remain a fixture of the housing market for years to come. Therefore, state and federal policymakers should consider creating more and better safeguards for buyers who use land contracts. Only 23 states have laws that specifically apply to land contracts, and even in those states land contract buyers typically have fewer protections than those who use a mortgage.7 Setting minimum standards for land contracts would help ensure that buyers do not take on added risks and costs simply because their home does not qualify for a mortgage.
What are land contracts and where are they used?
A land contract is a type of alternative home financing in which the buyer purchases a house directly from a seller instead of through a bank or other mortgage lender. With a land contract, the buyer gives the seller a down payment and the seller finances the rest of the purchase price. The buyer then makes regular payments over an agreed‑upon period at the interest rate stated in the contract. Unlike mortgage buyers, those who use a land contract do not gain legal ownership until they have paid off the entire amount owed. Thus, buyers often bear the responsibilities of homeownership without the legal protections that accompany a traditional mortgage.
A central challenge with researching land contracts is that many are not publicly recorded with the county recorder of deeds. Only 12 states have laws requiring sellers to record land contracts, and even states with recording laws often have spotty enforcement and minimal penalties for noncompliance. As a result, it is difficult to know the true prevalence of land contracts across the United States.
To address this knowledge gap, Pew conducted a nationally representative survey of U.S. adults in 2021 that found that approximately 3.4 million households were financing their home using one of four alternative financing arrangements: a lease-purchase agreement (1.07 million), a home-only loan for a manufactured home (870,000), a seller-financed mortgage (730,000), a land contract (610,000), or an unspecified type of alternative financing (100,000). Pew’s survey estimate aligns closely with data from the American Community Survey, which found that 683,000 households were using a “contract to purchase” in 2021—a term intended to capture land contracts and similar types of installment financing.
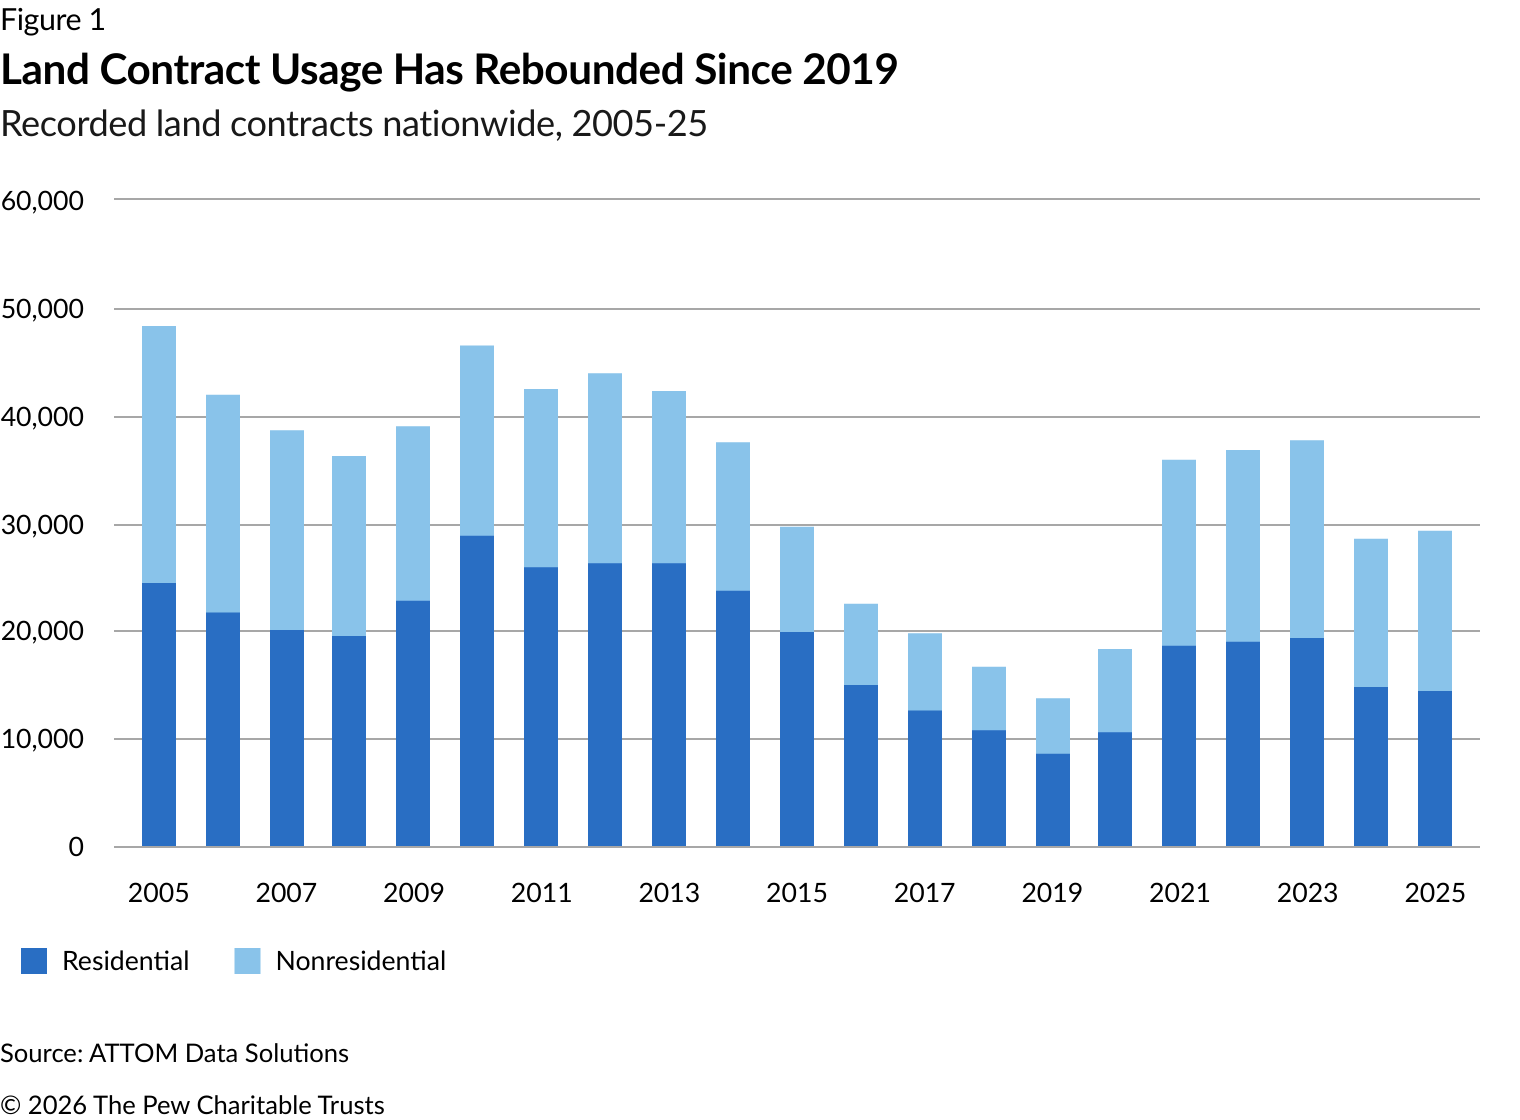
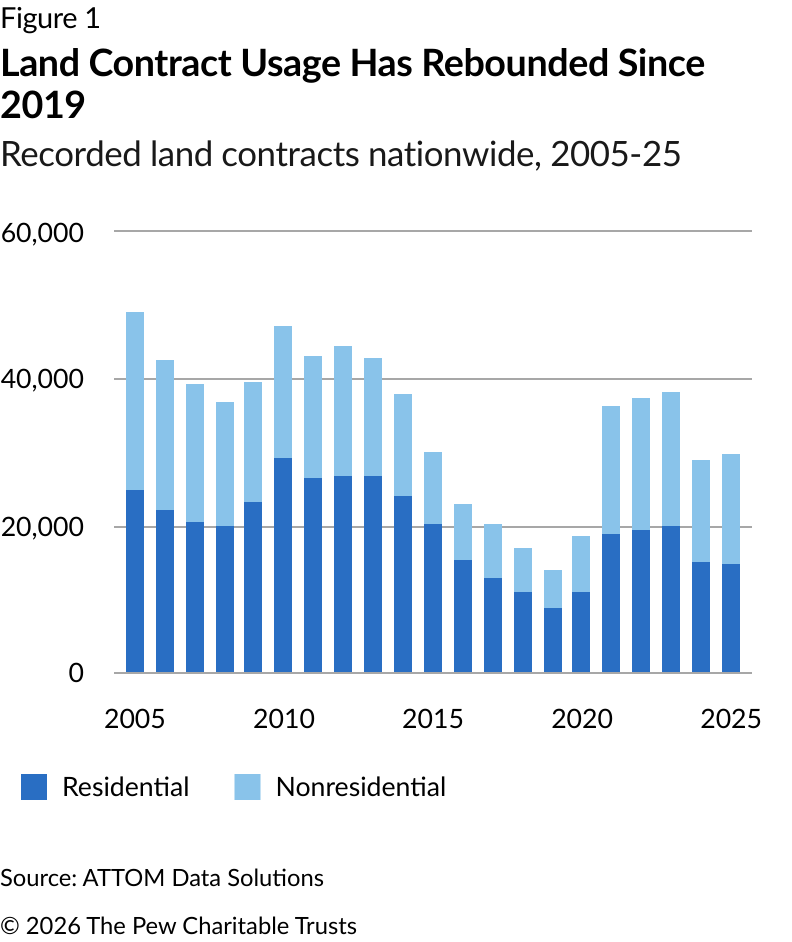
Although every type of alternative financing is risky for borrowers, this report focuses on land contracts because they are most easily identifiable using property records data. Nationwide, more than 715,000 land contracts were recorded by local governments in 46 states and the District of Columbia from 2005 to 2025. Approximately 410,000 of those contracts were used to purchase homes and other residential properties, while 305,000 were used to purchase nonresidential properties like farms, businesses, and vacant land. From 2005 to 2014, between 30,000 and 49,000 land contracts were recorded each year. (See Figure 1.) New land contracts fell sharply from 2015 to 2019 before rebounding in the early 2020s.
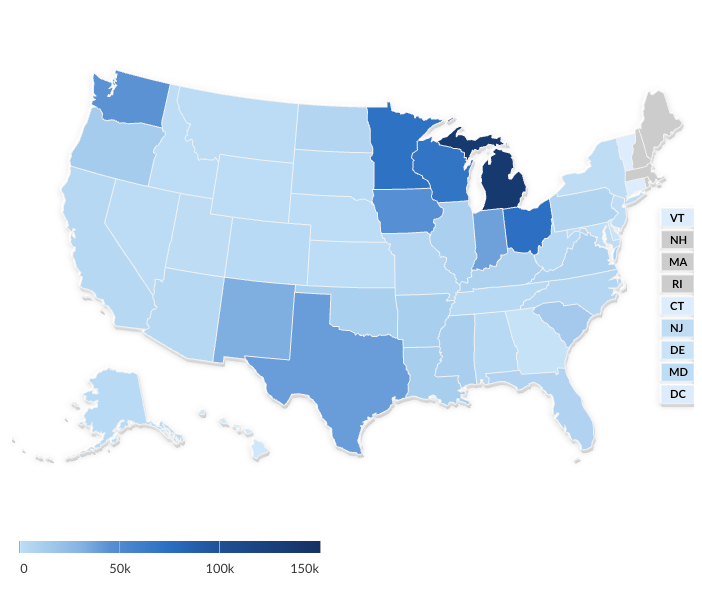
Land contracts were especially common in the Midwest. (See Figure 2.) Indiana, Iowa, Michigan, Minnesota, Ohio, and Wisconsin each recorded at least 37,000 land contracts from 2005 to 2025; together, these six states accounted for 61% of all contracts recorded nationwide. A relatively large number of contracts were also recorded in New Mexico, Texas, and Washington state. In contrast, Maine, Massachusetts, New Hampshire, and Rhode Island all lack recorded land contract data. That doesn’t mean land contracts aren’t used in those states; rather, it’s more likely that the state has no legal recording requirement or does not enforce a recording law.
The pattern was similar, though not identical, when researchers looked at the prevalence of land contracts as a share of all home sales. Nationwide, an estimated 0.4% of single-family home sales were financed with a land contract from 2005 to 2025. However, more than 1% of homes were purchased with a land contract in six Midwestern states: Indiana, Iowa, Michigan, Minnesota, Ohio, and Wisconsin. (See Figure 3.) Land contracts were also prevalent in New Mexico, where 2.8% of homebuyers used them.
Buyers use land contracts when they cannot get a mortgage
Despite the risks, some homebuyers choose land contracts because they lack a better option. Several major barriers to mortgage access drive buyers toward land contracts: financial characteristics that disqualify them from obtaining a traditional mortgage (for example, no credit history, variable income, income from self-employment); market conditions that raise mortgage costs (making it more difficult to qualify); and property characteristics (age, low price, manufactured home) that make it difficult or even impossible to obtain a standard mortgage.
Buyers with damaged credit or low incomes may have no other option
For buyers with a damaged credit history or low income, land contracts may be the only available pathway to homeownership. Americans with an imperfect credit history, for example, have found it more difficult to qualify for a traditional mortgage since the Great Recession of 2007-09, which led the federal government and private lenders to implement strict mortgage lending standards. The average credit score of new mortgage borrowers increased by 33 points from 2006 to 2010, and it became more difficult for some potential homebuyers to get a mortgage. Around the same time, in 2010, the number of land contracts recorded annually in the United States reached 47,273.
Many buyers who use alternative financing also have a low income, which makes it difficult to qualify for a traditional mortgage. Pew’s 2021 survey found that homebuyers with an income below $50,000 were more than seven times as likely to use alternative financing as higher-income buyers.8 Since a loan applicant’s debt-to-income ratio is an important element of mortgage underwriting—and the most common reason lenders deny a loan request—those with a low income often find it difficult to qualify for a mortgage.9 That is especially true if the applicant’s income is irregular, earned by providing on-demand work, or earned in the gig economy instead of traditional employment.10
Mortgages are often unavailable for the types of homes that buyers want
Other financially qualified homebuyers use a land contract because they cannot get a mortgage for the type of home they want to purchase. To better understand how a lack of mortgage access drives reliance on land contracts for specific housing types, Pew researchers analyzed 21 years of home sales data in the nine states that recorded the most land contracts (Indiana, Iowa, Michigan, Minnesota, New Mexico, Ohio, Texas, Washington, and Wisconsin).11 Because data is widely available in these states, researchers could compare properties purchased with land contracts to those purchased with mortgages.
Overall, the nine states selected for deeper analysis recorded roughly 324,000 residential land contracts from 2005 to 2025, accounting for 1.2% of all single-family home sales. In contrast, the remaining 41 states and the District of Columbia together recorded just 86,000 residential land contracts, accounting for just 0.1% of sales.
Buyers often struggle to get mortgages for low-cost homes
In many parts of the country, single-family homes routinely sell for under $150,000. Buyers of these homes often struggle to get a mortgage. Prior Pew research found that just 26% of homes that sold for less than $150,000 were financed with a mortgage from 2018 to 2021, compared with 71% of higher-cost properties, and 38% of mortgage lenders nationwide did not issue a single small mortgage (below $150,000) during the four-year study period.12 Further, applications for small mortgages were denied more often than applications for larger loans, even after adjusting for an applicant’s credit score.13
The primary reason for those discrepancies is that small mortgages are less profitable for banks and other mortgage lenders than larger loans. All mortgages cost about the same to originate, but small mortgages usually generate less revenue than larger loans.14 Another factor is how loan officers are compensated: These employees are often paid a commission based on a percentage of the loan amount, which creates an incentive to pursue and close higher-value loans.15
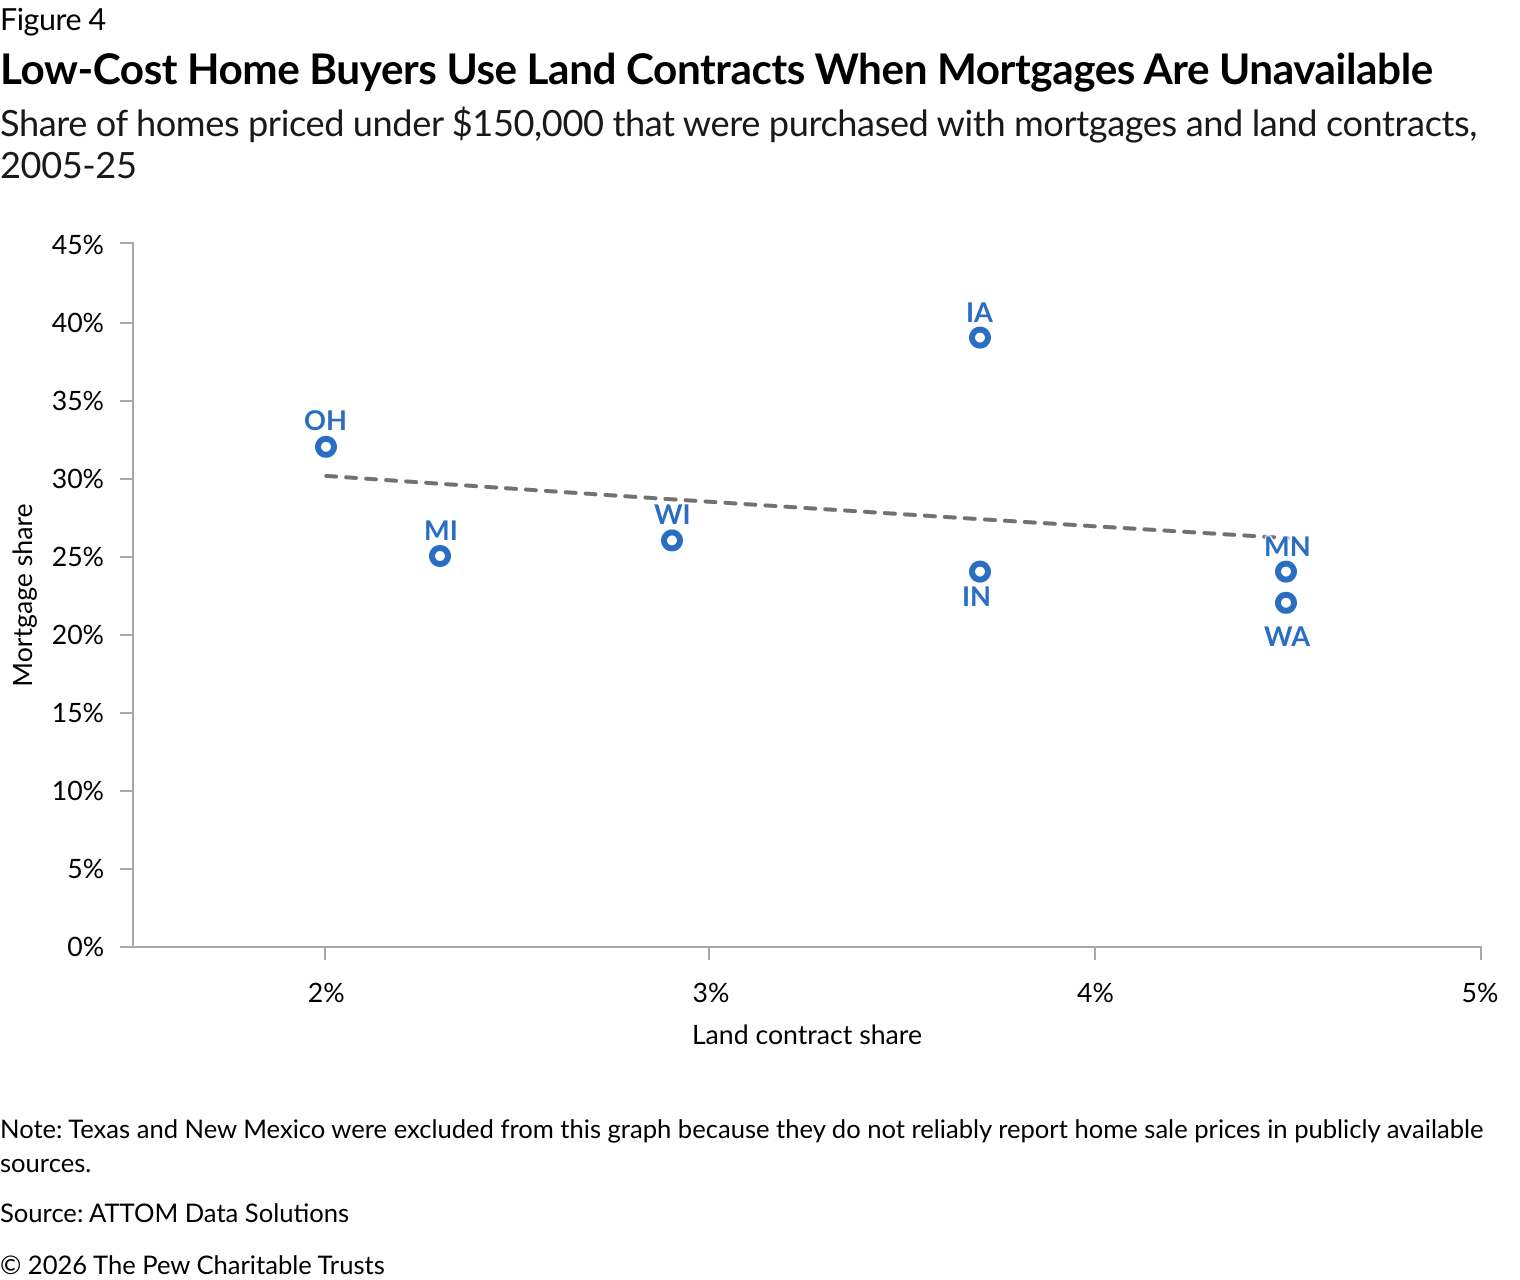
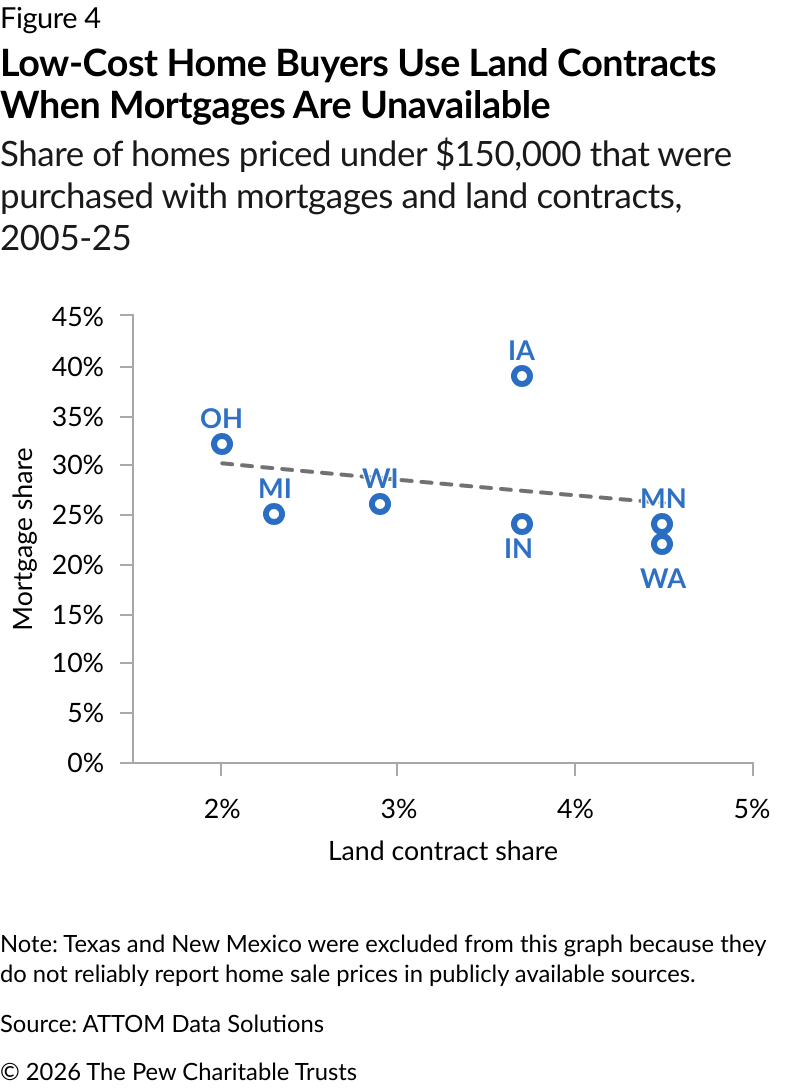
The result is a scarcity of mortgages for low-cost homes that pushes some buyers to use land contracts instead. Only seven of the nine states that Pew researchers examined in detail reliably report home sale prices in publicly available sources. Data from those seven states shows that 2.8% of homes priced under $150,000 were financed with a land contract between 2005 and 2025 and that 28.1% were financed with a mortgage. (The other 69.2% were acquired by an investor or individual who bought the house without a recorded loan, including those who used equity from a previous home sale, cash, or a different type of alternative financing.) In contrast, just 0.9% of homes that sold for $150,000 or more were purchased with a land contract, while 68.1% were acquired with a mortgage and 31.1% were bought without a recorded loan.
In the states with available sale price data, an inverse relationship existed between mortgage availability and land contract use among buyers of low-cost homes. (See Figure 4.) In Ohio, for example, 31.8% of low-cost homes were financed with a mortgage and only 2% with a land contract. In Washington, by contrast, just 22.5% of low-cost homes were mortgage-financed, while 4.5% of buyers relied on land contracts.
The same pattern emerges when low-cost homes are identified by tax-assessed value rather than sale price. Although state property tax assessments often lag market value—and some states deliberately assess homes at less than full market value—data from all nine states shows that where small mortgages are more readily available, land contracts are used less frequently. Over the 21-year study period, 1.7% of homes assessed at under $150,000 were financed with a land contract and 51.5% were financed with a mortgage. In contrast, 0.6% of homes assessed at $150,000 or more were land contract-financed, while 69.8% were mortgage-financed.
Manufactured homes are often ineligible for mortgages
Many manufactured home buyers turn to land contracts because their home does not qualify for a mortgage. In most states, manufactured homes are automatically titled as personal property rather than real estate, which makes them ineligible for a traditional mortgage. Owners can convert their homes to real property if they meet state requirements related to land ownership and type of foundation, but that process is often cumbersome. As a result, many buyers rely on home-only loans—also known as chattel or personal property loans—which are costlier than mortgages and harder to obtain because of high denial rates.16 And 20% of all manufactured home buyers who borrowed money used a land contract.17
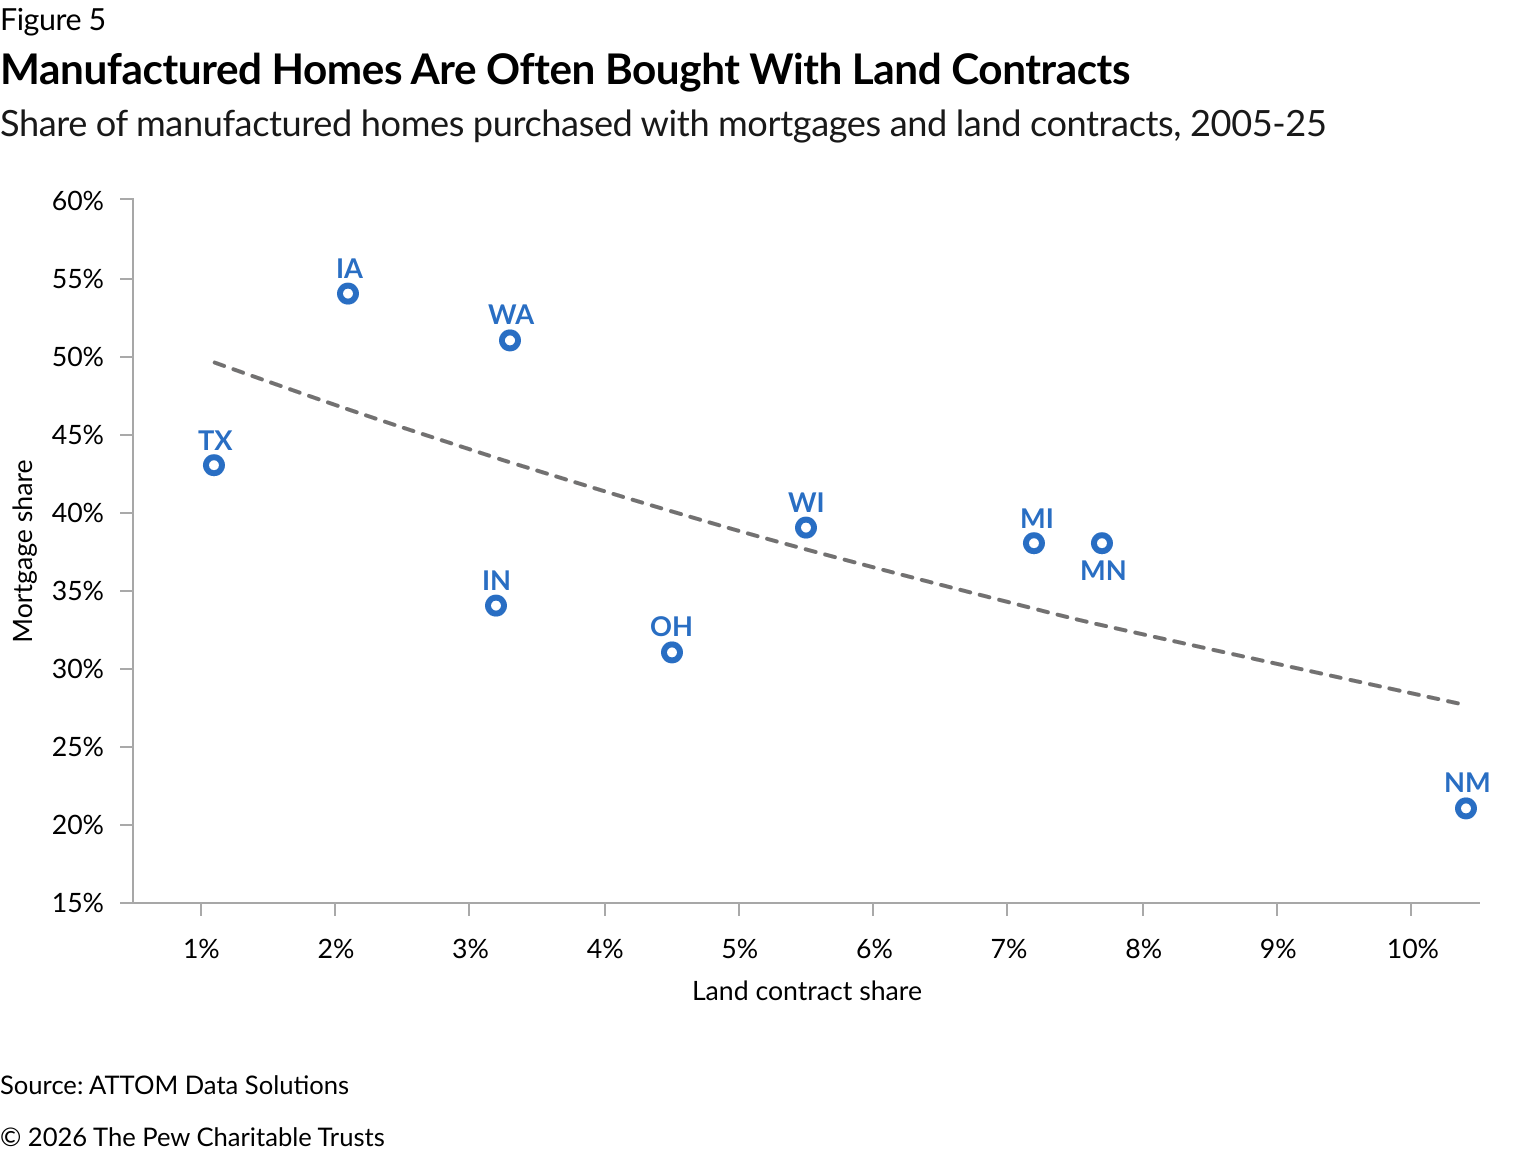
Transaction data from the nine states selected for deeper analysis shows the difficulty of obtaining a mortgage for a manufactured home. From 2005 to 2025, 2.7% of manufactured homes were purchased with a land contract, while 42.2% were purchased with a mortgage. In contrast, 1.1% of site-built homes were bought with a land contract and 61.5% were bought with a mortgage.
The relationship between mortgage access and land contract use is especially stark when viewed at the state level. (See Figure 5.) In Iowa, 54.1% of manufactured homes were bought with a mortgage and 2.1% with a land contract. In New Mexico, just 21.2% of manufactured home purchases were mortgage-financed, while 10.4% of buyers relied on a land contract. (The remainder were bought with cash or another type of alternative financing.)
Buyers in rural areas struggle to access traditional forms of credit
Homebuyers who want to live in a rural area often struggle to get a mortgage, increasing their reliance on land contracts. Prior Pew research found that just 43% of homes sold in rural areas from 2004 to 2022 were financed with a mortgage, compared with 62% of those sold in suburban and urban areas.18 That discrepancy is in part attributable to relatively lower home prices, which increases reliance on hard-to-get small mortgages. Adjusted for inflation, the median sales price of a rural home from 2004 to 2022 was $213,000, compared with $374,000 for a home in suburbs and cities.19
Rural homebuyers also face other challenges that make it difficult to access a mortgage.20 A significant proportion of rural Americans do not have sufficient information in their credit reports to generate a credit score, making lenders hesitant to issue them a loan. Rural communities also have an above-average share of homes that do not qualify for a mortgage: manufactured homes titled as personal property, homes with substantial repair needs, and “heirs property” cases (where it is unclear who holds title to an inherited home).21 Rural homebuyers have also historically been more likely to seek financial services from brick-and-mortar banks and credit unions—many of which have closed in recent decades—and less likely to have access to broadband internet than their counterparts in urban areas.
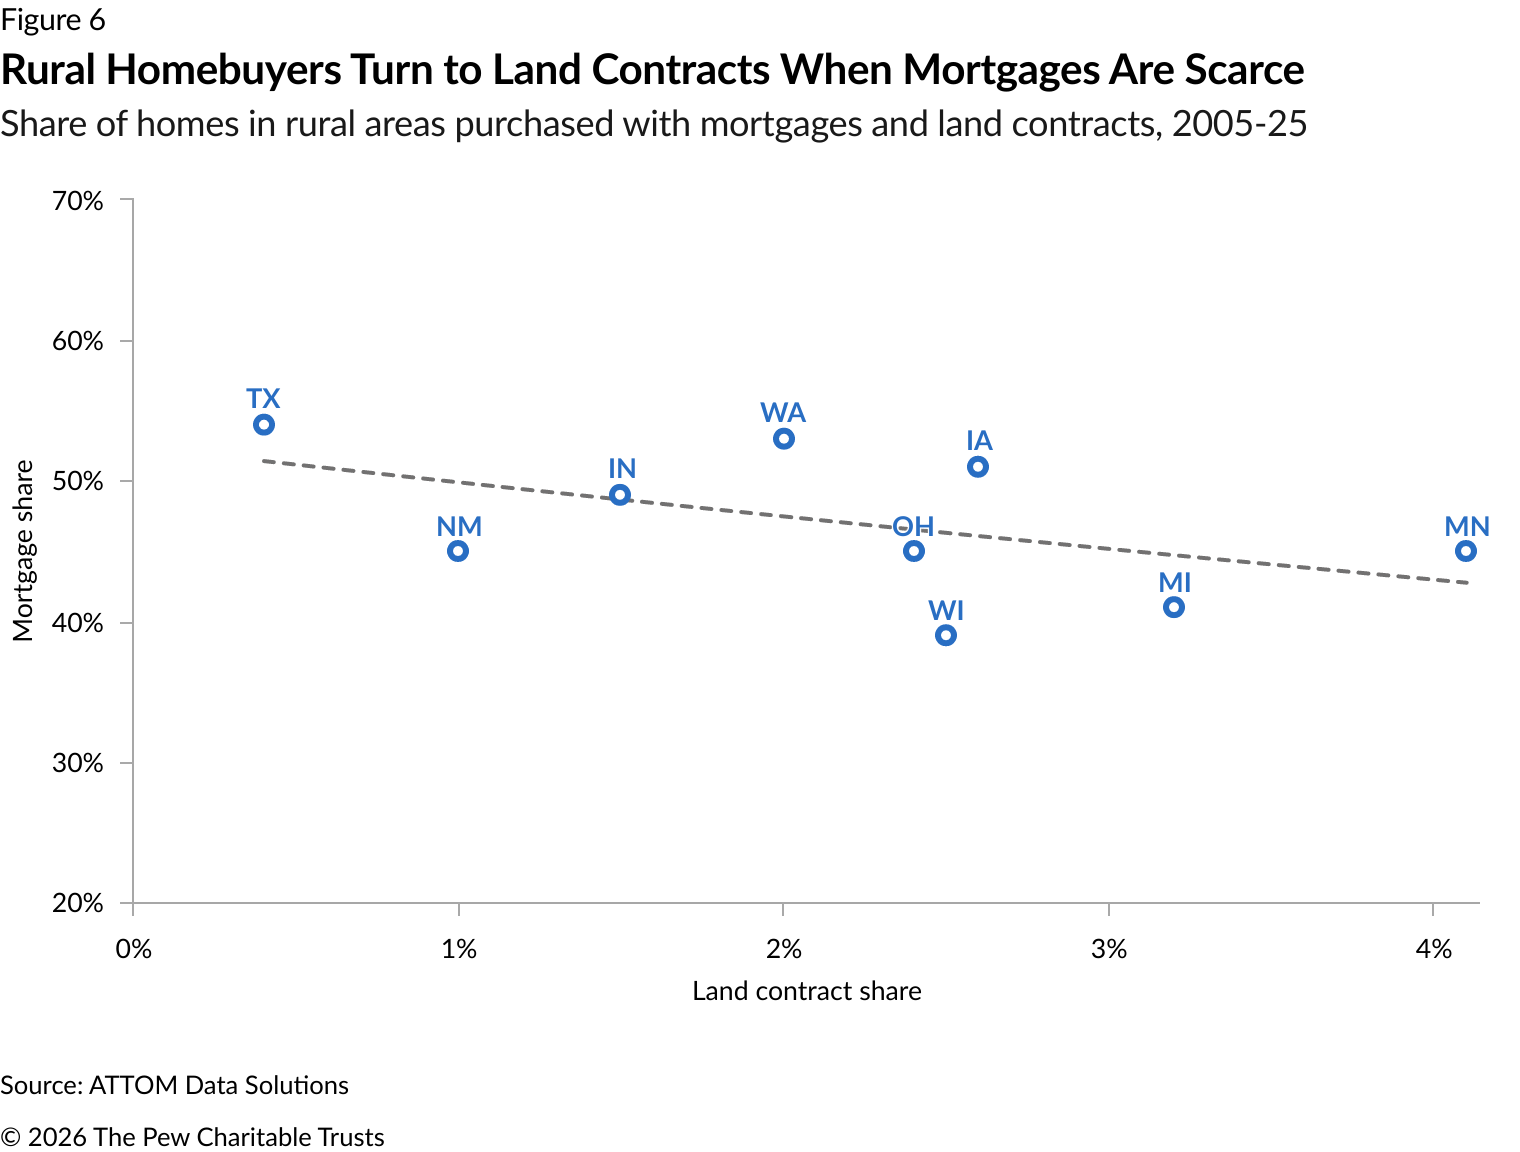
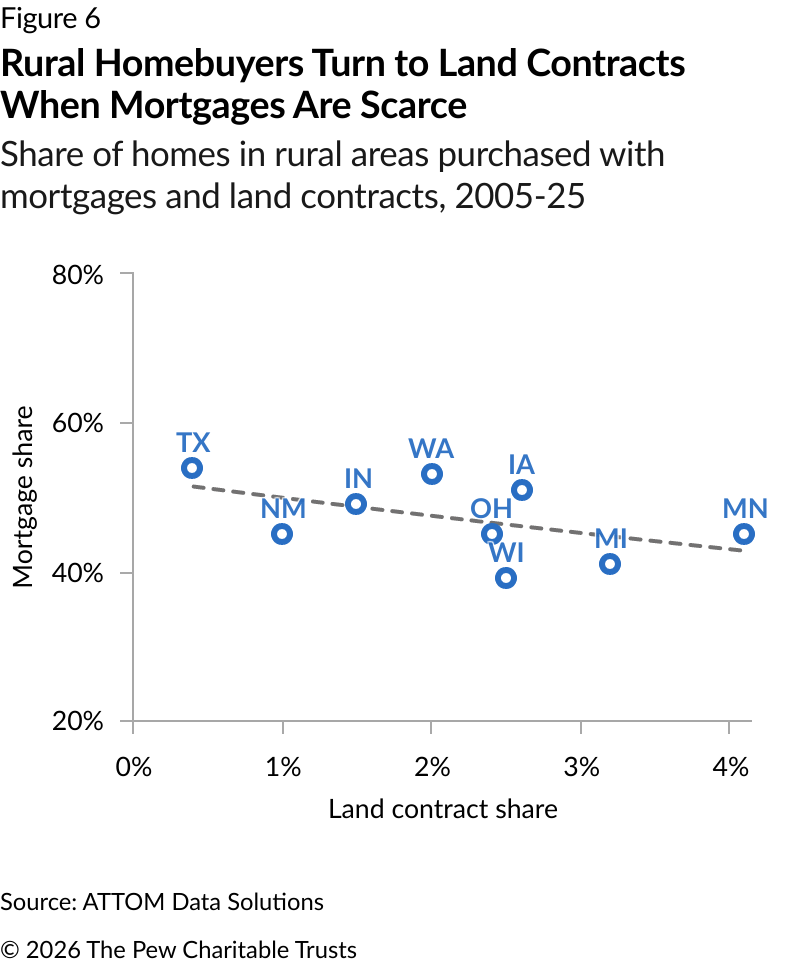
These challenges drive reliance on land contracts. In the nine states that Pew researchers examined in detail, 2.1% of rural homes were bought with a land contract and 47.1% were financed with a mortgage. In contrast, 1% of homes bought in suburban and urban areas were land contract-financed and 63.2% were mortgage-financed. But the situation varied by state. In Texas, rural homebuyers were relatively well connected to the traditional financial system: More than half (53.5%) used a mortgage to acquire their home, while only 0.4% used a land contract. In Minnesota, however, just 45.2% of rural buyers used a mortgage, while 4.1% used a land contract. (See Figure 6.)
Homes in need of repair often do not qualify for a standard mortgage
Traditional mortgages typically do not allow a buyer to finance both the purchase price and the costs of repairing a home. Although lenders are not prohibited from issuing loans for fixer-uppers, in practice it’s difficult: Conventional loans sold to Fannie Mae and Freddie Mac must meet property-eligibility guidelines, and government-insured or guaranteed loans must satisfy minimum standards for safety and habitability.
The Federal Housing Administration (FHA), Fannie Mae, and Freddie Mac have mortgage programs designed to help borrowers purchase and repair homes. These specialty lending programs—FHA’s 203(k), Fannie Mae’s HomeStyle Renovation, and Freddie Mac’s CHOICERenovation—are pathways to financing homes that need repair, but they are very small relative to the broader home financing system. The number of 203(k) loans fell from 2015 to 2023, and despite recent attempts at improving the program, lenders nationwide issued just 3,683 203(k) loans in fiscal year 2025.22 There are no publicly available estimates of the number of loans issued through Fannie Mae’s and Freddie Mac’s renovation programs, but it is thought to be small.
The lack of mortgage options pushes buyers toward land contracts. In 2022, Pew conducted a survey of homebuyers who had relied on alternative financing, including land contracts, to purchase a home. That survey found that 25% of land contract buyers purchased homes with significant repair needs; most knew about the repairs before they bought the property.23 Separate interviews with legal aid professionals and users of alternative financing confirm that many homebuyers turn to land contracts and other alternatives when they want to buy a fixer-upper and cannot get financing through traditional channels.
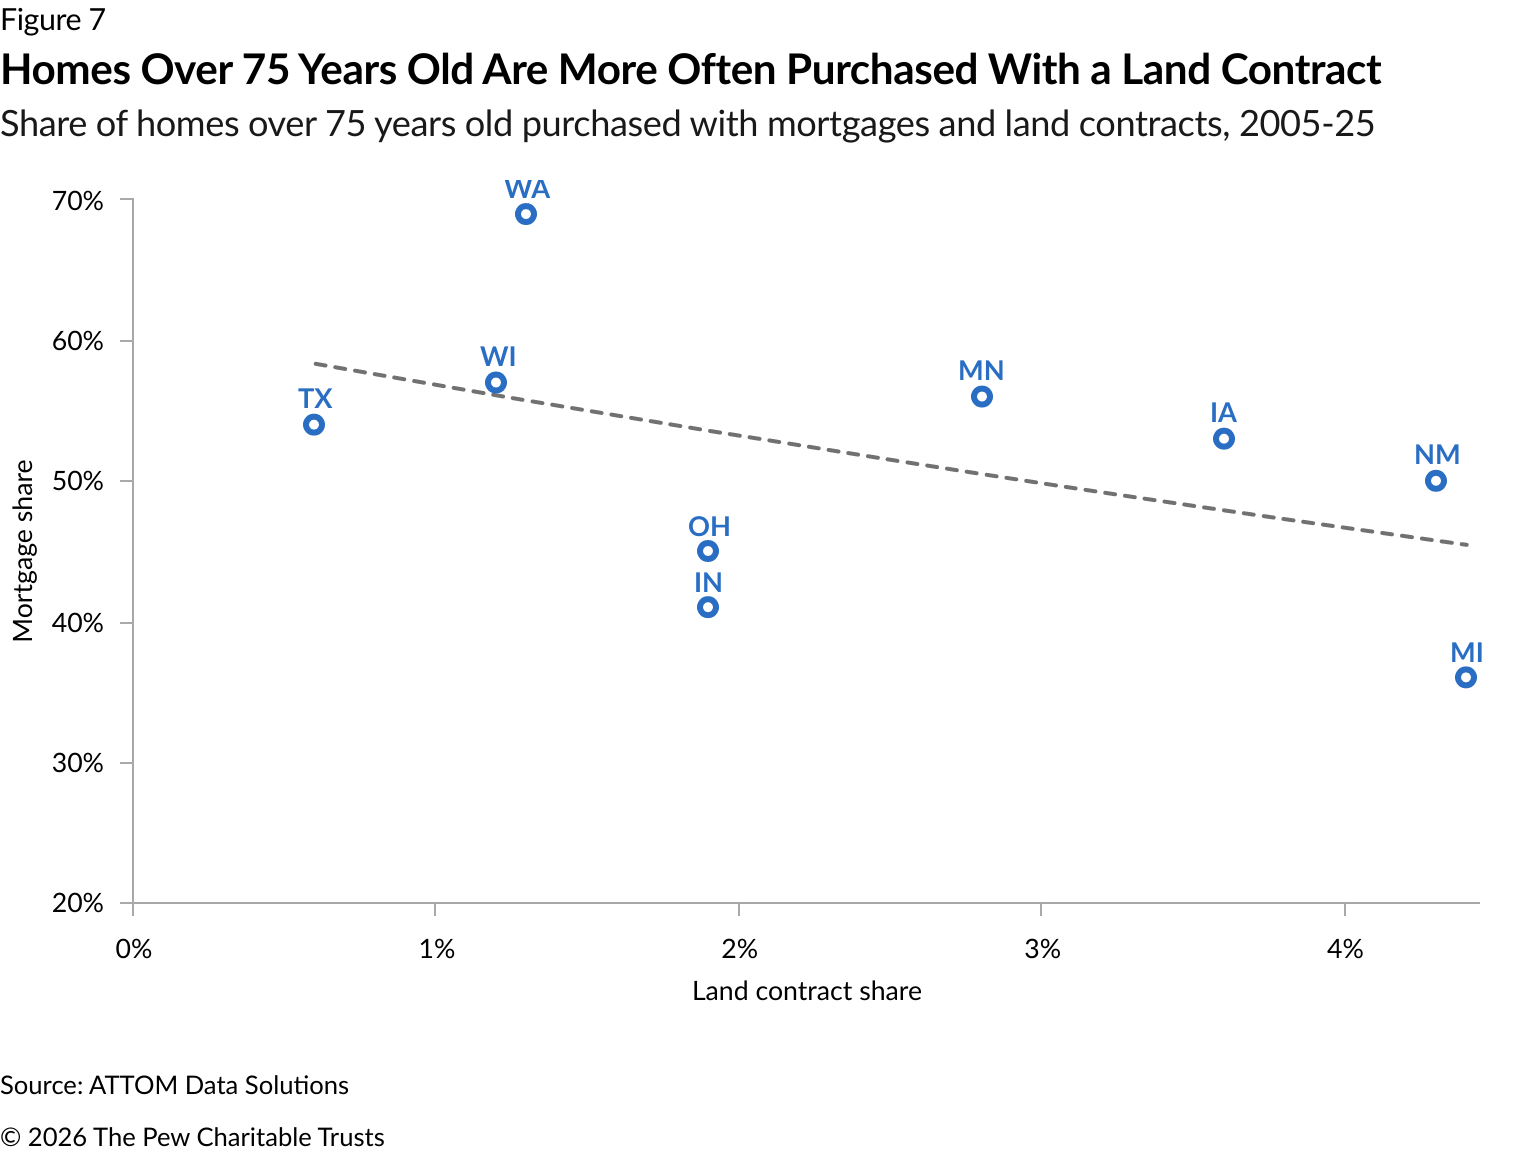
There is no comprehensive database that tracks the condition of homes in the United States. However, since older homes tend to have more significant repair needs than newer homes, Pew researchers used the age of homes sold with a land contract as a proxy for property condition. In the nine states that researchers examined in detail, the median age of homes purchased with a land contract was 32 years older than the median age of homes purchased with a mortgage. In addition, 2.2% of purchased homes over 75 years old were financed with a land contract, while 48.6% were purchased with a standard mortgage. In contrast, 0.7% of homes less than 75 years old were purchased with a land contract and 67.6% were purchased with a mortgage.
Land contract use varied from state to state based on differences in mortgage access. In Washington, 69% of older homes were financed with a mortgage, compared with 1.3% that were financed with a land contract. (See Figure 7.) But in Michigan, the share of homes over 75 years old financed with a land contract (4.4%) was three times higher than in Washington. Only 35.9% of buyers who purchased an older home in Michigan got a traditional mortgage.
Expanding mortgage access could reduce reliance on land contracts
Pew’s research on the nine U.S. states with the most recorded land contracts shows a clear relationship between the availability of mortgages and the use of contracts: As the use of mortgages decreased, the number of land contracts increased. To determine whether this relationship was statistically significant—and not a product of other variables—researchers developed a statistical model that accounted for demographic factors (such as racial composition and age structure), financial indicators (i.e., the prevailing mortgage interest rate), and market characteristics (housing prices, age of housing stock, and mix of housing types). These variables were measured for each county in the nine case study states where at least one land contract was recorded for a single-family home sale in every year from 2005 to 2025.
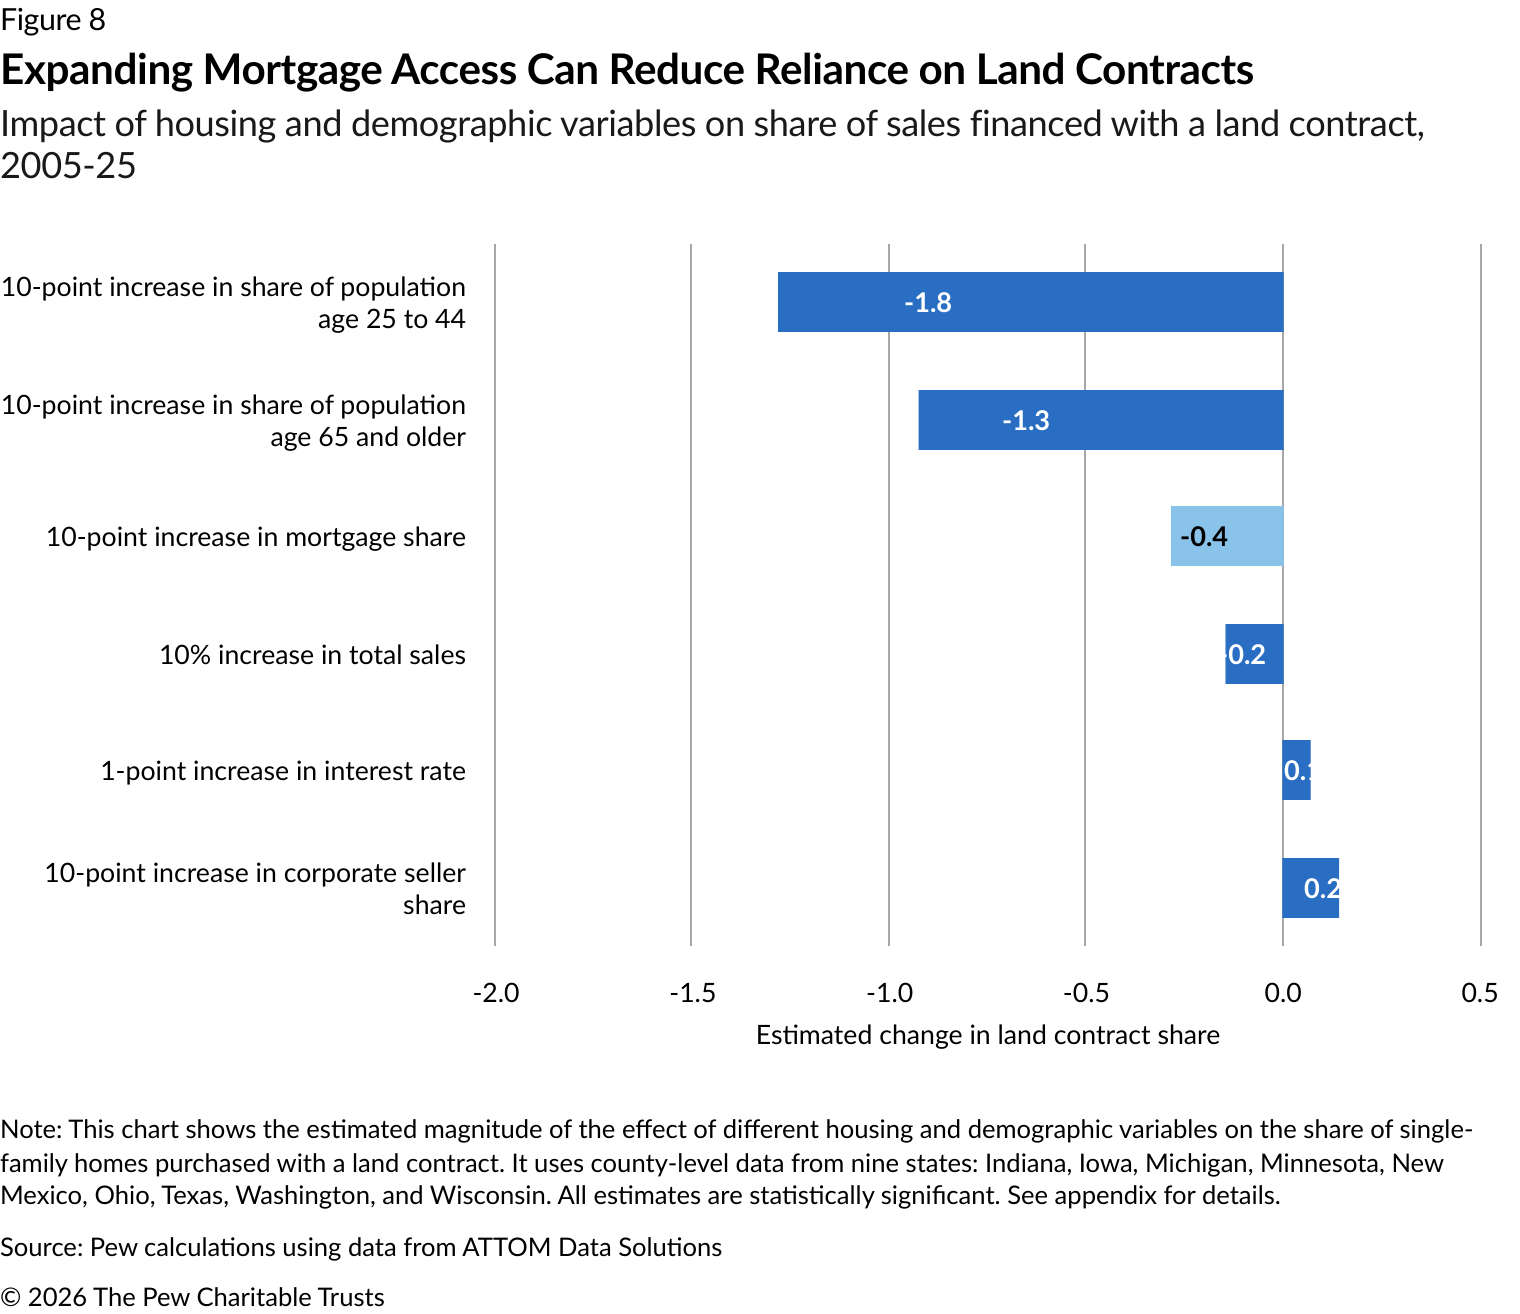
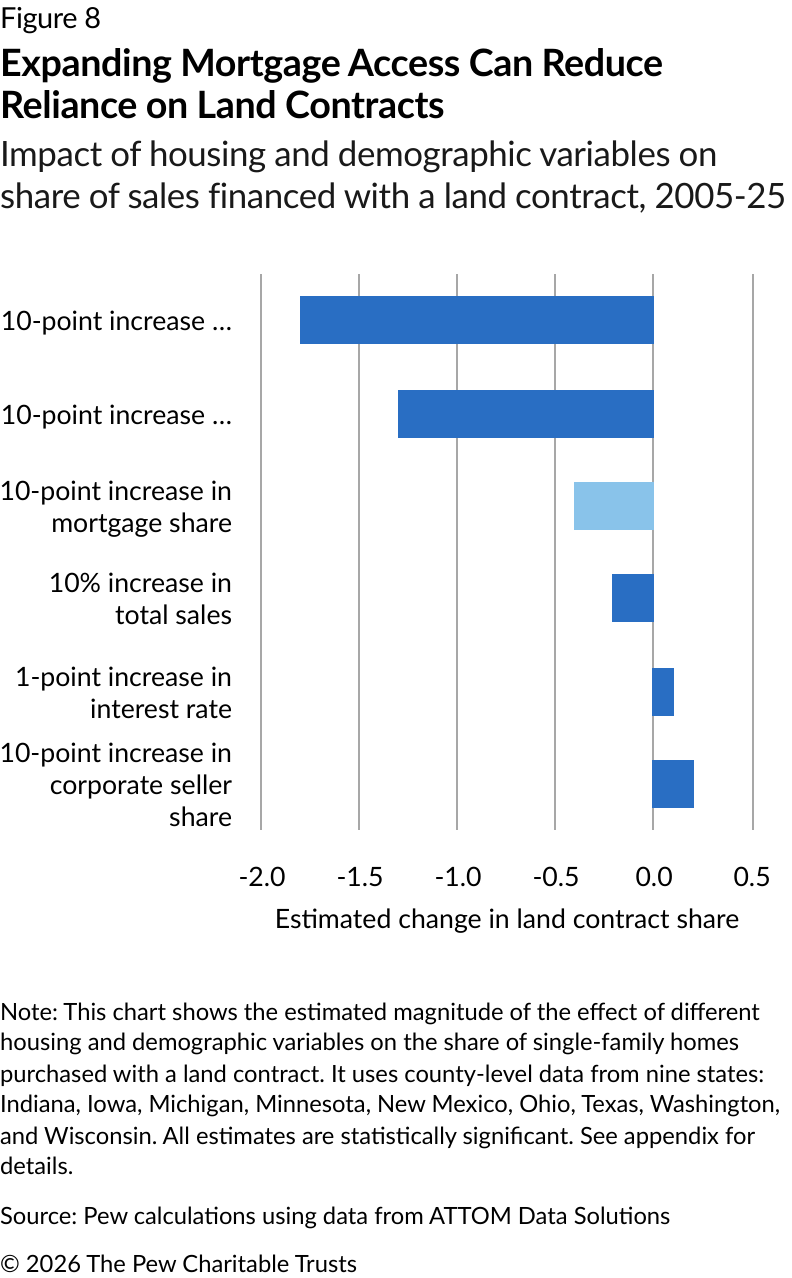
In those counties, mortgages were used for 53.5% of home sales, while land contracts were used for 2.7% of sales. The other 43.8% were purchased with cash, including those who used equity from a previous home, or with another form of alternative financing. (See Appendix Table A1.) Counties with a higher prevalence of mortgages tended to have a proportionally lower number of land contracts. Thus, if mortgage use were to increase by 10 percentage points (for example, from 53.5% of home sales to 63.5%), the land contract share would be expected to decrease by 0.4 percentage points (for example, from 2.7% of home sales to 2.3%).
The mortgage share in a county had a greater impact on land contract usage than all other variables except an increase in the younger working population (ages 25-44) and in the older population (age 65 and older)—both of which were associated with a decrease in land contract usage. Land contracts were also used less frequently in more active home sale markets and in markets with higher median home sales prices. In contrast, land contract usage was higher in more racially diverse areas, in counties where a greater share of homes were sold by corporations, and in counties and years with higher mortgage interest rates. (See Figure 8.)
Mortgage use was also a key predictor of land contract share when the analysis was limited to rural counties, counties with a higher share of low-cost or manufactured homes, and home sales priced below $150,000. Even in counties with a more active sales market—where land contract usage was generally lower—mortgage use was an important indicator of land contract share. (See Appendix Tables A2 to A4.)
State and federal policymakers could help land contract buyers
To reduce homebuyers’ reliance on land contracts, federal and state policymakers could take practical steps to increase mortgage supply. They could, for example, offer lenders an incentive to originate small mortgages, reform manufactured home titling laws and practices to increase the number of manufactured homes that qualify for a mortgage, and create new loan products that help homebuyers purchase and renovate properties that need repair. Policymakers should also consider improving consumer protections for buyers who use land contracts.
Support the adoption of cash-flow underwriting, which better reflects whether potential buyers are prepared to purchase a home. Policymakers could support the adoption of cash-flow underwriting to augment traditional underwriting. Instead of relying only on traditional underwriting metrics, such as annual income and credit score, cash-flow underwriting examines the flow of money to and from a potential borrower’s bank account over time to understand whether the applicant can afford a mortgage. Some federal agencies have taken steps to permit this form of underwriting in addition to traditional underwriting, but more work needs to be done.
Reform manufactured home titling policies. Nearly half of manufactured homes nationwide are owned as personal property rather than real estate, making them ineligible for standard mortgage financing. State and federal policymakers have taken some steps to change laws and policies to make it easier for manufactured home buyers to own homes as real estate, which makes them eligible for safe, low-cost financing options. More work needs to be done.
Expand and improve loan programs that help buyers repair and rehab older homes. The FHA’s 203(k), Fannie Mae’s HomeStyle Renovation, and Freddie Mac’s CHOICERenovation programs work in a similar fashion, enabling borrowers to purchase and repair older homes by bundling the home purchase price and renovation costs into a single loan. But these programs are widely considered to be too cumbersome and slow for most borrowers and lenders to use, and as a result they remain underutilized. Simplifying and expanding these programs could help buyers purchase homes in need of repair without resorting to a land contract.
Improve consumer protections and enforcement for land contract buyers. Even when mortgages are plentiful, some buyers will continue to use land contracts because of their financial situation, their credit needs, or the type of property they want to buy. Policymakers should therefore seek to improve consumer protections for land contract borrowers. These protections also need to be enforced.
At a minimum, sellers should be required to publicly record land contracts and other types of alternative financing arrangements. Lawmakers could also provide land contract borrowers with the same foreclosure protections as mortgage borrowers and place limits on abusive terms and practices, such as high interest rates and balloon payments, which make it difficult for buyers to complete their purchase. Enacting and enforcing these and other reforms would help land contract buyers avoid the worst outcomes, such as rapid eviction or total loss of equity after years of making payments.
Conclusion
When the mortgage market doesn’t work for borrowers, they don’t stop buying homes. Instead, some turn to alternative financing arrangements such as land contracts, which are riskier and costlier than mortgages. In some cases, buyers use land contracts because they cannot qualify for a mortgage based on their financial situation. Others prefer not to take out a bank loan. Some buyers also turn to land contracts when they are purchasing a property that does not qualify for a mortgage. Low-cost homes, manufactured homes, houses in rural areas, and homes in need of repair often do not qualify for a traditional mortgage, pushing buyers to use land contracts.
Policymakers can reduce reliance on land contracts by making mortgages readily available to those who financially qualify. Pew’s statistical model, based on an analysis of home sales in nine states over 21 years, found that an increase of 10 percentage points in the share of homes that are financed with a mortgage would reduce the share of borrowers who rely on land contracts by 0.4 percentage points. Targeted expansion of mortgage availability, coupled with stronger protections for buyers who use land contracts, could help ensure that safe and affordable financing is available to all Americans who wish to buy a home.
Acknowledgments
This brief was researched and written by Pew staff members Adam Staveski and Seva Rodnyansky. The project team thanks Tara Roche, Omar A. Martinez, Drew Swinburne, and others for providing communications, creative, editorial, and research support for this work.
Technical appendix
This appendix describes the data and methods behind Pew's statistical analysis of land contract usage. To understand when and where homebuyers use land contracts rather than mortgages, Pew researchers analyzed 21 years of property records (2005 to 2025) from ATTOM Data Solutions. The analysis focused on the nine U.S. states with the highest number of recorded land contracts: Indiana, Iowa, Michigan, Minnesota, New Mexico, Ohio, Texas, Washington, and Wisconsin.
Researchers built two regression models to test whether changes in land contract usage were associated with observable county characteristics, such as mortgage usage, and whether those associations were statistically significant. To build the statistical models, researchers aggregated single-family home sales by county and year, making the unit of analysis the “county-year”—the number of land contracts recorded in a single county in a single year. To be included, a county had to record at least one land contract sale in that year. Because counties appear once for each year they recorded a land contract, individual counties enter the analysis multiple times. The data included 10,124 county-years in which at least one home sale was financed with a land contract.
In the average county-year, 2.7% of homes were bought with a land contract and 53.5% with a mortgage; the rest were bought with cash or had no loan recorded for another, unknown reason. (See Table A1, column 1.) Land contract use varied with local conditions: It averaged 3.5% in rural counties and 3.1% in counties with an above-average share of low-cost homes. (See Table A2.) A typical county-year included about 2,573 home sales. Of these, 4.2% were sales of manufactured homes, 11.4% involved a corporate buyer, and 24.6% involved a corporate seller. The median inflation-adjusted sale price over the full 21-year period was $124,668, with a median down payment of 10.5%.
Researchers merged the sales data with demographic information from the American Community Survey’s one-year population estimates. In the average county-year, 25- to 44-year-olds made up 23.9% of the population, 45- to 64-year-olds 26.4%, and people 65 and older 17.3%. On average, 87.9% of residents were non-Hispanic White. (See Table A1, column 2.)
Researchers used two types of regression analysis to identify the main factors driving land contract use at the county level. The first was an ordinary least squares (OLS) regression, which measures the association between the dependent variable (the share of homes purchased with a land contract) and the main independent variable (the share purchased with a mortgage), controlling for the housing, financial, and demographic characteristics listed in Table A1. The second was a panel regression with county and time fixed effects. County fixed effects control for stable, place-specific traits like geography, while time fixed effects control for year-specific factors that affect all counties at once, such as national policy and global conflicts. By absorbing such variations, the panel model yields a more precise estimate of how land contract use responds to variables over time. Results for both models appear in Table A1, columns 3 and 4.
Supplemental analyses examined specific types of housing markets, including rural areas, markets with lower-priced homes, and markets with more sales activity. Averages for those county-years appear in Table A2, and the corresponding regression results appear in Table A3 (OLS) and Table A4 (panel fixed effects).
All of Pew’s statistical models found that higher mortgage use in a county-year was associated with lower land contract use, a relationship that was statistically significant. An increase of 10 percentage points in mortgage use corresponded to a 0.3- to 0.8-percentage-point decrease in land contract use, depending on the model—an 11% to 30% drop relative to the baseline level of 2.7%. Land contract use was also higher where interest rates were higher, fewer homes were sold, corporate sellers made up a larger share of sales, and smaller shares of residents were ages 25-44 or 65 and older. (See Table A1, columns 3 and 4.)
Table A1
Summary of Key Statistical Modeling Results
|
Variable |
All counties with at least one land contract recorded per year |
Estimated coefficient from OLS regression |
Estimated coefficient from panel fixed effects regression |
|
Share of homes purchased with a land contract |
2.7% |
DV |
DV |
|
Share of homes purchased with a mortgage |
53.5% |
-0.069*** |
-0.045*** |
|
Median interest rate |
5.3% |
0.082^ |
0.054** |
|
Average number of homes sold in a year |
2,573 |
-0.006*** |
-0.018*** |
|
Share of sales in rural areas |
53.6% |
0 |
|
|
Share of sales that were manufactured homes |
4.2% |
-0.051** |
-0.012 |
|
Share of sales with corporate buyers |
11.4% |
-0.03 |
0.014 |
|
Share of sales with corporate sellers |
24.6% |
0.016* |
0.019*** |
|
Median nominal sales price |
$124,668 |
0.005*** |
-0.001 |
|
Median down payment share |
10.5% |
-0.002 |
-0.004 |
|
Non-White population share |
12.1% |
0.003 |
0 |
|
Share of 25- to 44-year-olds |
23.9% |
-0.139* |
-0.184** |
|
Share of 45- to 64-year-olds |
26.4% |
0.04 |
-0.053 |
|
Share of population 65 and older |
17.3% |
-0.137*** |
-0.132*** |
|
Constant |
|
0.09** |
0.26*** |
|
Sample size |
10,124 |
8,931 |
8,931 |
|
R-squared |
Adjusted R2: 0.23 |
Within R2: 0.19 |
|
|
Standard error clustering |
|
County-year |
County |
Note: The dependent variable (DV) is the share of homes purchased with a land contract. Each observation is a county-year, so many counties appear multiple times; standard errors are clustered to account for this. The OLS regression clusters standard errors by county and year. The panel fixed effects model accounts for both county and year variation, with standard errors clustered by county. County-years with missing values (no land contract sales) were excluded. The sample comprises the nine U.S. states with the most recorded land contracts. Significance: *** p<0.001, ** p<0.01, * p<0.05, ^ p<0.1.
Table A2
County-Level Descriptive Statistics
|
Variable |
Counties with at least one recorded land contract |
Above-average share of low-cost homes |
Above-average share of manufactured homes |
Rural counties |
Nominal sales price <=$150,000 |
Top 75% of counties by sales |
Top 50% of counties by sales |
|
Share of homes purchased with a land contract |
2.7% |
3.1% |
2.4% |
3.5% |
3.0% |
2.2% |
2.0% |
|
Share of homes purchased with a mortgage |
53.5% |
50.5% |
51.0% |
48.1% |
51.6% |
54.3% |
56.7% |
|
Median interest rate |
5.3% |
5.8% |
5.6% |
5.5% |
5.4% |
5.3% |
5.2% |
|
Average number of homes sold in a year |
2,573 |
1,664 |
1,144 |
548 |
2,034 |
2,987 |
4,002 |
|
Share of sales in rural areas |
53.6% |
69% |
65% |
100% |
60% |
47% |
35% |
|
Share of sales that were manufactured homes |
4.2% |
5.9% |
11.3% |
4.9% |
4.6% |
4.2% |
3.8% |
|
Share of sales with corporate buyers |
11.4% |
10.2% |
10.4% |
9.8% |
10.8% |
12.2% |
13.2% |
|
Share of sales with corporate sellers |
24.6% |
22.8% |
23.7% |
19.4% |
24.2% |
25.8% |
28.1% |
|
Median nominal sales price |
$124,668 |
$64,793 |
$105,115 |
$101,064 |
$83,895 |
$131,992 |
$145,285 |
|
Median down payment |
10.5% |
8.9% |
9.3% |
11.7% |
9.9% |
10.2% |
9.8% |
|
Non-White population share |
12.1% |
13.3% |
12.7% |
9.2% |
11.9% |
12.5% |
14.1% |
|
Share of 25- to 44-year-olds |
23.9% |
23.5% |
23.6% |
22.6% |
23.7% |
24.2% |
24.8% |
|
Share of 45- to 64-year-olds |
26.4% |
26.2% |
26.4% |
26.8% |
26.6% |
26.3% |
26.0% |
|
Share of population 65 and older |
17.3% |
17.8% |
17.7% |
19.3% |
17.1% |
16.9% |
16.2% |
|
Sample size |
10,124 |
4,558 |
3,163 |
5,428 |
7,501 |
8,665 |
6,262 |
Note: All statistics are at the county-year level.
Additional analyses examined land contract use within specific subsets of counties. The association between mortgage use and land contract use was strongest in counties that had an above-average share of manufactured-home sales and counties that had an above-average share of homes selling for less than $150,000. The association with interest rates was strongest in counties with an above-average total of home sales or an above-average share of homes priced below $150,000. (See Table A3.)
The panel models showed similar patterns, including in counties with a higher volume of sales. Mortgage use, interest rates, corporate seller share, sale prices, and the population’s age composition all remained meaningful predictors of land contract use. A larger non-White population share was also associated with more land contract use, particularly in counties with an above-average sales volume. (See Table A4.)
Because Texas and New Mexico do not comprehensively report sales prices—which might weaken the analysis—researchers also ran both models with those two states excluded. In both the OLS and fixed effects models, the same variables remained important predictors of land contract use. (See the final column of Tables A3 and A4.)
Table A3
Regression Results: Cross-Sectional
|
Variable |
All counties with a recorded land contract |
Top 75% of counties by sales |
Top 50% of counties by sales |
Low-cost home share above mean |
Manufactured home sales above mean |
Rural counties |
Nominal sales price <=$150,000 |
Excluding Texas and New Mexico |
|
Share of homes purchased with a mortgage |
-0.07*** |
-0.07*** |
-0.07*** |
-0.07*** |
-0.08*** |
-0.07*** |
-0.08*** |
-0.06*** |
|
Median interest rate |
0.08^ |
0.11*** |
0.11*** |
0.06* |
0.06 |
0.06* |
0.11** |
0.09** |
|
Average number of homes sold in a year (natural logarithm) |
-0.01*** |
0** |
0* |
-0.01*** |
-0.01* |
-0.01*** |
-0.01*** |
-0.01*** |
|
Share of sales in rural areas |
0 |
0 |
0 |
0 |
0 |
0*** |
0 |
0 |
|
Share of sales that were manufactured homes |
-0.05** |
-0.03* |
-0.02 |
-0.07*** |
0 |
-0.03 |
-0.05** |
-0.01 |
|
Share of sales with corporate buyers |
-0.03 |
-0.03** |
-0.04** |
-0.02 |
0.01 |
-0.05** |
-0.02 |
-0.06*** |
|
Share of sales with corporate sellers |
0.02* |
0.01 |
0 |
0.04*** |
0.03* |
0.04** |
0.03*** |
0.02** |
|
Median nominal sales price (natural logarithm) |
0*** |
0*** |
0*** |
0.01*** |
0.01*** |
0.01*** |
0.01*** |
0 |
|
Median down payment share |
0 |
0 |
0 |
0 |
0.01 |
0.01 |
0 |
-0.02* |
|
Non-White population share |
0 |
0 |
0 |
0 |
0 |
-0.01 |
0 |
0.07*** |
|
Share of 25- to 44-year-olds |
-0.14* |
-0.15** |
-0.15** |
-0.14* |
-0.11 |
-0.19* |
-0.2** |
-0.24*** |
|
Share of 45- to 64-year-olds |
0.04 |
0.06^ |
0.08* |
0.09* |
0.07 |
-0.01 |
0.05 |
-0.05 |
|
Share of population 65 and older |
-0.14*** |
-0.15*** |
-0.16*** |
-0.12*** |
-0.19*** |
-0.16*** |
-0.16*** |
-0.13*** |
|
Constant |
0.09** |
0.08*** |
0.08*** |
0.04 |
0.04 |
0.1** |
0.07* |
0.22*** |
|
Sample size |
8,931 |
7,942 |
5,907 |
3,824 |
2,800 |
4,555 |
6,572 |
6,975 |
|
R-squared |
0.23 |
0.22 |
0.25 |
0.26 |
0.25 |
0.17 |
0.23 |
0.23 |
Note: The dependent variable is the share of homes purchased with a land contract. Standard errors are clustered by county and year. Significance: *** p<0.001, ** p<0.01, * p<0.05, ^ p<0.1.
Table A4
Regression Results: Panel
|
Variable |
All counties with a land contract |
Top 75% of counties by sales |
Top 50% of counties by sales |
All counties, excluding Texas and New Mexico |
|
Share of homes purchased with a mortgage |
-0.04*** |
-0.04*** |
-0.03*** |
-0.04*** |
|
Median interest rate |
0.05** |
0.07** |
0.09*** |
0.06^ |
|
Average number of homes sold in a year (natural logarithm) |
-0.02*** |
-0.01*** |
-0.01*** |
-0.02*** |
|
Share of sales that were manufactured homes |
-0.01 |
0.04 |
0.03 |
0.1** |
|
Share of sales with corporate buyers |
0.01 |
0.02^ |
0.02* |
0.02 |
|
Share of sales with corporate sellers |
0.02*** |
0.02*** |
0.02*** |
0.01* |
|
Median nominal sales price (natural logarithm) |
0 |
0*** |
0** |
0* |
|
Median down payment share |
0 |
0 |
0 |
0 |
|
Non-White population share |
0 |
0 |
0 |
-0.02 |
|
Share of 25- to 44-year-olds |
-0.18** |
-0.18** |
-0.15* |
-0.23** |
|
Share of 45- to 64-year-olds |
-0.05 |
-0.03 |
0.04 |
-0.1 |
|
Share of population 65 and older |
-0.13*** |
-0.12** |
-0.12*** |
-0.13** |
|
Constant |
0.26*** |
0.23*** |
0.18*** |
0.32*** |
|
Sample size |
8,931 |
7,942 |
5,907 |
6,795 |
|
Within R-squared |
0.19 |
0.18 |
0.2 |
0.19 |
Note: The dependent variable is the share of homes purchased with a land contract. The panel fixed effects model accounts for both county and year variation, with standard errors clustered by county. Significance: *** p<0.001, ** p<0.01, * p<0.05, ^ p<0.1.
Endnotes
- Adam Staveski, Linlin Liang, and Tara Roche, “Land Contracts Pose 5 Major Risks for Homebuyers,” The Pew Charitable Trusts, 2024, https://www.pew.org/en/research-and-analysis/issue-briefs/2024/07/land-contracts-pose-5-major-risks-for-homebuyers. Sarah Mancini and Margot Saunders, “Land Installment Contracts: The Newest Wave of Predatory Home Lending Threatening Communities of Color,” National Consumer Law Center, 2017, https://www.bostonfed.org/-/media/Documents/cb/2017/spring/land-installment-contracts-the-newest-wave-of-predatory-lending-threatening-communities-of-color.pdf. Ann Carpenter, Taz George, and Lisa Nelson, “The American Dream or Just an Illusion? Understanding Land Contract Trends in the Midwest Pre- and Post-Crisis,” Joint Center for Housing Studies of Harvard University, 2019, https://www.jchs.harvard.edu/sites/default/files/media/imp/harvard_jchs_housing_tenure_symposium_carpenter_george_nelson.pdf.
- Consumer Financial Protection Bureau, “Report on Contract for Deed Lending,” 2024, https://files.consumerfinance.gov/f/documents/cfpb_contract-for-deed_report_2024-08.pdf.
- Joshua Akers and Eric Seymour, “Instrumental Exploitation: Predatory Property Relations at City’s End,” Geoforum 91 (2018): 127-40, https://www.sciencedirect.com/science/article/pii/S0016718518300587. Eric Seymour and Joshua Akers, “Judged by Their Deeds: Outcomes for Properties Acquired by Contract Sellers Following the Foreclosure Crisis in Detroit,” Housing Policy Debate 34, no. 6 (2024): 870-90, https://www.tandfonline.com/doi/abs/10.1080/10511482.2024.2334859.
- Adam Staveski, Linlin Liang, and Tara Roche, “Land Contracts Pose 5 Major Risks for Homebuyers.”
- Dan Immergluck, “Old Wine in Private Equity Bottles? The Resurgence of Contract‐for‐Deed Home Sales in US Urban Neighborhoods,” International Journal of Urban and Regional Research 42, no. 4 (2018): 651-65, https://www.fhcci.org/wp-content/uploads/2019/10/Immergluck-2018-International_Journal_of_Urban_and_Regional_Research.pdf.
- The Pew Charitable Trusts, “Millions of Americans Have Used Risky Financing Arrangements to Buy Homes,” 2022, https://www.pew.org/en/research-and-analysis/issue-briefs/2022/04/millions-of-americans-have-used-risky-financing-arrangements-to-buy-homes. Tara Roche and Adam Staveski, “How Americans Pay for Their Homes,” The Pew Charitable Trusts, 2025, https://www.pew.org/en/research-and-analysis/articles/2025/08/22/how-americans-pay-for-their-homes.
- National Consumer Law Center, “Summary of State Land Contract Statutes,” 2021, https://www.pew.org/-/media/assets/2022/02/summary-of-state-land-contract-statutes.pdf.
- The Pew Charitable Trusts, “Millions of Americans Have Used Risky Financing to Buy Homes.”
- Consumer Financial Protection Bureau, “2023 Mortgage Market Activity and Trends,” 2024, https://files.consumerfinance.gov/f/documents/cfpb_2023-mortgage-market-activity-and-trends_2024-12.pdf.
- Khristi Waters and Li-Ning Huang, “Leveraging Variable and Gig Income to Expand Access to Homeownership,” Fannie Mae, 2025, https://www.fanniemae.com/research-and-insights/perspectives/leveraging-variable-and-gig-income-expand-access-homeownership.
- The Pew Charitable Trusts, “Indiana Residents Often Use Land Contracts to Purchase Low-Cost Homes,” 2026, https://www.pew.org/en/research-and-analysis/fact-sheets/2026/05/indiana-residents-often-use-land-contracts-to-purchase-low-cost-homes. The Pew Charitable Trusts, “Michigan Homebuyers Used the Most Land Contracts in the Nation Over Nearly 2 Decades,” 2024, https://www.pew.org/en/research-and-analysis/fact-sheets/2024/10/michigan-homebuyers-used-the-most-land-contracts-in-the-nation-over-nearly-2-decades. The Pew Charitable Trusts, “Despite Risks, Thousands of Minnesotans Buy Homes Using ‘Contracts for Deed,’” 2024, https://www.pew.org/en/research-and-analysis/fact-sheets/2024/03/despite-risks-thousands-of-minnesotans-buy-homes-using-contracts-for-deed. The Pew Charitable Trusts, “New Mexico Homebuyers Often Use Land Contracts Instead of Mortgages to Purchase Smaller, Older Homes,” 2026, https://www.pew.org/en/research-and-analysis/fact-sheets/2026/03/new-mexico-homebuyers-often-use-land-contracts-instead-of-mortgages-to-purchase-smaller-older-homes. The Pew Charitable Trusts, “Thousands of Ohio Homebuyers Have Used Land Contracts Over the Past 2 Decades,” 2024, https://www.pew.org/en/research-and-analysis/fact-sheets/2024/09/thousands-of-ohio-homebuyers-have-used-land-contracts-over-the-past-2-decades. The Pew Charitable Trusts, “Rural Washingtonians Often Use Land Contracts,” 2025, https://www.pew.org/en/research-and-analysis/fact-sheets/2025/12/rural-washingtonians-often-use-land-contracts. The Pew Charitable Trusts, “For Wisconsin Homebuyers, Land Contracts Offer Opportunity—and Risks,” 2026, https://www.pew.org/en/research-and-analysis/fact-sheets/2026/02/for-wisconsin-homebuyers-land-contracts-offer-opportunity-and-risks.
- The Pew Charitable Trusts, “Small Mortgages Are Too Hard to Get,” 2023, https://www.pew.org/en/research-and-analysis/issue-briefs/2023/06/small-mortgages-are-too-hard-to-get.
- U.S. Department of Housing and Urban Development, “Financing Lower-Priced Homes: Small Mortgage Loans,” 2022, https://www.huduser.gov/portal/portal/sites/default/files/pdf/Financing-Lower-Priced-Homes-Small-Mortgage-Loans.pdf.
- Mike Fratantoni et al., “How Do Mortgage Revenues, Costs and Profitability Vary by Loan Balance? An Analysis Using Benchmarking Data,” Mortgage Bankers Association, 2023, https://www.mba.org/docs/default-source/research-and-forecasts/research-white-papers/impact-of-loan-size-on-profits-9-7-2023.pdf?sfvrsn=7cf06db1_1.
- The Pew Charitable Trusts, “Small Mortgages Are Too Hard to Get.”
- The Pew Charitable Trusts, “States Hold the Keys to Greater Mortgage Access for Manufactured Home Buyers,” 2026, https://www.pew.org/en/research-and-analysis/issue-briefs/2026/02/states-hold-the-keys-to-greater-mortgage-access-for-manufactured-home-buyers. “Data Shows Lack of Manufactured Home Financing Shuts Out Many Prospective Buyers,” Linlin Liang, Rachel Siegel, and Adam Staveski, The Pew Charitable Trusts, 2022, https://www.pew.org/en/research-and-analysis/articles/2022/12/07/data-shows-lack-of-manufactured-home-financing-shuts-out-many-prospective-buyers.
- The Pew Charitable Trusts, “1 in 5 Manufactured Home Borrowers Use Risky Contract Financing,” 2025, https://www.pew.org/en/research-and-analysis/issue-briefs/2025/01/1-in-5-manufactured-home-borrowers-use-risky-contract-financing.
- Adam Staveski, “Small Mortgages Offer Opportunity to Invest in Rural Communities,” The Pew Charitable Trusts, 2024, https://www.pew.org/en/research-and-analysis/articles/2024/12/17/small-mortgages-offer-opportunity-to-invest-in-rural-communities.
- Adam Staveski, “Small Mortgages Offer Opportunity.”
- “3 Major Obstacles Limit Rural Homeownership,” Adam Staveski, The Pew Charitable Trusts, 2024, https://www.pew.org/en/research-and-analysis/articles/2024/12/19/3-major-obstacles-limit-rural-homeownership.
- “What Is Heirs’ Property, and Why Does It Matter for Equitable Homeownership?” Amalie Zinn, Housing Matters, 2023, https://housingmatters.urban.org/articles-features/what-heirs-property-and-why-does-it-matter-equitable-homeownership.
- Laurie Goodman, Ted Tozer, and Michael Neal, “How Do We Rehabilitate the FHA’s 203(k) Rehabilitation Program?” The Urban Institute, 2023, https://www.urban.org/sites/default/files/2023-04/How%20Do%20We%20Rehabilitate%20the%20FHA%E2%80%99s%20203%28k%29%20Rehabilitation%20Program%3F.pdf. U.S. Department of Housing and Urban Development, “203K Endorsement Summary Report,” 2025, https://apps.hud.gov/pub/chums/f17fvc/F17FVCY-20251001.txt.
- Adam Staveski, Linlin Liang, and Tara Roche, “Land Contracts Pose 5 Major Risks for Homebuyers.”
People


