Nonprofits Make Major Contributions to Philadelphia’s Economy
These organizations report over $48 billion in revenue annually

Overview
Nonprofits are a major contributor to Philadelphia’s economic and social ecosystem, reporting $48.5 billion in total revenue in their most recent filings—an amount equal to more than one-third of the city’s gross domestic product.1 To estimate the scale and economic impact of the local nonprofit sector, The Pew Charitable Trusts examined data from the documents that these tax-exempt organizations are required to file annually with the Internal Revenue Service.2 This fact sheet is part of Pew’s ongoing series on nonprofits in Philadelphia, the first part of which focused on nonprofit employment, which makes up 30% of private employment in the city.3
The latest analysis found that:
- About 84% of the $48.5 billion was generated by more than 760 education and health services institutions, known locally as “eds and meds.”
- Annual revenue varied widely based on the size and category of the nonprofit, with a significant portion of the total reported revenue generated by just a few eds and meds institutions.
- The degree to which organizations relied on different revenue sources—including government grants, private contributions, and program services—differed greatly depending on organizations’ size and activities.
This fact sheet examines various aspects of revenue for Philadelphia nonprofits, defined here as 501(c)(3)s. To analyze the data, Pew used the Cause IQ database, which collects, categorizes, and maintains data on tax-exempt organizations using multiple sources, including IRS tax filing documentation.4 Depending on when their fiscal years end, organizations file their tax returns at different points throughout the calendar year. To accurately represent active nonprofits in the city, Pew analyzed the latest filings available for organizations from January 2023 through December 2024. As such, organizations that ceased operations after January 2023 are included in this analysis, while organizations that launched more recently may not be.
Eds and meds accounted for 84% of total reported revenue among Philadelphia nonprofits
According to data accessed on May 2, 2025, over 3,000 nonprofit organizations in Philadelphia had filed IRS Forms 990, 990-EZ, or 990-PF from January 2023 through December 2024. In these filings, nonprofits report their total revenue, expenses, assets, and liabilities. Revenue includes incoming funds to cover operating expenses, such as grants and donations, as well as revenue from program services. The organizations in this analysis reported a combined total of $48.5 billion in revenue from various sources in their latest filings. The organizations range from large universities and medical institutions to small, community-based nonprofits with one or two staff members.
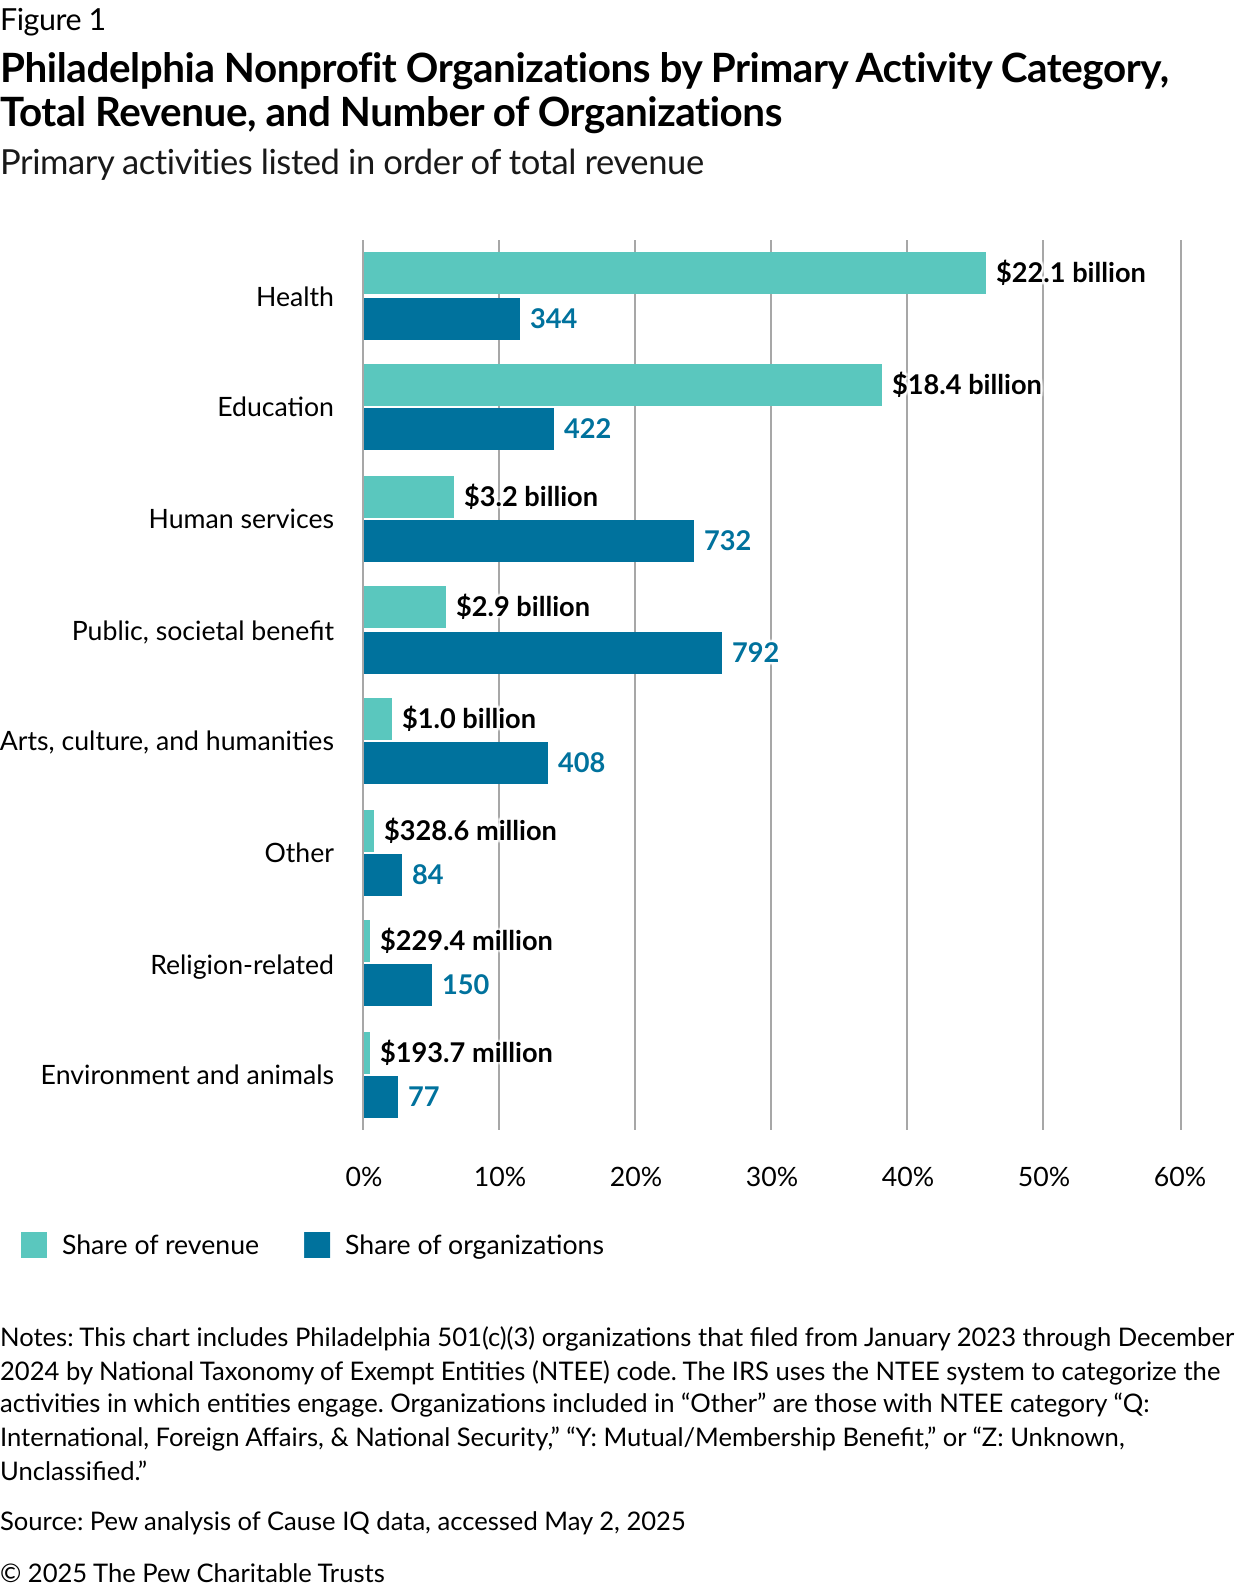
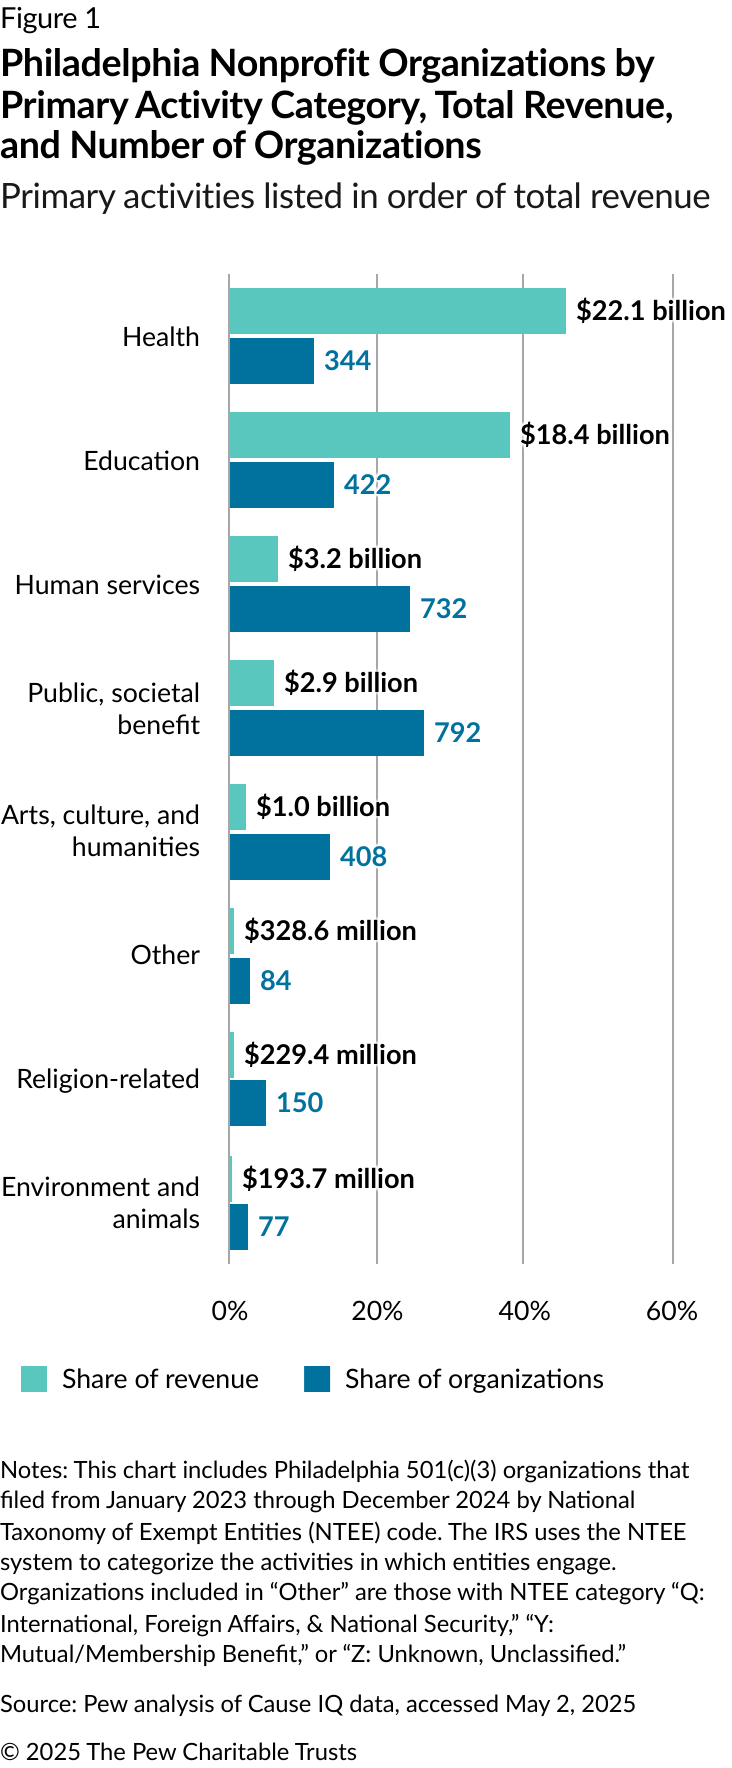
Organizations’ reported revenue varied significantly based on what they do, as defined by the National Taxonomy of Exempt Entities (NTEE) classification system that the IRS uses.5
For instance, organizations categorized primarily as “public, societal benefit”—which include foundations and groups focused on community and economic development as well as human rights—made up over 25% of filing organizations (792) but only 6% of total reported revenue ($2.9 billion in all). Meanwhile, health organizations, such as the city’s major hospitals, accounted for 11% of organizations (344) but 46% of total revenue ($22.1 billion). And the 14% of organizations in the education category (422), which includes the city’s universities, had 38% of total revenue ($18.4 billion). (See Figure 1.) The eds and meds sectors combined reported more than $40 billion in revenue—84% of the citywide total.
The average revenue per organization was $16.1 million; however, the median revenue was just 2% of that ($334,796), indicating that a small number of organizations were generating very large amounts of revenue. This was true across all categories of organizations—but particularly in education and health. In fact, a small group of the largest eds and meds institutions accounted for more than half of all reported revenue, with the University of Pennsylvania and its hospital alone making up 25%. The other institutions in that group include The Children’s Hospital of Philadelphia, Thomas Jefferson University and its hospital, Temple University and its hospital, and Drexel University.6
Program services made up the largest share of revenue, followed by grants and contributions
Nonprofits file different types of IRS Form 990 based on their status. Most of the organizations included in this analysis (1,826, or 61%) filed Form 990, which is designated for firms with gross receipts of $200,000 or more, or assets of $500,000 or more. The other organizations filed either Form 990-EZ, intended for smaller organizations with lower revenue, or 990-PF, intended for private foundations regardless of size or finances. Those 1,826 organizations accounted for 97% of the total reported revenue—$46.8 billion of the $48.5 billion. (See Table 1.) Pew used this subset of organizations to analyze individual components of reported revenue, as some of the components are not required in the 990-PF and 990-EZ.
Table 1
IRS 990 Form Types and Reported Revenue
Philadelphia 501(c)(3) organizations with most recent filings, 2023-24
| Form | Status | Number of organizations/percentage of total | Total revenue/percentage of total |
|---|---|---|---|
| 990 | Gross receipts ≥ $200,000 or total assets ≥ $500,000 | 1,826/61% | $46.8 billion/97% |
| 990-EZ | Gross receipts < $200,000 and total assets < $500,000 | 662/22% | $0.04 billion/<1% |
| 990-PF | Private foundation, regardless of financial status | 521/17% | $1.6 billion/3% |
| Total | 3,009 | $48.5 billion | |
Note: A fourth form, 990-N, is intended for organizations with annual gross receipts below $50,000. Filers of 990-N were not included in the analysis due to limited revenue data. That said, organizations that qualify for 990-N or 990-EZ are allowed to file a regular 990, meaning that organizations meeting those criteria could be included in this analysis of 990 filers. Figures in the “total revenue” column may not add up due to rounding.
Sources: IRS; Pew analysis of Cause IQ data, accessed May 2, 2025

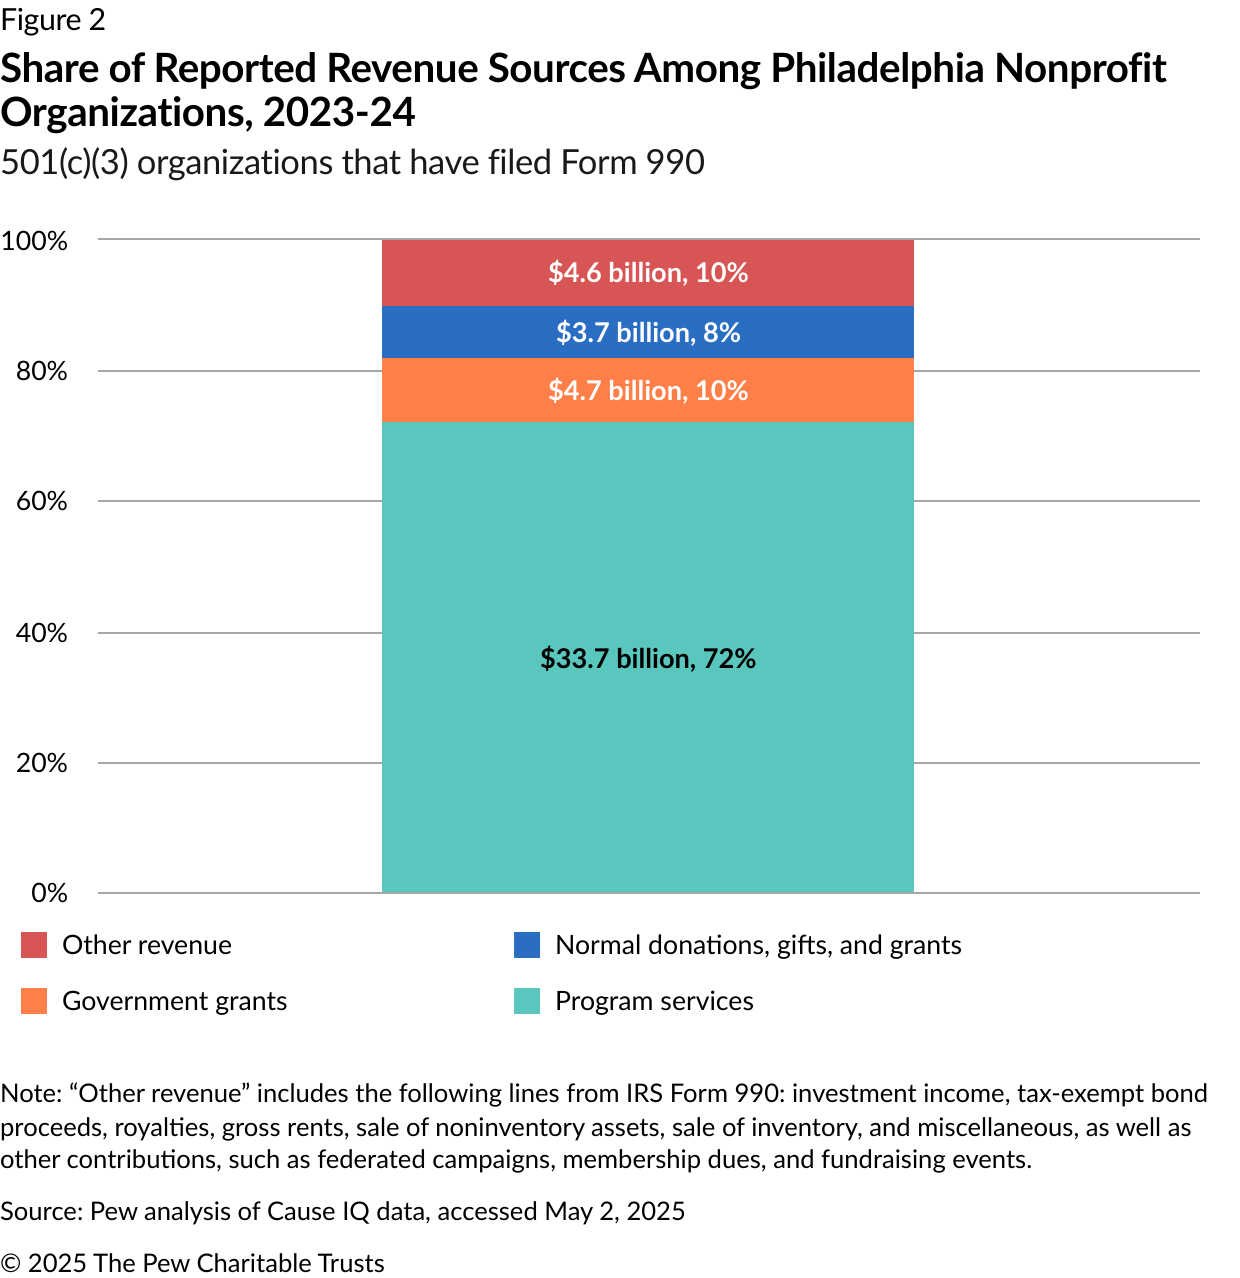
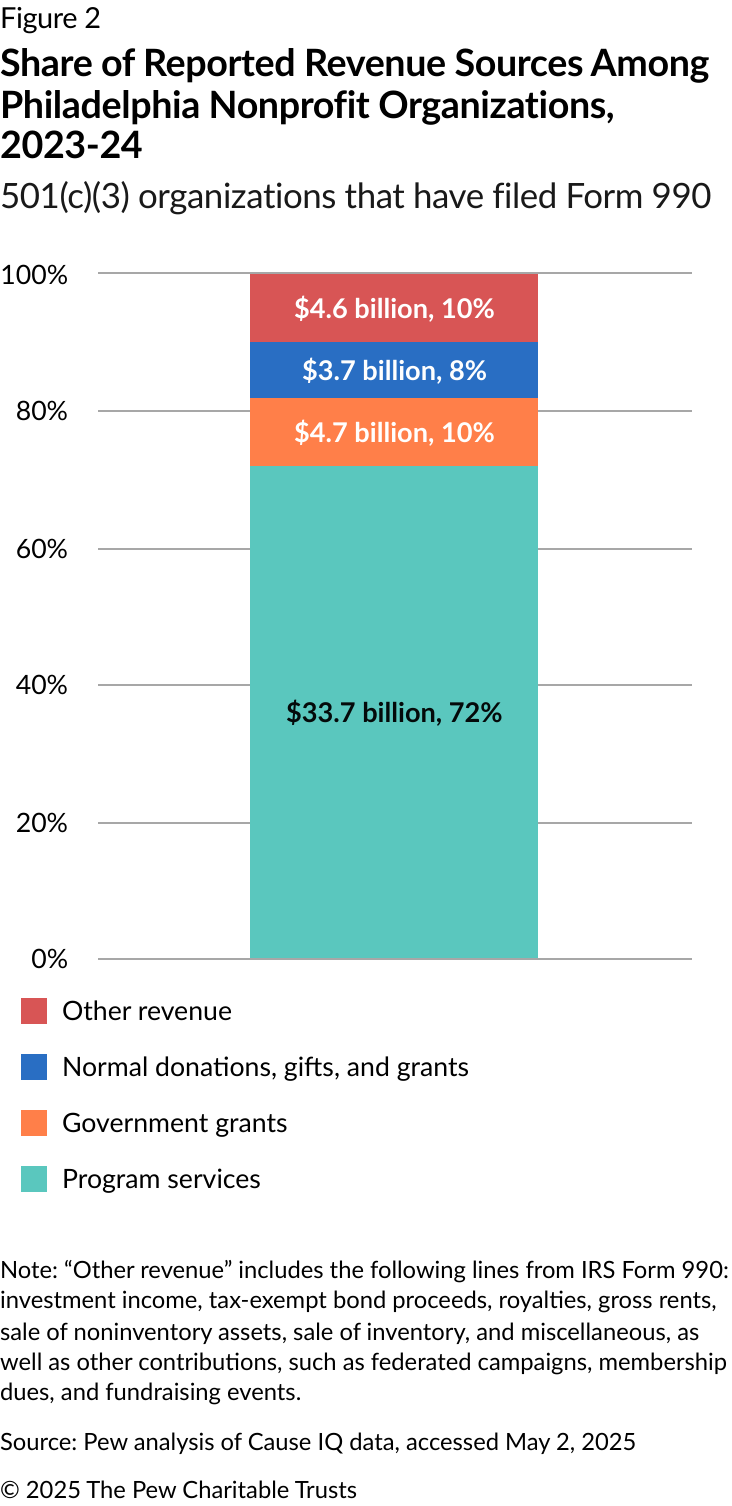
Organizations filing Form 990 must complete Part VIII: Statement of Revenue, which lists revenue sources and amounts from the tax year being reported. The vast majority of revenue reported by the 1,826 Philadelphia-based organizations filing 990s came from two sections of this statement: “Program Service Revenue” and “Contributions, Gifts, Grants, and Other Similar Amounts.” Analysis of the data included in those sections shows that the revenue came primarily from three sources:
- Program services: Includes revenue such as tuition fees or medical care, including fee-for-service reimbursements, like Medicaid. This category made up 72%, or $33.7 billion, of total reported revenue.7
- Government grants (contributions): Includes grants and other contributions from local, state, federal, or international government entities. This category made up about 10%, or $4.7 billion, of total revenue.8 This category will be referred to as “government grants” throughout the remainder of this fact sheet.
- Normal donations, gifts, and grants: Includes cash contributions such as gifts, grants, and donations from nongovernmental sources. This category made up 8%, or $3.7 billion, of total revenue.9
For the purposes of this analysis, all other revenue sources in Part VIII of Form 990 were included as “other revenue.”10 (See Figure 2.)
Government grants do not necessarily include all reported revenue originating from government entities. Many reimbursements would be reported as program services, such as reimbursement from treating patients receiving Medicaid-covered health care, and so would certain types of government contracts, such as providing professional services for a local government.11 This level of detail is not included on Form 990.
The breakdown of revenue components looked quite different for nonprofits with the greatest revenue compared with organizations with low and medium revenue.
For the purpose of this analysis, organizations were split into four groups based on total revenue:
- Organizations with less than $250,000 in revenue (20% of total organizations).
- Organizations with $250,000 to less than $1 million (30%).
- Organizations with $1 million to less than $5 million (24%).
- Organizations with $5 million or more in revenue (25%).12
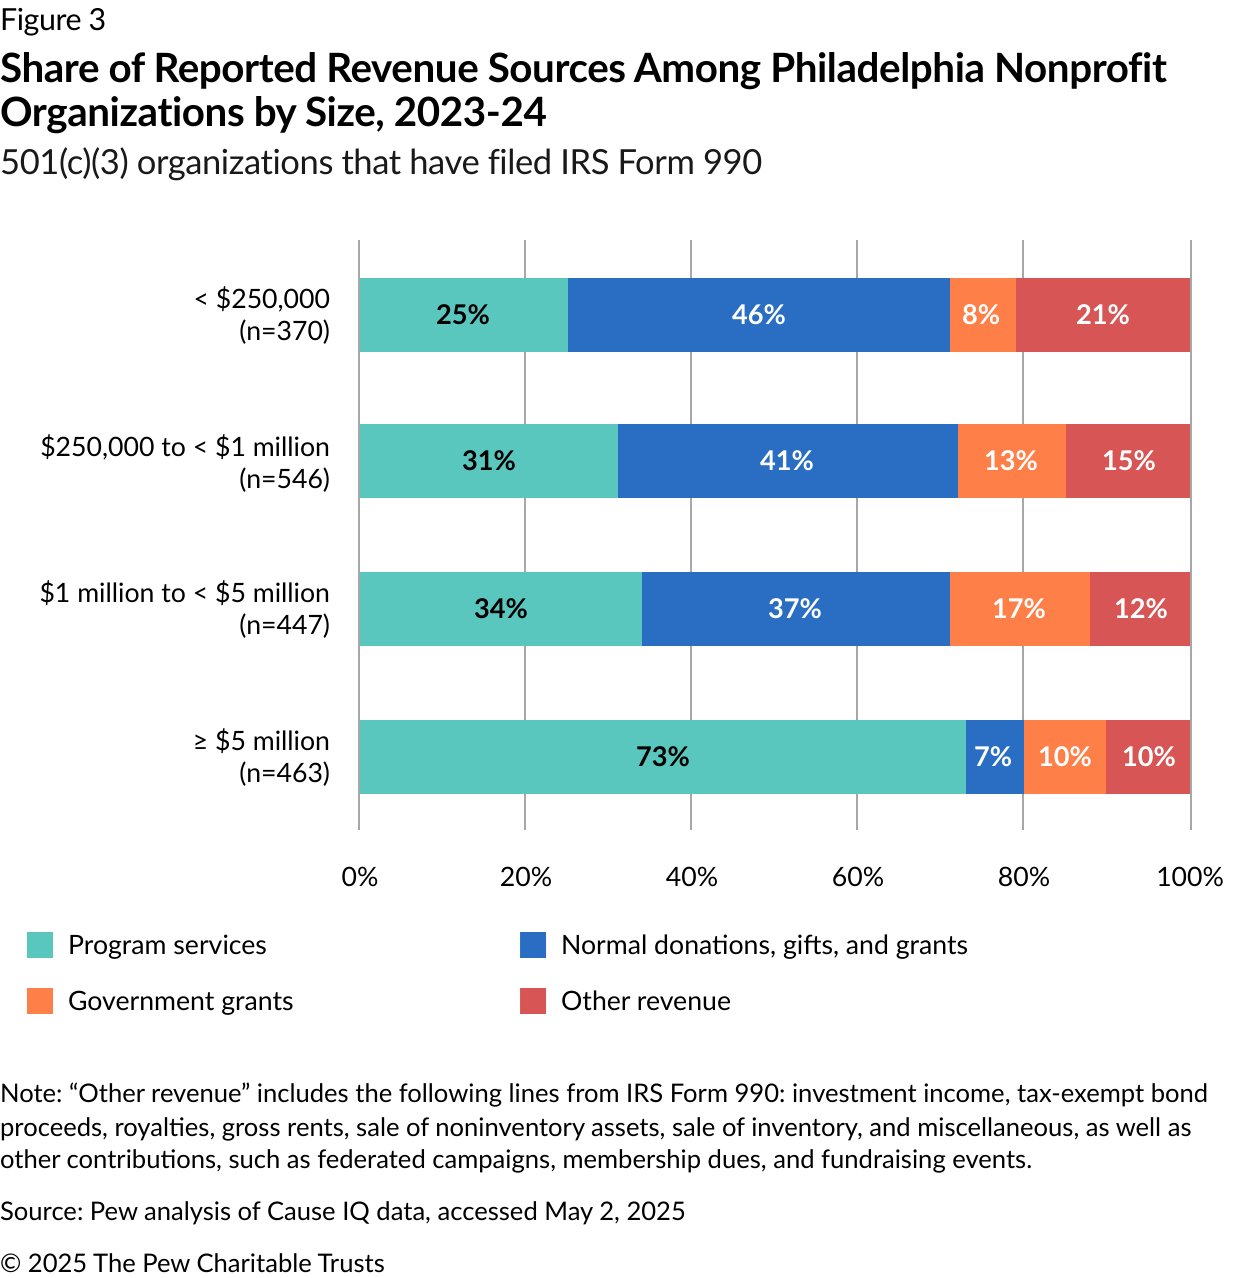
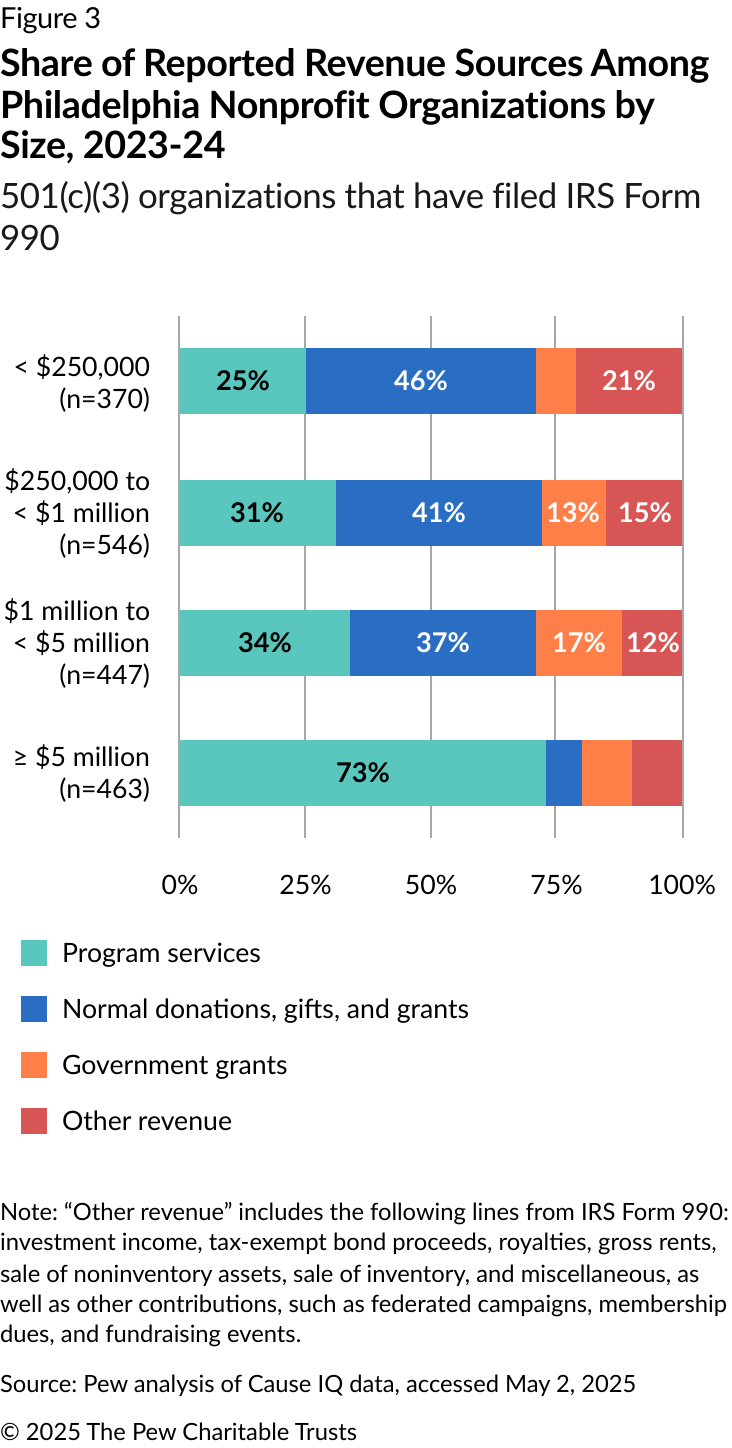
Organizations in Group 4 accounted for 97% ($45.5 billion) of the total revenue analyzed for Form 990 filers. As shown in Figure 3, the four groups vary significantly in terms of revenue sources. The higher an organization’s revenue, the more likely it is to rely on program services, with this category making up 25% of Group 1 revenue, compared with 73% for Group 4. Normal donations, gifts, and grants made up around 40% of revenue for organizations in the first three groups but only 7% of revenue for Group 4. As for government grants, the organizations in Groups 2 and 3 received larger shares of their revenue from this source (13% and 17%, respectively), compared with those in Groups 1 and 4 (8% and 10%, respectively).
Organizations also had varying revenue makeups based on the type of activities they conducted.
Human services organizations, which made up almost one-third of the total nonprofits but only 7% of total reported revenue, received the largest share of government grants by far, compared with nonprofits in other activity categories. Many of the organizations in this sector—such as those focused on public housing, workforce development, and child welfare services—perform functions traditionally carried out by government entities, and have appointed leadership teams and large shares of funding from government streams.
Human services nonprofits accounted for 31% of all government grant revenue, and this funding source made up 45% of total reported revenue in the human services category. This suggests that these organizations, which often directly serve community members in need, could be more susceptible to shifts in government funding than larger organizations are.
Nonprofits with government grants had higher levels of revenue from all sources
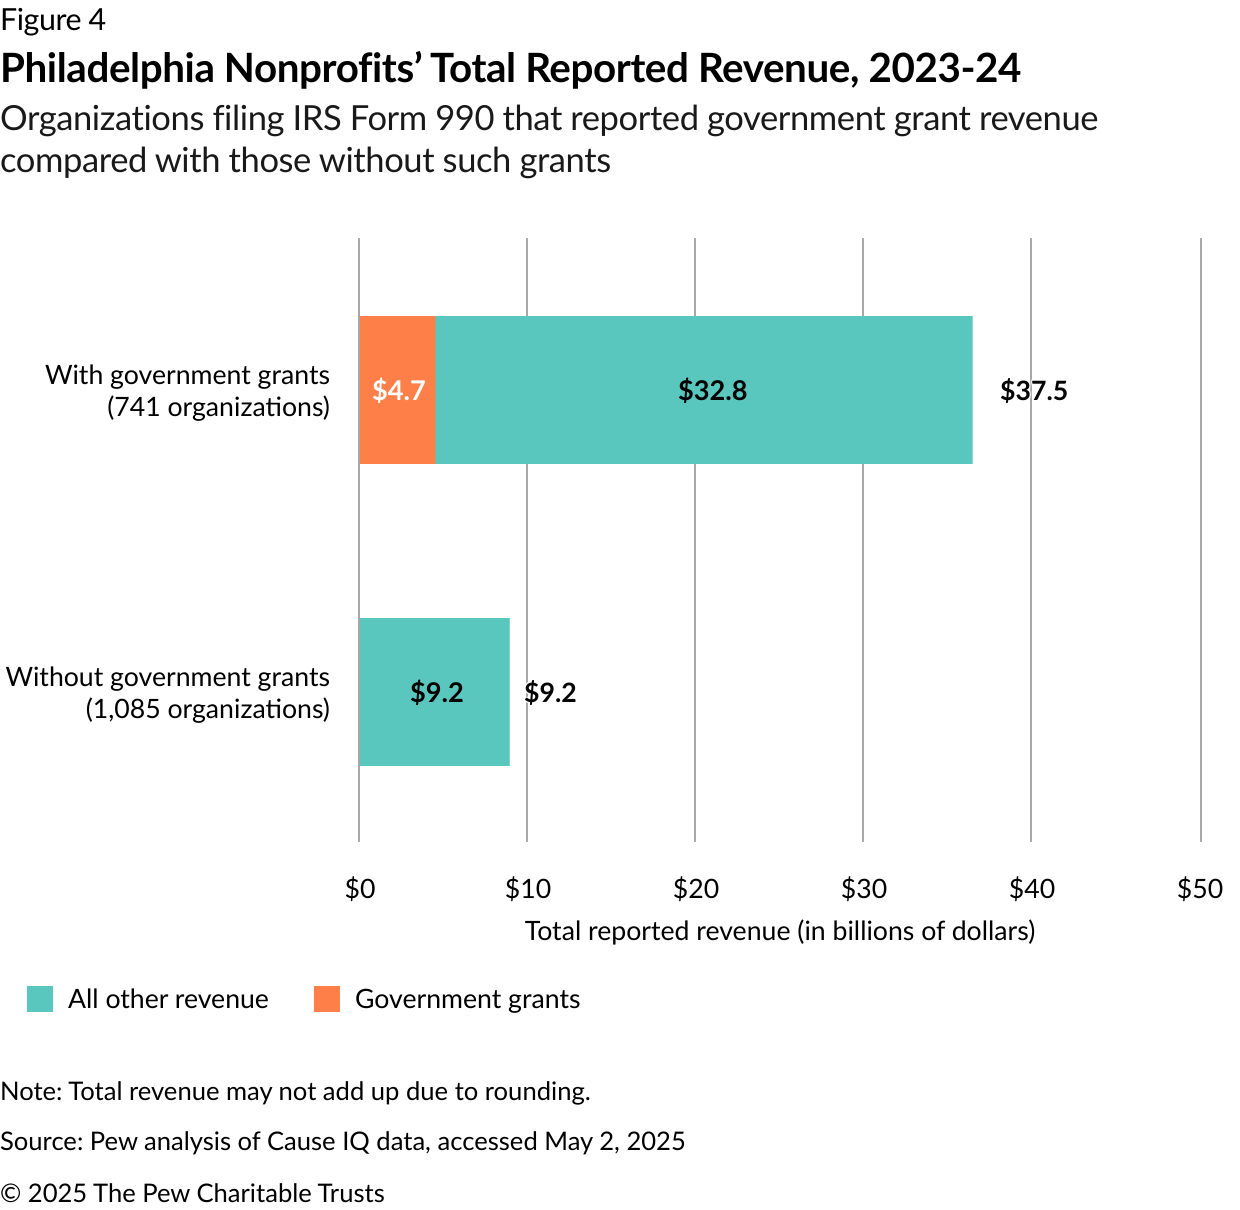
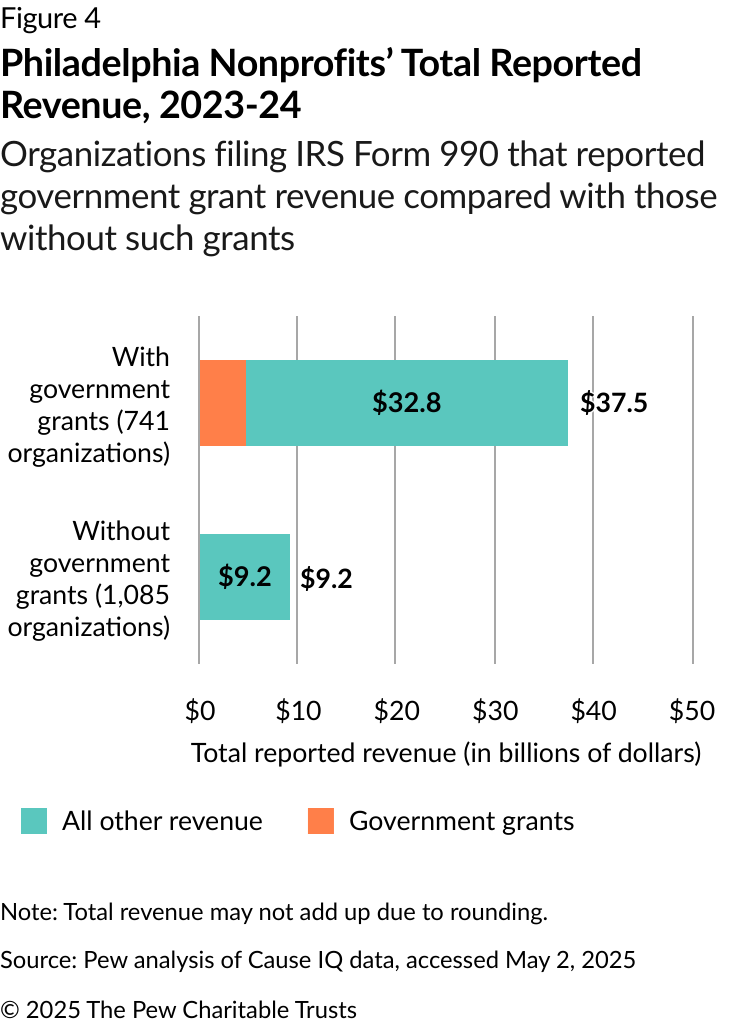
Regardless of activity category or level of revenue, nonprofits that received grants from government entities at any level—including local, state, or federal—had higher levels of overall revenue than those that did not. (See Figure 4.) Of the 1,826 Form 990 filers, 741 (41%) had revenue from government grants. These organizations accounted for 80% of total revenue among 990 filers, and their operations were generally larger than those that did not receive government grants. Their median total reported revenue was $2.9 million, compared with $551,235 for organizations that did not receive such grants.
Organizations with government grants had higher levels of other types of revenue as well. On the whole, program services remained the largest source of revenue, regardless of whether an entity received government grants; however, for organizations with such grants, the median revenue from program services was $272,228, compared with $51,644 for organizations without government grants. These findings align with Urban Institute research indicating that larger organizations are better able to go through the steps necessary to obtain and manage government grants.13 Again, it is important to keep in mind that program services revenue frequently includes forms of government funding as well, such as reimbursements for services and certain contracts, so all government funding for nonprofits is not wholly captured within the government grants category.
Conclusion

The size of Philadelphia’s nonprofit sector is roughly equal to one-third of the city’s economy, generating more than $48 billion in revenue annually, with a small group of organizations representing a large share of that revenue. And although government grants make up only about 10% of overall revenue, the percentage is higher for smaller organizations, as well as for those focusing on human services; as such, these groups may be more affected by shifts in government funding levels.
Endnotes
- “FRED Economic Data Series GDPALL42101,” Federal Reserve Bank of St. Louis, Dec. 4, 2024, https://fred.stlouisfed.org/series/GDPALL42101.
- “Charities and Nonprofits,” U.S. Internal Revenue Service, Jan. 24, 2025, https://www.irs.gov/charities-and-nonprofits.
- “Nonprofit Sector Is Vital, If Vulnerable, Piece of Philadelphia’s Economy,” Alix Sullivan, The Pew Charitable Trusts, May 6, 2025, https://www.pew.org/en/research-and-analysis/articles/2025/05/06/nonprofit-sector-is-vital-if-vulnerable-piece-of-philadelphias-economy.
- “Cause IQ,” https://www.causeiq.com/.
- “National Taxonomy of Exempt Entities (NTEE) Codes,” Urban Institute, National Center for Charitable Statistics, April 2, 2019, https://urbaninstitute.github.io/nccs-legacy/ntee/ntee-history.html.
- Exempt entities categorized as the largest eds and meds institutions from the analysis include the following, as named in their 990 filings: University of Pennsylvania; Perelman School of Medicine at the University of Pennsylvania; Pennsylvania Hospital of the University of Pennsylvania Health System; The Children’s Hospital of Philadelphia; Thomas Jefferson University; Thomas Jefferson University Hospital; Temple University; Temple University Hospital; and Drexel University. This is not necessarily an exhaustive list of exempt entities associated with these major institutions.
- “Form 990: Return of Organization Exempt From Income Tax,” U.S. Internal Revenue Service, 2024, https://www.irs.gov/pub/irs-pdf/f990.pdf.Part VIII, Line 2.
- “Form 990,” U.S. Internal Revenue Service. Part VIII, Line 1e.
- “Form 990,” U.S. Internal Revenue Service. Part VIII, Line 1g.
- “Form 990,” U.S. Internal Revenue Service. Part VIII.
- “2024 Instructions for Form 990: Return of Organization Exempt From Income Tax,” U.S. Internal Revenue Service, 2024, Jan. 8, 2025, https://www.irs.gov/pub/irs-pdf/i990.pdf.
- Sum of percentages may not equal 100% due to rounding.
- Hannah Martin et al., “Nonprofit Trends and Impacts 2021-2023: National Findings on Government Grants and Contracts From 2019 to 2023,” Urban Institute Center on Nonprofits and Philanthropy, 2024, https://www.urban.org/sites/default/files/2024-10/Nonprofit_Trends_and_Impacts_2021-2023_National_Findings_on_Government_Grants_and_Contracts.pdf.
People


