The Aging Population Is Changing States’ Revenue, Spending, and Service Demand Outlook
Assessment and planning can help manage the budget challenges of this ongoing demographic shift

Overview
The United States’ population is aging rapidly. And as with other long-term shifts in social and economic conditions, the transition to an older population is already affecting state revenue and expenditures.1 Understanding and preparing for these ongoing changes will be critical to states’ future fiscal sustainability.
Although the share of the population age 65 or older has been increasing for at least a century, the pace of growth has surged over the past 15 years, and states are taking a variety of actions in response to the aging of their populations.2 Many states are assessing specific fiscal impacts, such as revenue and expenditure changes and rising service costs. Most states also produce needs assessments to understand which services their older populations will require, and these results can help inform future investments across state programs. Analysis of recent state needs assessments by The Pew Charitable Trusts finds that transportation, caregiver support, housing, and healthcare were the critical needs that states most frequently identified for their growing older adult populations.
In addition, setting clear goals, collecting robust data, and using strategic plans to coordinate across agencies can help states plan for future service needs, anticipate fiscal changes, and address crosscutting challenges that will result from this demographic shift. By taking steps to assess and strategize now, states can make informed budget decisions for the future.
State populations are growing older
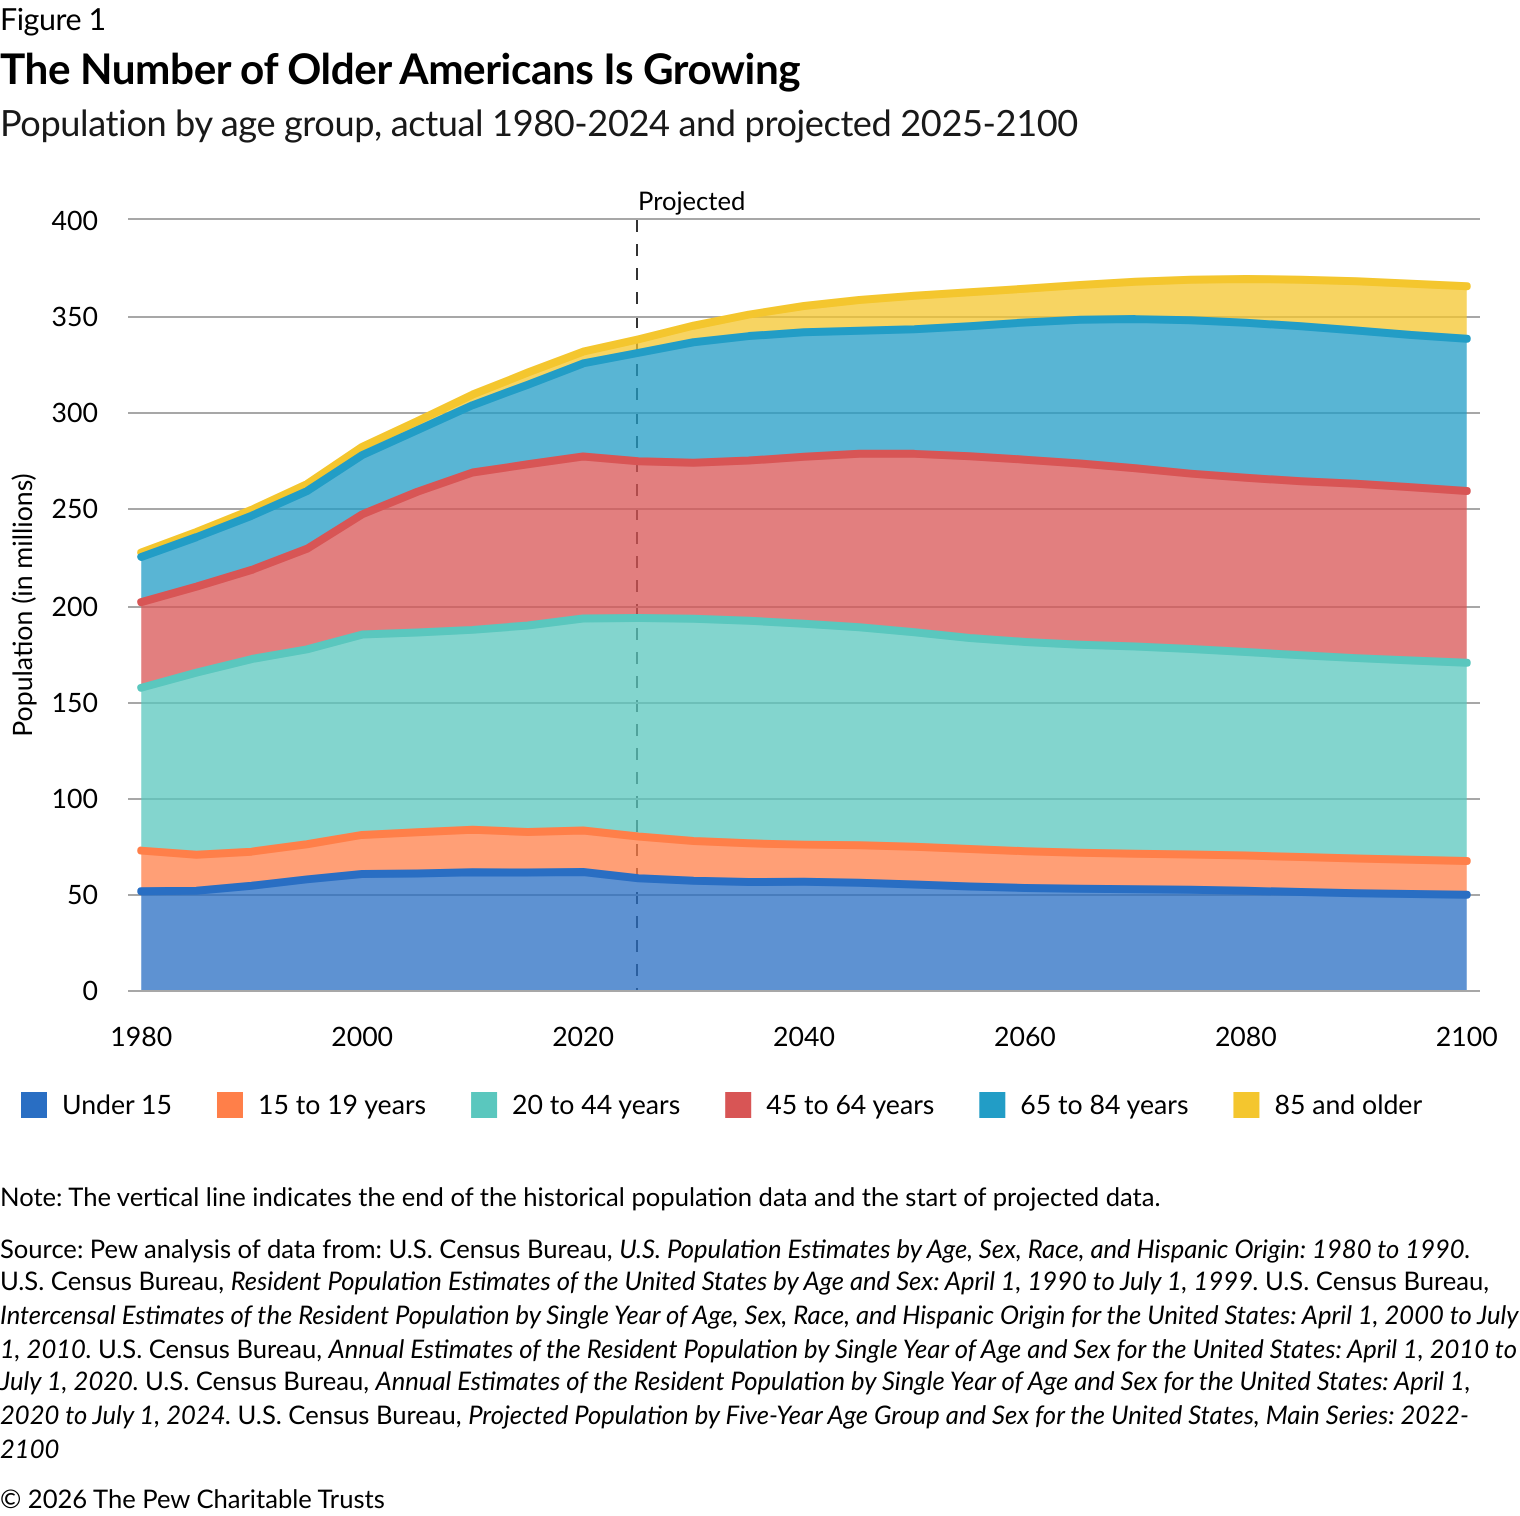
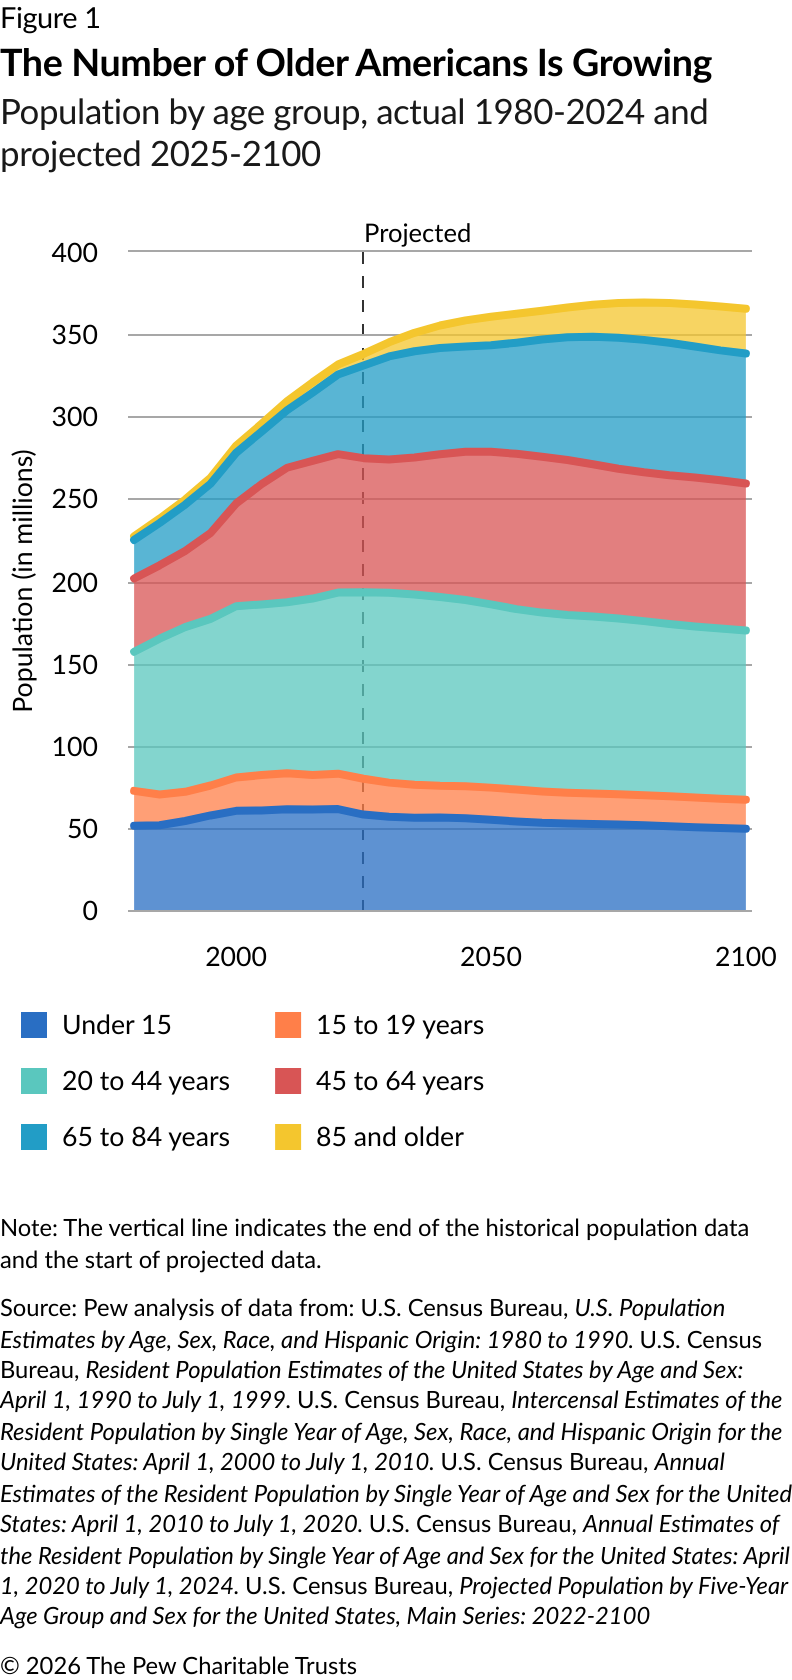
A combination of declining fertility and increasing life expectancy is shifting the age makeup across the United States.3 (See Figure 1.) The share of the population age 65 and older rose from 12.4% in 2004 to 18% in 2024, and more than 20% of the population is projected to be older than 65 by 2030.4
Although state populations are aging at different rates, all states saw their older populations grow from 2010 to 2020, and in almost all states, older populations are projected to continue increasing through at least 2050.5 And as the number of older adults rises, the number of working-age adults and children is projected to decline, causing a significant shift in the age makeup of the population across the U.S.6
Aging populations create three areas of budget risk
Demographic shifts, including slowing population growth, shrinking child and working-age populations, and increasing older populations, will have complex fiscal effects on state budgets.7 Understanding the specific fiscal dynamics of an aging population is critical for making sustainable budget decisions moving forward.
Revenue changes
Personal income and spending patterns change with age and tend to decrease after retirement age.8 And because nearly two-thirds of states’ tax revenue, as of fiscal year 2024, comes from income and sales taxes, most state tax revenue will be affected by these shifts.9 Studies have forecast modest declines in states’ per capita revenue from personal income and sales taxes based on future demographic changes.10 The specific effects will depend on each state’s tax structure and reliance on different tax revenue streams. For example, the implications may be more severe in Utah, which derives more than 75% of its tax revenue from personal income and sales taxes, than in North Dakota, which gets less than 40% of its tax revenue from those sources.11 Additionally, states have a variety of tax exemptions for older adults, such as for pension income, which may lead to decreased revenue as the proportion of the population that uses these benefits increases.12
Health expenditures
Aging populations are also associated with higher healthcare spending, which can affect state budgets through multiple avenues. States are already facing increasing Medicaid costs—their largest combined expense after K-12 education—driven in part by higher coverage costs for adults over 65, who made up only 10% of program enrollment in 2023 but accounted for 21% of expenditures.13 Older Americans and those eligible for Medicaid because they require long-term services and supports (LTSS) cost more per enrollee because they have higher rates of chronic conditions and complex health challenges.14 In particular, because adults age 85 and older are more likely than younger people to need LTSS, states could face additional long-term care costs as their numbers grow.15 The aging population may also exacerbate the cost effects of recent federal changes to Medicaid.16
States also face other growing health-related expenses. Prison populations, like the broader population, are aging, and incarceration costs significantly more for older adults than for younger individuals largely because of older people’s higher risk of chronic health conditions.17 Additionally, most states are contending with unfunded retiree pension and healthcare liabilities—gaps between the amounts needed and available to pay for promised benefits to public employees.18 Unfunded retiree healthcare costs alone were equivalent to 45.4% of states’ combined tax and fee revenue in fiscal 2019.19 And as more state employees retire, the costs of these unfunded liabilities may also increase. For example, New Mexico’s Legislative Finance Committee estimates that retiree healthcare obligations will reach the state’s top 10 tax expenditures by fiscal 2029 and rise through 2050.20
Demand for state services
Governments have long recognized the needs of older adults and provided programs to support this population, including Social Security, established in 1935, and the Older Americans Act (OAA), which passed in 1965 and funds services for millions of people each year.21 States supplement some federal programs with their own funds—including OAA, for which federal funds have not kept up with demand—and provide home care, nutrition programs, and other services targeted to older adults.22

Additionally, general state services, such as transportation and housing programs, also support older adults. As a result, an aging population is likely to increase demand for a variety of state services and, with them, costs. For example, because adults older than 65 are more likely than working-age people to live in low-income households, more older adults may boost demand for programs such as rental and utility assistance.23 Pew-funded research from Econsult Solutions estimates that by 2040, the number of older adult households with low incomes will reach 32.6 million—up from 22.8 million in 2020—and will represent 61% of older adult households.24
Further, housing is an increasing concern for older adults broadly and may require additional state support.25 Although homeownership is higher among older adults compared with younger cohorts, the shares of older homeowners that hold mortgages and are burdened by their housing costs have grown over the past two decades.26 Additionally, older adults now make up almost half of the U.S. homeless population.27
Compounding these challenges, many older adults also have insufficient retirement savings, which Econsult Solutions’ research estimates will add $334 billion through 2040 to state matching and administrative costs for Medicaid, the Supplemental Nutrition Assistance Program (SNAP), OAA, and other federal programs.28 State-funded public assistance programs, especially those targeting an older population, may see similar increases.
And with fewer older adults able to afford retirement or the costs of long-term care, the prevalence of informal family caregivers is also increasing.29 Of the 59 million people caring for adults in 2025, almost half were caring for adults age 75 and older.30 AARP estimates that 80% of caregivers in 2025 received no payment for those services, which leads to negative financial impacts including debt and overdue bills.31 Unpaid caregiving responsibilities also prevent many caregivers from pursuing paid employment.32 As the population ages and informal caregiving increases, states may face rising demand for caregiver support programs and other financial assistance.
State efforts to address the fiscal impacts of an aging population
States are taking an array of actions in response to this demographic shift, including analyzing specific fiscal effects, understanding which services will be most needed, and developing strategies to strengthen support systems for older residents and their caregivers.
Fiscal analyses
Many states are assessing the fiscal impacts of aging populations. (See Table 1 for selected examples.) Some are using long-term budget assessments—an analytical tool for forecasting state revenue and spending— for this purpose.33 For example, Colorado and Pennsylvania evaluated aging populations in their 2023 analyses. Colorado’s report forecasted constrained revenue growth and increased public service demand associated with aging, and Pennsylvania’s estimated rising Medicaid costs.34
Other states, including Hawaii, Montana, Vermont, and Virginia, have conducted detailed analyses of how demographic changes will affect their economies and budgets.35 For example, Montana’s 2026 study examined the effects on tax revenue, demand for services, and the labor market, and predicted slowing income tax revenue growth, increasing healthcare needs, and declining labor force participation, among other findings.36
States also study specific needs of their older populations. New Jersey, South Dakota, and Washington began analyzing long-term care needs after observing sharp demand growth.37 Hawaii assessed housing needs for the elderly.38 And Pennsylvania evaluated its capacity to care for residents with dementia and related disorders in rural areas.39
Table 1
States Use a Range of Approaches to Understand the Fiscal Implications of the Aging Population
Selected examples of state assessments
|
State |
Assessment type |
Covered topics |
|||
|
Revenue changes |
Health expenditures |
Demand for state services |
Other economic impacts |
||
|
Vermont |
Report |
✓ |
✓ |
✓ |
|
|
Montana |
Report |
✓ |
✓ |
✓ |
✓ |
|
Hawaii |
Report, online dashboard |
✓ |
✓ |
✓ |
✓ |
|
Virginia |
Report |
✓ |
✓ |
✓ |
✓ |
|
South Dakota |
Study committee |
✓ |
✓ |
||
|
Washington |
Initiative, report |
✓ |
✓ |
||
|
New Jersey |
Task force |
✓ |
✓ |
||
|
Hawaii |
Report |
✓ |
|||
|
Pennsylvania |
Report |
✓ |
✓ |
||
|
Rhode Island |
Special commission |
✓ |
✓ |
||
|
Minnesota |
Task force |
✓ |
|||
Sources: Dara P. Bourassa and Sara A. Grove, Caring for Pennsylvanians with Dementia and Related Disorders: An Analysis of Needs and Capacity in Rural Areas, 2024 to 2034, 2024. Yang-Seon Kim and Ashley Fossett, The Elderly Population in Hawaii: Current Living Circumstances and Housing Options, 2021. Joyce Manchester, Vermont’s Population Estimates for 2023, 2024. Andrew Mason and Michael Abrigo, Aging and Hawai'i's Generational Economy, 2024. Minnesota Legislative Task Force on Aging, Final Report to the Legislature, 2025. New Jersey Task Force on Long-Term Care Quality and Safety, Final Report of NJ Task Force on LTC Quality & Safety, 2024. Joshua Poulette et al., Montana’s Changing Demographics: 2026 Update, 2026. D.J. Smith et al., Washington State Long-Term Care Legislative Report, 2024. South Dakota Legislative Research Council, Study Committee on Sustainable Models for Long Term Care—2023. State of Rhode Island General Assembly, Creating a Special Legislative Commission to Study and Provide Recommendations Pertaining to Services and Coordination of State Programs Relating to Older Adult Rhode Islanders, 2023. Virginia Joint Legislative Audit and Review Commission, Demographics: Trends, Projections, and Potential Impacts, 2025
Statewide needs assessments
The OAA requires all states and Washington, D.C., to create a State Plan on Aging (SPA) every two to four years to evaluate their need and capacity for supportive services, outline funding formulas, and demonstrate that the state is meeting program spending guidelines.40 The data collection and analysis necessary to create SPAs can also be valuable for evaluating and preparing for the long-term fiscal risks associated with an aging population. In particular, the plans’ statewide needs assessments—which involve listening sessions with and surveys of older adults and other priority populations for public services—are especially valuable for determining which state services and programs may face increased demand as the population ages.
Pew conducted a detailed review of the 51 most recent SPAs, including the needs assessments, to determine which aging-related issues states are preparing for and what opportunities arise for advancing budget sustainability. (See the appendix for the methodology and a list of state plans.) The analysis found that the most frequently identified areas of needs were transportation, caregiver support, housing, healthcare, and aging-in-place and in-home care. (See Figure 2.)
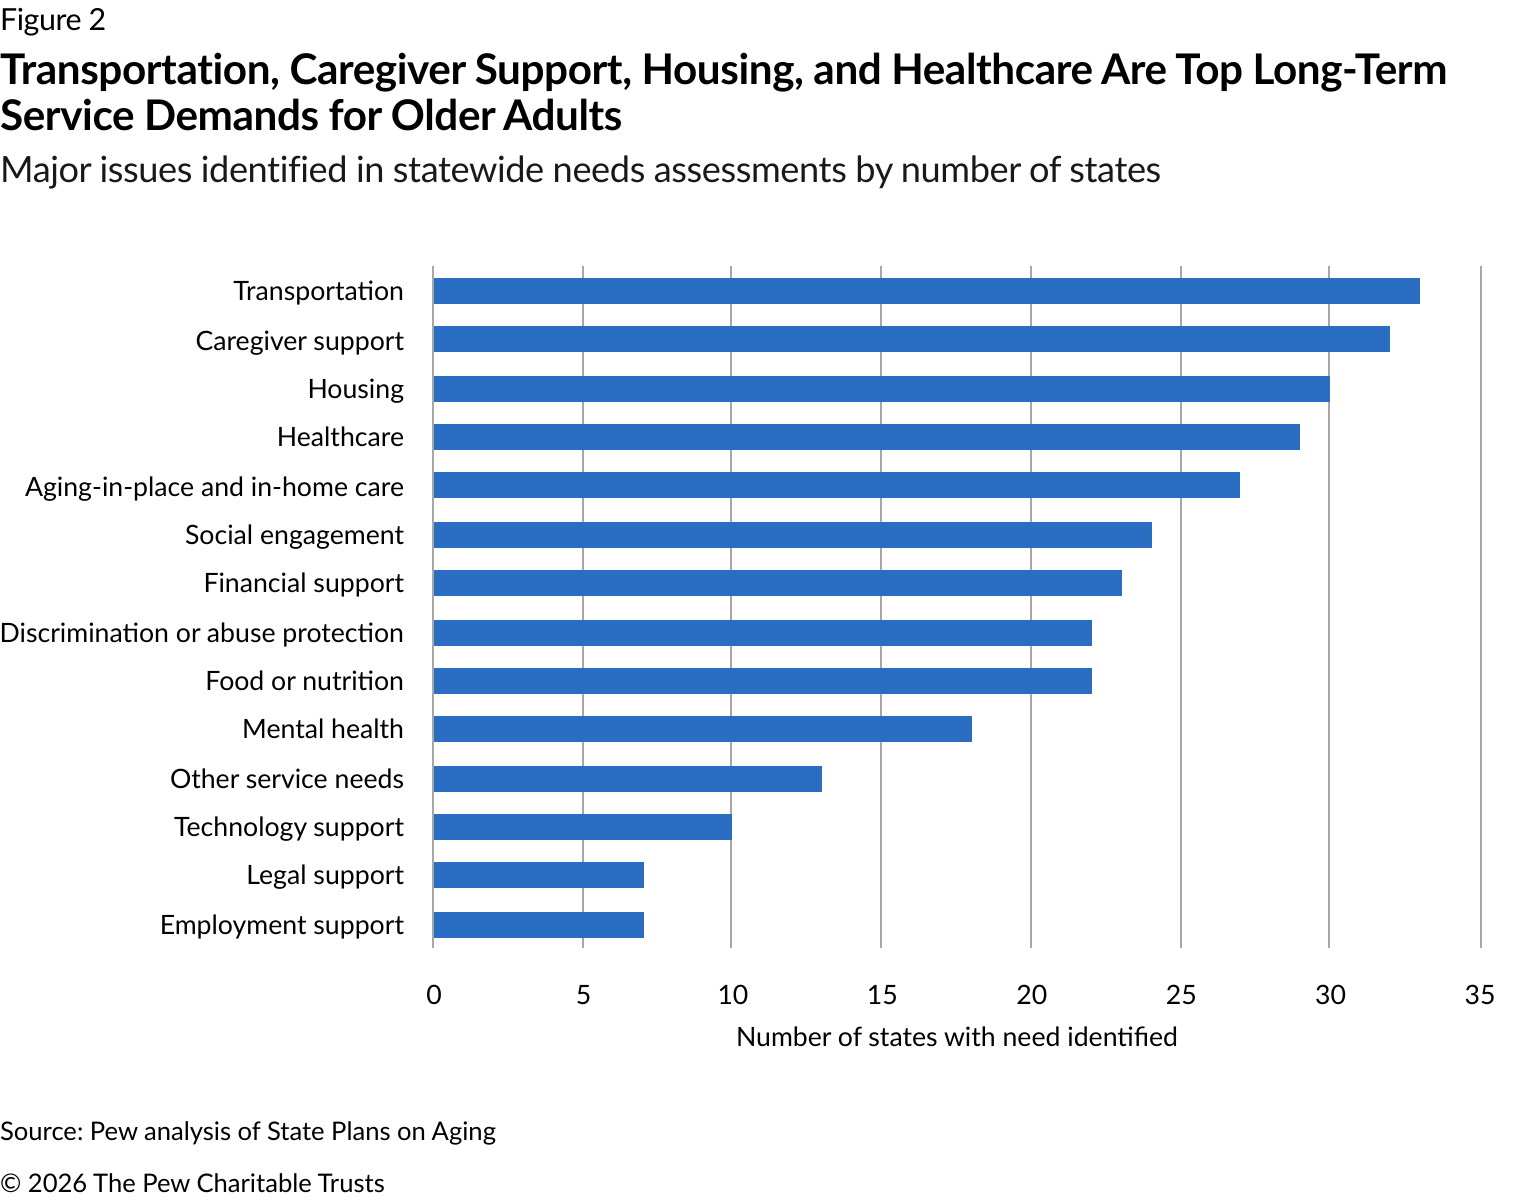
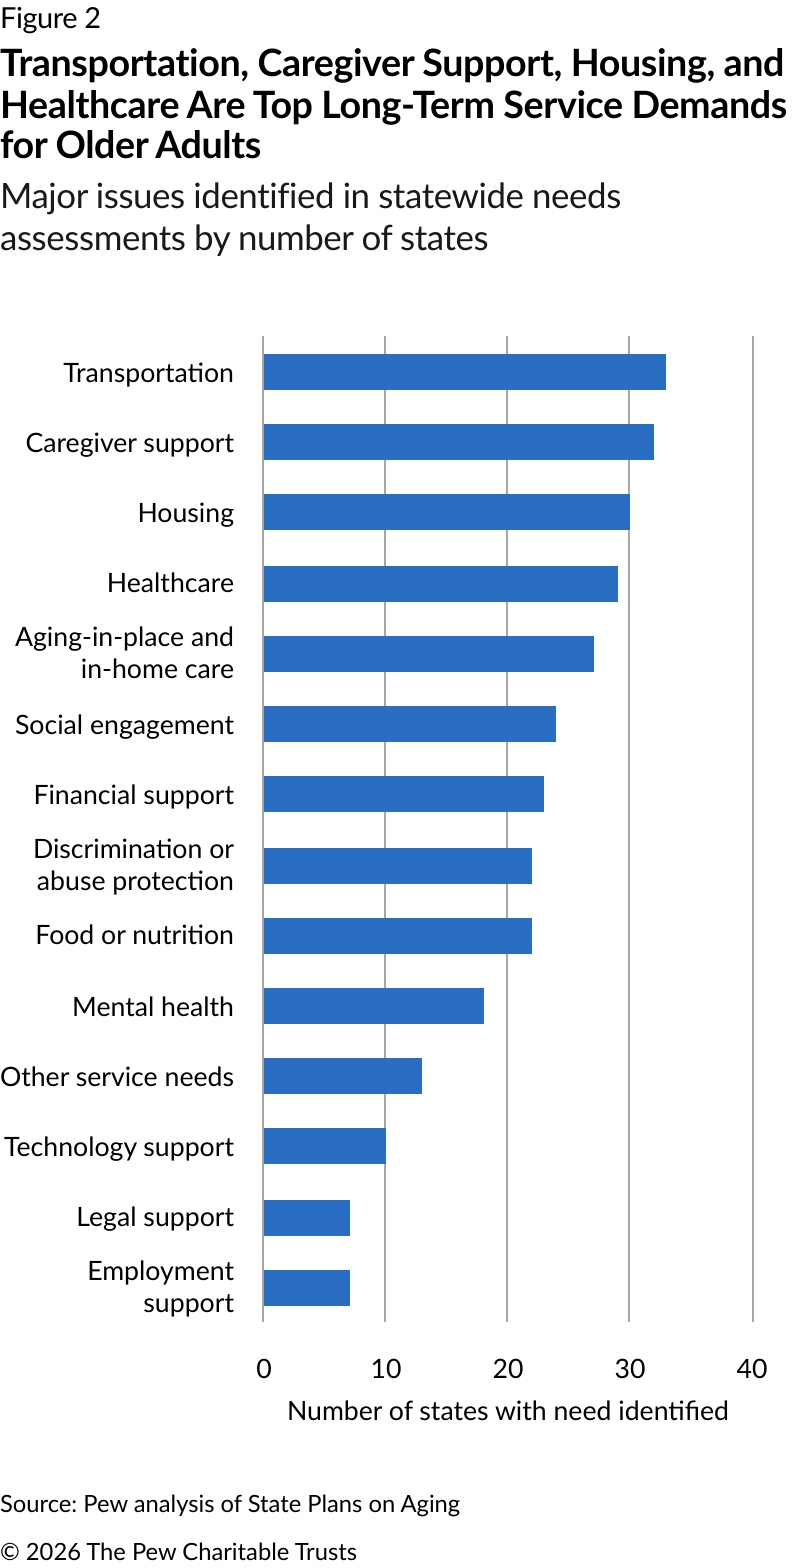
Many of these services fall outside the purview of most states’ departments on aging, so these assessments can help inform long-term planning across budget areas. For example, 33 states identified that transportation was important for their older populations, indicating that more investment in transportation services and infrastructure may be required as this population grows.
The needs assessment process also revealed challenges in delivering services for older adults. For example, 28 states identified connecting older adults with services and 21 cited an inadequate workforce as key barriers to meeting current demand. These issues, which are spotlighted throughout the SPAs, are likely to become more acute as service needs grow.
Other components of SPAs
Along with needs assessments, three other elements of SPAs also support long-term fiscal planning.
Highlighting challenges and setting goals

SPAs outline goals for administering and improving aging services over the next two to four years, and some states use this step to highlight longer-term fiscal hurdles and set targets for meeting increased demand. For example, Iowa’s SPA discusses risks to the state’s network of support for older residents, including state funding trends of decreasing purchasing power and per-person spending.41 Similarly, Utah’s plan flagged rising service demand as the older adult population grows and lives longer, as well as the need to anticipate future funding challenges.42
Analyzing demographic data
SPAs must include a range of information on their older populations, such as the number of older adults within specific vulnerable groups, to support delivery of targeted services.43 But many states also include long-term trends and data that can inform fiscal planning.
For example, Alaska’s SPA projects populations by age, caregiver demand, and prevalence of Alzheimer’s disease through 2050 along with helpful historical data on health and housing needs for older adults.44 And Wyoming’s SPA forecasts increasing costs for long-term care and growing Medicaid enrollment and discusses the financial pressures from more older adults needing assistance.45
Anticipating 10-year population change
The OAA requires that SPAs outline several assurances about administration of programs for aging residents, including assessments of each state’s preparedness for changes in the number of people needing services over the next 10 years.46 Many states use this as an opportunity to detail their plans for monitoring demographic changes, and some go further, highlighting the strategies they use for fiscal planning.
Virginia’s SPA documents trends that are likely to affect future aging services and strategies for addressing emerging fiscal challenges, such as pursuing additional federal grants and statewide partnerships to build capacity and develop more sustainable services.47 Other state plans outline initiatives to enhance service provision, including Massachusetts’s ReiMAgine Aging, which details strategies to secure increased state funding and cross-sector partnerships, and New Jersey’s Age-Friendly State Advisory Council, which created a blueprint for advancing age-friendly practices across sectors and services.48 New Jersey also highlighted its Caregiver Task Force’s 2022 report, which discusses costs of caregiving and needs for future services.49
Cross-sector strategic plans
Many states also incorporate fiscal planning into other strategic efforts focused on the aging population. In addition to creating their SPAs, 14 states have developed Multisector Plans for Aging (MPAs) focused on cross-agency and cross-sector strategies for meeting the needs of older adults.50 (See Figure 3 and Table A.1.) Some states have produced MPAs with support from a learning collaborative led by the Center for Health Care Strategies, while others have been established by executive order or legislation.51
Although MPAs are not primarily focused on financial planning, they promote interagency coordination that states can leverage to understand how resources reach older adults and to plan for long-term fiscal sustainability. Maryland, for example, reports that programs across eight departments were key for serving older adults and describes those programs’ fiscal 2025 funding appropriations.52 The Department of Aging, which authored the MPA, noted that “just as supportive services that impact older adults are distributed across state agencies, so too are funding resources. …This whole-of-government approach to the distribution of aging services promotes sustainable governance and aligns with existing state funding flows.”53
Several other states use these plans to highlight future revenue and spending changes and to create strategies for additional funding to match growing demand. For example, Oklahoma produced a Current State of Aging in Oklahoma report in 2023 as part of a 2024 MPA that detailed demographic data on older adults and discussed related fiscal impacts, such as increased Medicaid and state employee costs.54
Conclusion
Nationwide, states are facing a variety of fiscal impacts from an aging population, and budget decision-makers and state agencies need to assess and plan for those risks. Existing planning processes, particularly development of federally mandated SPAs, provide key opportunities to examine and prepare for the fiscal challenges posed by an older population.
Some states are already assessing and planning for future budget changes and can serve as examples for other states. Understanding how an aging population affects revenue and spending and creating strategies now to address those challenges will help states create more sustainable budgets.
Appendix
Methodology
To analyze the needs assessments conducted for each state’s SPA, Pew researchers reviewed the most recent plan available for each state and D.C. as of November 2025.

For each plan, researchers pulled verbatim statements on key themes or specific results from the section that discussed the needs assessment or from the plan’s appendices. The researchers did not include data from the full needs assessments. Six states were excluded from analysis because they did not provide key results.
Researchers then created an initial list of themes based on those identified by the states and combined those deemed to cover the same topic (e.g., healthcare and physical health) into a single theme (e.g., healthcare). This resulted in 15 initial categories.
Next, the researchers sorted the collected statements from the SPAs into the identified themes. For statements that did not fit an identified theme, researchers created additional categories until all statements were sorted. Any state that had at least one statement in a category was counted as having identified that category as a result of their needs assessment. Two researchers independently coded all statements and discussed any conflicting categorizations for final groupings.
Categories and definitions
Older adult needs:
- Housing: Describes a need for senior housing, affordable housing, or concerns about access to housing, housing services, or home maintenance.
- Transportation: Describes a need for transportation, affordable transportation, or concerns about lack of transportation or transportation options.
- Food or nutrition: Describes a need for food or nutrition, delivered meals, or concerns about food insecurity or lack of access to food programs.
- Healthcare: Describes a need for physical healthcare, health insurance, or concerns about physical health conditions, healthcare affordability, access, or quality.
- Mental health: Describes a need for mental healthcare or concerns about mental health conditions or access to mental health services.
- Discrimination or abuse protection: Describes a need for elder rights or protection against age discrimination or elder abuse, or concerns about safety, abuse, or discrimination.
- Aging-in-place or in-home care: Describes a need for in-home care or related services such as housekeeping, assisted living, a general desire to age in place or specific needs to support aging in place, or concerns about being able to remain at home or in the community.
- Social engagement: Describes a need for social engagement or related activities such as socialization and recreation, or concerns about isolation, loneliness, or access to social opportunities.
- Financial support: Describes a need for financial assistance or other financial programs, or concerns about cost of living, financial difficulties, or general affordability.
- Caregiver support: Describes a need for programs to assist caregivers or related services such as respite care and access to caregiver resources, or concerns about caregiver burden, lack of caregiver support, or caregiver costs.
- Technology support: Describes a need for help with technology or related services, or concerns about understanding technology or accessing information through technology.
- Employment support: Describes a need for employment opportunities for older adults, other employment assistance programs, or concerns about finding or continuing employment.
- Legal support: Describes a need for legal help and related services, or concerns about access to legal aid.
- Other service needs: Describes a need for additional services that do not fall into the above categories.
Service delivery challenges:
- Communicating service information: Concerns about lack of awareness of programs among target populations, difficulty disseminating information and connecting older adults with services, or a need to provide education about services, help people find and apply for services, or improve outreach.
- Equity concerns for services: Concerns about specific populations of older adults accessing services, facing discrimination when receiving services or in healthcare settings, or a need for tailored support, such as translation services.
- Inadequate workforce: Concerns about not having sufficient staff to meet service demand, or a need to increase the workforce or training to provide adequate services.
- Inadequate funding: Concerns about not having enough funding to meet current or future service demand or to provide adequate services.
- Coordination to provide services: Concerns about silos across organizations or a need for strategic partnerships, coordination with Area Agencies on Aging and other providers to meet needs and deliver services efficiently or effectively.
- Other barriers to services: Concerns about challenges such as training needs, general inaccessibility or inflexibility of programs, or systemic or organizational issues, or a need to increase efficiency or take other actions to address barriers not covered in other categories.
State plan documents
Table A.1
State Plans on Aging and Multisector Plans for Aging
|
State |
State plan on aging |
Multisector plan for aging (if available) |
|
Alabama |
||
|
Alaska |
||
|
Arizona |
||
|
Arkansas |
||
|
California |
California Older Americans Act State Plan on Aging 2025-2029 |
|
|
Colorado |
Colorado State Plan on Aging October 1, 2023-September 30, 2027 |
|
|
Connecticut |
Connecticut’s State Plan on Aging October 1, 2024-September 30, 2027 |
|
|
District of Columbia |
||
|
Delaware* |
Delaware State Plan on Aging October 1, 2020 to September 30, 2024 |
|
|
Florida |
||
|
Georgia |
||
|
Hawaii |
||
|
Idaho |
||
|
Illinois |
||
|
Indiana* |
Indiana State Plan on Aging Federal Fiscal Years 2023-2026 |
|
|
Iowa |
||
|
Kansas |
||
|
Kentucky |
||
|
Louisiana |
Louisiana State Plan on Aging For the Period October 1, 2023 through September 30, 2027 |
|
|
Maine |
||
|
Maryland† |
Same as State Plan on Aging |
|
|
Massachusetts |
Massachusetts State Plan on Aging October 1, 2021-September 30, 2025 |
|
|
Michigan |
||
|
Minnesota |
||
|
Mississippi |
||
|
Missouri |
||
|
Montana |
Montana State Plan on Period October 1, 2023 to September 30, 2027 |
|
|
Nebraska |
Nebraska State Plan on Aging October 1, 2023-September 30, 2027 |
|
|
Nevada |
||
|
New Hampshire |
New Hampshire State Plan on Aging October 1, 2023-September 30, 2027 |
|
|
New Jersey |
New Jersey State Plan on Aging October 1, 2025–September 30, 2029 |
|
|
New Mexico |
||
|
New York |
||
|
North Carolina |
All Ages, All Stages NC: A Roadmap for Aging and Living Well |
|
|
North Dakota |
||
|
Ohio |
||
|
Oklahoma |
||
|
Oregon |
Oregon State Plan on Aging October 1,2023-September 30, 2026 |
|
|
Pennsylvania |
||
|
Rhode Island |
||
|
South Carolina |
||
|
South Dakota* |
South Dakota State Plan on Aging October 1, 2021-September 30, 2025 |
|
|
Tennessee |
||
|
Texas* |
Texas State Plan on Aging 2023-2025 |
|
|
Utah* |
Utah State Plan Aging and Adult Services October 1, 2023-September 30, 2027 |
|
|
Vermont |
Age Strong VT: Vermont’s Multisector Plan on Aging 2024-2034 |
|
|
Virginia |
||
|
Washington |
Washington State Plan on Aging October 1, 2023 through September 30, 2027 |
|
|
West Virginia |
Aging Well in West Virginia: State Plan on Aging October 1, 2022-September 30, 2025 |
|
|
Wisconsin* |
Wisconsin State Aging Plan FFY 2023-2025 |
|
|
Wyoming |
* Plan was not available on the state government website as of this brief’s publication.
† Maryland created a combined State Plan on Aging and Multisector Plan for Aging.
Notes: Listed plans are the most recent available online as of November 2025. Website links are active as of this brief’s publication.
Sources: State websites where linked. Others from: Indiana Family and Social Services Administration, Indiana State Plan on Aging: Federal Fiscal Years 2023-2026, 2022. South Dakota Department of Human Services, South Dakota State Plan on Aging, 2021. Texas Health and Human Services, Texas State Plan on Aging 2023-2025, 2022. Utah Department of Health and Human Services, Utah State Plan Aging and Adult Services, 2023. Wisconsin Department of Health Services, Wisconsin State Aging Plan FFY 2023-2025, 2022. Delaware Division of Services for Aging and Adults with Physical Disabilities, Delaware State Plan on Aging October 1, 2020 to September 30, 2024, 2020.
About this brief
This brief was primarily researched and authored by Maureen Hilton of Pew’s managing fiscal risks project. The author thanks Pew colleagues Catherine An, Jennifer V. Doctors, Terri Law, Jasmine Ng, Alan van der Hilst, Caitlyn Wan Smith, and Kate Watkins for communications, editorial, and research support.
Endnotes
- “A Range of Emerging Fiscal Risks Could Disrupt State Budgets,” Peter Muller, The Pew Charitable Trusts, April 17, 2024, https://www.pew.org/en/research-and-analysis/articles/2024/04/17/a-range-of-emerging-fiscal-risks-could-disrupt-state-budgets.
- Zoe Caplan and Megan Rabe, “The Older Population: 2020,” U.S. Census Bureau, 2023, https://www2.census.gov/library/publications/decennial/2020/census-briefs/c2020br-07.pdf.
- “How Record-Low Fertility Rates Foreshadow Budget Strain,” Joanna Biernacka-Lievestro, Alexandre Fall, and Page Forrest, The Pew Charitable Trusts, July 8, 2025, https://www.pew.org/en/research-and-analysis/articles/2025/07/08/how-record-low-fertility-rates-foreshadow-budget-strain?fert_tile_mk=birthb19. Lauren Medina, Shannon Sabo, and Jonathan Vespa, “Living Longer: Historical and Projected Life Expectancy in the United States, 1960 to 2060,” U.S. Census Bureau, 2020, https://www.census.gov/content/dam/Census/library/publications/2020/demo/p25-1145.pdf.
- Shonel Sen, “National 50-State Population Projections: 2030, 2040, 2050,” University of Virginia Weldon Cooper Center for Public Service, July 22, 2024, https://www.coopercenter.org/research/national-50-state-population-projections-2030-2040-2050. U.S. Census Bureau, “Older Adults Outnumber Children in 11 States and Nearly Half of U.S. Counties,” news release, June 26, 2025, https://www.census.gov/newsroom/press-releases/2025/older-adults-outnumber-children.html.
- “National and 50-State Population Projections,” University of Virginia, Weldon Cooper Center for Public Service, 2024, https://www.coopercenter.org/national-population-projections. Zoe Caplan and Megan Rabe, “The Older Population: 2020.”
- “National and 50-State Population Projections,” University of Virginia, Weldon Cooper Center for Public Service.
- Joanna Biernacka-Lievestro and Alexandre Fall, “How Shifting Demographics Are Reshaping State Finances,” Trust Magazine, Summer 2025, https://www.pew.org/en/trust/archive/summer-2025/how-shifting-demographics-are-reshaping-state-finances. “How Record-Low Fertility Rates Foreshadow Budget Strain,” Joanna Biernacka-Lievestro, Alexandre Fall, and Page Forrest, The Pew Charitable Trusts.
- Ann C. Foster, “Consumer Expenditures Vary by Age,” Beyond the Numbers 4, no. 14 (December 2015), https://www.bls.gov/opub/btn/volume-4/pdf/consumer-expenditures-vary-by-age.pdf. Melissa Kollar and Zach Scherer, “Income in the United States: 2024,” U.S. Census Bureau, 2025, https://www2.census.gov/library/publications/2025/demo/p60-286.pdf.
- “How States Raise Their Tax Dollars: FY 2024,” The Pew Charitable Trusts, June 2, 2025, https://www.pew.org/en/research-and-analysis/data-visualizations/2025/06/how-states-raise-their-tax-dollars-fy-2024.
- The Pew Charitable Trusts, “Aging Population Will Have Modest Effects on States’ Revenue,” 2020, https://www.pew.org/en/research-and-analysis/white-papers/2020/01/aging-population-will-have-modest-effects-on-states-revenue. Alison Felix and Kate Watkins, “The Impact of an Aging U.S. Population on State Tax Revenues,” Economic Review, Federal Reserve Bank of Kansas City, fourth quarter (2013): 95-127, https://www.kansascityfed.org/Economic%20Review/documents/933/2013-The%20Impact%20of%20an%20Aging%20U.S.%20Population%20on%20State%20Tax%20Revenues.pdf.
- “How States Raise Their Tax Dollars: FY 2024,” The Pew Charitable Trusts.
- Carl Davis and Eli Byerly-Duke, “State Income Tax Subsidies for Seniors,” Institute on Taxation and Economic Policy, 2023, https://itep.org/state-income-tax-subsidies-for-seniors-2023/.
- Josh Goodman and Carolyn Ellison, “States’ Medicaid Costs Grow Even Before Potential Federal Cuts,” The Pew Charitable Trusts, 2025, https://www.pew.org/en/research-and-analysis/articles/2025/04/25/states-medicaid-costs-grow-even-before-potential-federal-cuts. “Medicaid Spending by Enrollment Group,” KFF, 2023, https://www.kff.org/medicaid/state-indicator/medicaid-spending-by-enrollment-group/?dataView=1¤tTimeframe=0&sortModel=%7B%22colId%22:%22Location%22,%22sort%22:%22asc%22%7D. "Medicaid Enrollees by Enrollment Group,” KFF, 2023, https://www.kff.org/medicaid/state-indicator/distribution-of-medicaid-enrollees-by-enrollment-group/?dataView=1¤tTimeframe=0&sortModel=%7B%22colId%22:%22Location%22,%22sort%22:%22asc%22%7D. National Association of State Budget Officers, “2025 State Expenditure Report,” 2025, 12, https://www.nasbo.org/reports-data/state-expenditure-report.
- Rhiannon Euhus, Alice Burns, and Robin Rudowitz, “5 Key Facts About Medicaid Eligibility for Seniors and People With Disabilities,” KFF, Feb. 7, 2025, https://www.kff.org/medicaid/5-key-facts-about-medicaid-eligibility-for-seniors-and-people-with-disabilities/. Priya Chidambaram and Alice Burns, “10 Things About Long-Term Services and Supports (LTSS),” KFF, July 8, 2024, https://www.kff.org/medicaid/10-things-about-long-term-services-and-supports-ltss/. National Council on Aging, “Get the Facts on Healthy Aging,” May 9, 2025, https://www.ncoa.org/article/get-the-facts-on-healthy-aging/.
- Richard W. Johnson, “What Is the Lifetime Risk of Needing and Receiving Long-Term Services and Supports?,” U.S. Department of Health and Human Services, Office of the Assistant Secretary for Planning and Evaluation, 2019, https://aspe.hhs.gov/reports/what-lifetime-risk-needing-receiving-long-term-services-supports-0.
- Riley Judd and Justin Theal, “New Federal Medicaid Policies Compound State Budget Pressures,” The Pew Charitable Trusts, Jan. 13, 2026, https://www.pew.org/en/research-and-analysis/articles/2026/01/13/new-federal-medicaid-policies-compound-state-budget-pressures.
- “Aging Prison Populations Drive Up Costs,” Matt McKillop and Alex Boucher, The Pew Charitable Trusts, Feb. 20, 2018, https://www.pew.org/en/research-and-analysis/articles/2018/02/20/aging-prison-populations-drive-up-costs. Meghan A. Novisky et al., “Linkages Between Incarceration and Health for Older Adults,” Health & Justice 13, no. 23 (2025), https://doi.org/10.1186/s40352-025-00331-x.
- David Draine et al., “An Increase in Pension Obligations Adds to States’ Unfunded Liabilities,” The Pew Charitable Trusts, July 30, 2025, https://www.pew.org/en/research-and-analysis/articles/2025/07/30/an-increase-in-pension-obligations-adds-to-states-unfunded-liabilities.
- David Draine et al., “An Increase in Pension Obligations Adds to States’ Unfunded Liabilities.”
- Charles Sallee and Ismael Torres, “Balancing Mid- to Long-Term Revenues and Expenditures” (presentation to the Legislative Finance Committee, July 18, 2023), https://www.nmlegis.gov/Handouts/ALFC%20071823%20Item%202%20Balancing%20Mid-%20to%20Long-Term%20Revenues%20and%20Expenditures.pdf.
- “Older Americans Act,” Administration for Community Living, accessed April 7, 2026, https://acl.gov/about-acl/authorizing-statutes/older-americans-act. Meredith Freed, Juliette Cubanski, and Tricia Neuman, “What to Know About the Older Americans Act and the Services It Provides to Older Adults,” KFF, June 3, 2025, https://www.kff.org/medicare/what-to-know-about-the-older-americans-act-and-the-services-it-provides-to-older-adults/.
- Meredith Freed, Juliette Cubanski, and Tricia Neuman, “What to Know About the Older Americans Act and the Services It Provides to Older Adults.”
- Rakesh Kochhar, “The State of the American Middle Class,” Pew Research Center, 2024, https://www.pewresearch.org/race-andethnicity/2024/05/31/the-state-of-the-american-middle-class/.
- “State Automated Retirement Programs Would Reduce Taxpayer Burden From Insufficient Savings,” John Scott and Andrew Blevins, The Pew Charitable Trusts, June 2, 2023, https://www.pew.org/en/research-and-analysis/articles/2023/05/11/state-automated-retirement-programs-would-reduce-taxpayer-burden-from-insufficient-savings.
- Tushar Kansal and Timothy Murphy, “Policies That Allow More Homebuilding Can Help Older Adults,” The Pew Charitable Trusts, Aug. 19, 2025, https://www.pew.org/en/research-and-analysis/articles/2025/08/15/policies-that-allow-more-homebuilding-can-help-older-adults.
- Joint Center for Housing Studies of Harvard University, “Housing America’s Older Adults,” 2023, https://www.jchs.harvard.edu/sites/default/files/reports/files/Harvard_JCHS_Housing_Americas_Older_Adults_2023_Revised_040424.pdf. Lori A. Trawinski, “Mortgage Foreclosures and Older Americans: A Decade After the Great Recession,” in Remaking Retirement: Debt in an Aging Economy, Olivia Mitchell and Annamaria Lusardi, eds. (Oxford University Press, 2020), https://doi.org/10.1093/oso/9780198867524.003.0006.
- Zina Hutton, “The Nation’s Homeless Population Is Aging Dramatically,” Governing, April 10, 2024, https://www.governing.com/urban/the-nations-homeless-population-is-aging-dramatically.
- “State Automated Retirement Programs Would Reduce Taxpayer Burden From Insufficient Savings,” John Scott and Andrew Blevins, The Pew Charitable Trusts.
- Liz Hamel and Alex Montero, “The Affordability of Long-Term Care and Support Services: Findings From a KFF Survey,” KFF, Nov. 14, 2023, https://www.kff.org/health-costs/the-affordability-of-long-term-care-and-support-services/. Robert Shapiro and Luke Stuttgen, “The Peak Boomers Impact Study,” Sonecon, Retirement Income Institute, 2024, https://www.limraconsumer.com/wp-content/uploads/2024/04/Peak-Boomers-Econ-Impact-Study-ALI-RII-Shapiro-Stuttgen-EMBARGOED-Apr-18-2024-041924.pdf.
- AARP and National Alliance for Caregiving, “Caregiving in the US 2025,” 2025, https://www.aarp.org/content/dam/aarp/ppi/topics/ltss/family-caregiving/caregiving-in-us-2025.doi.10.26419-2fppi.00373.001.pdf.
- AARP and National Alliance for Caregiving, “Caregiving in the US 2025.”
- AARP and National Alliance for Caregiving, “Caregiving in the US 2025.” Stipica Mudrazija and María P. Aranda, “Current and Future Replacement and Opportunity Costs of Family Caregiving for Older Americans With and Without Dementia,” Innovation in Aging 9, no. 6 (2025), https://doi.org/10.1093/geroni/igaf049.
- Josh Goodman, Gayathri Venu, and Sariah Toze, “Long-Term Assessments Highlight State Budget Worries,” The Pew Charitable Trusts, 2024, https://www.pew.org/en/research-and-analysis/issue-briefs/2024/09/long-term-assessments-highlight-state-budget-worries.
- Colorado Office of State Planning and Budgeting, “Long-Range Planning Overview and Agency Summaries,” 2023, https://drive.google.com/drive/folders/12GV1BkbNNG3GF9-2vgl2tiJRjHxByZt0. Pennsylvania Independent Fiscal Office, “Pennsylvania Economic and Budget Outlook: Fiscal Years 2023-24 to 2028-29,” 2023, https://www.ifo.state.pa.us/download.cfm?file=Resources/Documents/Five_Year_Outlook_2023.pdf.
- Andrew Mason and Michael Abrigo, “Aging and Hawaii’s Generational Economy,” The Economic Research Organization at the University of Hawaii, 2024, https://dbedt.hawaii.gov/economic/dashboards-main/hawaii-generational-economy-dashboard/. Virginia Joint Legislative Audit and Review Commission, “Demographics: Trends, Projections, and Potential Impacts,” 2025, https://jlarc.virginia.gov/pdfs/reports/Rpt612.pdf. Joshua Poulette et al., “Montana’s Changing Demographics: 2026 Update,” Montana Legislative Fiscal Division, 2026, https://archive.legmt.gov/content/Publications/fiscal/2027-Biennium/Committees/MARA/Demographics-Report-Update-Feb2026.pdf. Joyce Manchester, “Vermont’s Population Estimates for 2023,” Vermont Legislative Joint Fiscal Office, 2024, https://ljfo.vermont.gov/assets/Publications/Issue-Briefs/Issue_Brief_VT_Demographics_in_2023.pdf.
- Joshua Poulette et al., “Montana’s Changing Demographics: 2026 Update.”
- New Jersey Task Force on Long-Term Care Quality and Safety, “Final Report of NJ Task Force on LTC Quality & Safety,” 2024, https://www.nj.gov/health/ltc/documents/nj-task-force-ltc-quality-and-safety-report.pdf. D.J. Smith et al., “Washington State Long-Term Care Legislative Report,” Washington Workforce Training and Education Coordinating Board, 2024, https://wtb.wa.gov/wp-content/uploads/2025/03/LTC-WORKFORCE-REPORT-2024-FINAL.pdf. “Study Committee on Sustainable Models for Long Term Care - 2023,” South Dakota Legislative Research Council, https://sdlegislature.gov/Interim/Committee/469/Detail.
- Yang-Seon Kim and Ashley Fossett, “The Elderly Population in Hawaii: Current Living Circumstances and Housing Options,” Hawaii Research and Economic Analysis Division, 2021, https://files.hawaii.gov/dbedt/economic/reports/Elderly_Population_in_Hawaii-Housing_Dec2021.pdf.
- Dara P. Bourassa and Sara A. Grove, “Caring for Pennsylvanians With Dementia and Related Disorders: An Analysis of Needs and Capacity in Rural Areas, 2024 to 2034,” Center for Rural Pennsylvania, 2024, https://www.rural.pa.gov/download.cfm?file=Resources/reports/assets/267/Caring%20for%20Pennsylvanians%20with%20Dementia%20Report%20Web.pdf.
- 116th Cong., Older Americans Act, PL 89-73, as Amended Through PL 116-131 (2020), https://acl.gov/sites/default/files/about-acl/2020-04/Older%20Americans%20Act%20Of%201965%20as%20amended%20by%20Public%20Law%20116-131%20on%203-25-2020.pdf. Kirsten J. Colello and Angela Napili, “Older Americans Act: Overview and Funding,” Congressional Research Service, 2024, https://www.congress.gov/crs-product/R43414.
- Iowa Department of Health and Human Services, “Iowa State Plan on Aging: Federal Fiscal Years 2026-2029,” 2025, 7, https://hhs.iowa.gov/media/17316/download?inline.
- Utah Department of Health and Human Services, “Utah State Plan Aging and Adult Services,” 2023, 24.
- 116th Cong., Older Americans Act.
- Alaska Department of Health, “The Alaska State Plan for Senior Services FFY 2024-FFY 2027,” 2023, 6, https://www.advancingstates.org/sites/default/files/u34287/AK_State_Plan_for_Senior_Services_FFY_2024_FFY_2027.pdf.
- Wyoming Department of Health, “Wyoming State Plan on Aging 2021-2025,” 2021, 10, https://health.wyo.gov/wp-content/uploads/2021/09/2021-2025-State-Plan-on-Aging.pdf.
- 116th Cong., Older Americans Act.
- Virginia Department for Aging and Rehabilitative Services, “Virginia State Plan for Aging Services—Amended for October 1, 2025,” 2025, Attachment B, 11, https://dars.virginia.gov/about/divisions/aging-services/state-plans/.
- Massachusetts Executive Office of Aging & Independence, “ReiMAgine Aging 2030: The Massachusetts Plan,” 2025, https://www.mass.gov/info-details/reimagine-aging-2030-the-massachusetts-plan. New Jersey Department of Human Services, “New Jersey Age-Friendly Blueprint,” 2024, https://www.nj.gov/humanservices/news/reports/AF%20Blueprint_v5.pdf.
- New Jersey Caregiver Task Force, “New Jersey Caregiver Task Force Report,” 2022, https://www.nj.gov/humanservices/doas/documents/Final_Nov%20Caregiver%20TF%20Report_11.16_v2.pdf.
- “With an MPA in Place, States Can Prepare for an Aging America,” West Health, accessed April 8, 2026, https://multisectorplanforaging.org/multisector-plans-for-aging.
- “Multisector Plan for Aging Learning Collaborative,” Center for Health Care Strategies, accessed April 8, 2026, https://www.chcs.org/project/multisector-plan-for-aging-learning-collaborative/.
- Maryland Department of Aging, “Paving the Way for a Longevity Ready Maryland,” 2025, 11, https://lrm.maryland.gov/.
- Maryland Department of Aging, “Paving the Way for a Longevity Ready Maryland.”
- Oklahoma Human Services, “The Current State of Aging in Oklahoma,” 2023, 22, https://oklahoma.gov/content/dam/ok/en/okdhs/documents/okdhs-pdf-library/community-living-aging-and-protective-services/MPA%20CSR%20Current%20State%20Report%20FULL.pdf.
People


