State Tax Revenue Stabilizes, but Budget Pressures Persist
After five years of widespread volatility, state tax revenue showed signs of stabilization in 2025. Even so, total collections remained below their long-term trends nationally and in most states for the second consecutive year, meaning states generally have fewer resources available for tax cuts, public services, bolstering reserves, or other priorities.
The latest data suggests that revenue has settled into a post-COVID-19 pandemic pattern that is steadier than the sharp declines that followed the pandemic-era revenue wave, but still weaker than its long-term trajectory.
Nationally, total state tax revenue was 2.2% below its 15-year trend in the fourth quarter of 2025, after adjusting for inflation and smoothing for seasonal fluctuations. This marks a major shift from just a few years ago, when collections peaked at 15% above trend in 2022.
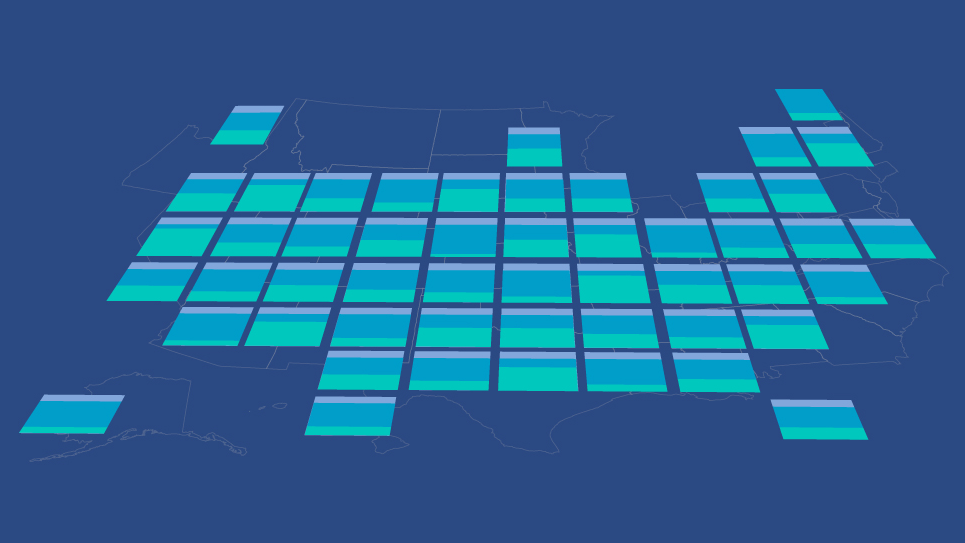
Thirty-nine states were also shy of their long-term trajectories.
This widespread and sustained underperformance was driven in part by sluggish growth in recent quarters. Inflation-adjusted revenue declined in half of states between July 1 and Dec. 31, 2025—the first half of fiscal year 2026 for most states—compared with the same period the previous year. By late 2025, revenue growth had stabilized, but most states had not regained the ground they lost in preceding years when temporary federal aid for the pandemic and one-time economic effects faded and many states implemented tax cuts.
Preliminary fiscal 2026 data adds another layer to the story. Through May, data from the Urban Institute shows that monthly state general fund tax collections were on pace to outperform enacted budget assumptions in most states. Nationally, collections grew compared with the same period a year earlier, but only modestly after accounting for inflation.
The national gains also partly reflect California’s outsize role in 50-state trends. The state’s collections showed strong growth, benefiting from rising personal income tax revenue tied to stock market gains and strength in the technology sector, including the recent boom in artificial intelligence. Similar forces also helped improve revenue outlooks in some other states toward the end of the fiscal year, especially where capital gains, bonuses, and high incomes tend to make up a larger-than-average share of income tax collections.
Together, the quarterly data through December 2025 and the preliminary monthly general fund data show a tax revenue landscape that is better than many states budgeted for but weaker than their 15-year trajectories suggest. That distinction matters: Exceeding a cautious forecast can help states manage the current budget year, but it does not necessarily mean recurring revenue is enough to support ongoing spending commitments.
Looking ahead, policymakers will continue to face pervasive budget pressures. Persistent revenue stagnation, which is already complicating budgeting, combined with spending commitments made during the pandemic-era revenue wave—such as broad-based tax cuts and across-the-board wage increases for public employees—now pose significant challenges. As a result, many states are reporting that their budgets are structurally imbalanced, with insufficient recurring revenue to support ongoing expenditures.
At the same time, federal policy actions are adding a layer of risk. The passage in July 2025 of the budget reconciliation measure, H.R. 1, established a new fiscal dynamic that state policymakers are still working to address. The law’s tax code changes—such as to personal deductions and business spending provisions—are presenting immediate challenges in many states and, in some cases, creating or exacerbating projected budget gaps. And other recent actions such as changes to federal funding for Medicaid and the federal Supplemental Nutrition Assistance Program, higher tariffs, and shifts in immigration policy could further disrupt state budgets.
Revenue performance continues to vary widely across states, reflecting differences in tax structures, policy choices, and economic composition. In states that rely more heavily on personal income taxes, collections are more closely tied to labor market conditions and stock market performance, while in those more dependent on sales taxes, revenue is more sensitive to shifts in consumer spending. Policy actions and tax changes also continue to add volatility.
State highlights
A comparison of tax revenue in the fourth quarter of 2025 versus each state’s 15-year trend levels, adjusted for inflation and seasonality, shows that:
- The states with the weakest tax revenue compared with their long-term trends were Iowa (16.5% below trend), New Hampshire (9.8% below), and Louisiana (9.7% below). Iowa, New Hampshire, and Louisiana all recently implemented significant tax cuts, which lowered collections.
- 11 states bucked the national trend and remained above their 15-year trajectories: Alaska (170.4% above trend), Oregon (7.2%), Vermont (3.7%), Wyoming (3.5%), Nevada (2%), New York (1.9%), New Mexico (1.6%), Rhode Island (1.5%), Illinois (1.2%), Ohio (1%), and North Dakota (0.5%). Alaska, New Mexico, North Dakota, and Wyoming benefited from a boost in severance tax revenue related to elevated energy prices and production, though their collections have generally declined over the past two years. These estimates are based on data through the fourth quarter of 2025 and do not reflect energy price fluctuations that began in early 2026.
- The number of states performing below their long-term revenue trends fell from 40 in the second quarter of 2025 to 39 in the fourth quarter of that year, with Illinois and Ohio climbing back above their long-term trajectories, while South Carolina fell back below trend.
Trends by tax type
Nationally, about 75% of total state tax revenue comes via levies on personal income, general sales of goods and services, and corporate income, all three of which underperformed their 15-year growth trends during the fourth quarter of 2025.
- For the 44 states that impose a personal income tax, those collections were 4.8%, or $7.3 billion, below their 15-year trend as of the fourth quarter of 2025, after adjusting for inflation and seasonality.
- Of the 41 states that collect broad-based personal income taxes:
- 30 had collections that underperformed long-term trends, ranging from 25.6% below trend in Iowa and 19.9% below in Hawaii to less than 2% below in Alabama, Indiana, New Jersey, Pennsylvania, and Wisconsin.
- Personal income tax revenue outperformed its long-term trend in Oregon (6%), Oklahoma (4.9%), North Dakota (4.8%), Delaware (4.2%), Ohio (3.6%), Connecticut (2.9%), Massachusetts (2.6%), Illinois (2%), Virginia (1.7%), Vermont (1.4%), and Maine (1.1%).
- New Hampshire previously taxed some specific personal dividend and interest income. The state repealed that tax effective Jan. 1, 2025, but still reports some lingering collections. Tennessee, which had a tax similar to New Hampshire’s that was fully phased out in 2021, also continues to report some residual collections. Washington adopted its own limited tax on capital gains that became effective Jan. 1, 2022. Although the levy is not technically an income tax, the revenue is reported as such to the U.S. Census Bureau and so is included in Pew’s counts.
- Of the 41 states that collect broad-based personal income taxes:
- Corporate income tax collections were 2.9%, or $1.1 billion, below their 15-year trend as of the fourth quarter of 2025. Historically, corporate income taxes are one of the most volatile major state tax types. Of the 46 states that impose this tax type:
- 33 had collections that underperformed long-term trends, ranging from 43.3% below trend in Louisiana and 40% below in Iowa to less than 1% below in Kentucky.
- 13 had collections that outperformed its long-term trend, ranging from 166.5% above trend in Alaska and 100.1% above in Ohio to 0.1% above in Florida and 0.2% in Hawaii.
- The values for Ohio’s corporate income tax over the 15-year period ending in the fourth quarter of 2023 include revenue from the state’s corporation franchise tax, which was fully phased out in 2016, as well as relatively small collections from the state’s pass-through entity and trust withholding tax, which was also phased out in 2016 but still applies to equity investors who are themselves pass-through entities. South Dakota does not impose a corporate income tax; revenue reported to the U.S. Census Bureau under this category reflects collections from the state’s bank franchise tax.
- General sales tax collections were 2.5%, or $3.2 billion, below their 15-year trend as of the fourth quarter of 2025. Of the 45 states that impose this tax type:
- General sales tax revenue underperformed its long-term trend in 34 states, ranging from 11.6% below trend in Oklahoma and 8.6% below in Kansas to less than 1% below in Arizona, Illinois, Maryland, Mississippi, Nevada, and North Dakota.
- Sales tax revenue outperformed its long-term trends in Louisiana (5%), New Mexico (3.8%), Nebraska (3.6%), South Carolina (1.8%), Wyoming (1.7%), West Virginia (1.5%), Hawaii (1.3%), New York (1.1%), Texas (0.4%), Missouri (0.4%), and Georgia, which was less than one-tenth of a percent above trend.
Recent developments
In the fourth quarter of 2025, total inflation-adjusted state tax revenue rose 4.4% compared with the same quarter a year earlier, and state-level changes varied widely. Oregon recorded the largest year-over-year increase, at 21.8%, followed by California (15.1%) and Tennessee (15%). At the other end of the spectrum, North Dakota’s tax revenue fell 12.4%, Alaska’s declined 10.1%, and Wyoming’s dropped 6.7%. Overall, the fourth-quarter gains helped narrow, though not close, the gap between current collections and long-term trends.
The latest monthly general fund data for fiscal 2026 reinforces this mixed picture. Through May, nominal fiscal-year-to-date collections were up 6% nationally versus the same period a year earlier, and 42 states reported gains. After adjusting for inflation, collections were up 2.9% nationally, 32 states recorded gains, and the median increase was 0.9%.
Collections also were generally running ahead of enacted budget assumptions. Among states with comparable forecast data gathered by the National Association of State Budget Officers, 40 were collecting more than their enacted fiscal 2026 growth rates anticipated, and eight were below. Nationally, nominal fiscal-year-to-date collections were 5.3 percentage points above the enacted fiscal 2026 growth rate.
Together, fourth-quarter 2025 revenue compared with the long-term trend along with fiscal-year data through May 2026 points to several distinct revenue conditions across states:
- Based on these measures, the states with the strongest revenue positions were those that were above their long-term trends and running ahead of enacted forecasts. Among those, Nevada stands out: Its total tax revenue was 2% above the long-term trend; inflation-adjusted fiscal-year-to-date general fund collections were up 6.7%; and nominal collections were 9.4 percentage points ahead of the state’s enacted fiscal 2026 forecast.
- New Mexico was the only state that remained above trend while also running behind its forecast and its previous year’s collections levels.
- Most states were below long-term trends but ahead of enacted forecasts. These states may have some near-term budget breathing room, but their collections have not fully recovered relative to their longer-term revenue paths. Washington illustrates this pattern: It was 5.5% below trend, but its inflation-adjusted fiscal-year-to-date collections were up 2.8%, and its nominal collections were 3.8 percentage points ahead of forecast.
- Seven states—Colorado, Idaho, Iowa, Louisiana, Missouri, Nebraska, and Texas—were below long-term trends and running behind enacted forecasts, signaling that their current-year performance and long-term positions have weakened. Nebraska and Texas were the only states in this group where inflation-adjusted fiscal-year-to-date collections increased despite remaining below trend and behind forecast.
Such comparisons are important for budget planning. States running ahead of forecast may be better positioned than expected to manage the current budget year, especially if their enacted assumptions were cautious. But outperforming a forecast does not mean that revenue is on a sustainable long-term path.
Projected budget deficits are becoming more common than they were just a few years ago, especially when revenue and spending are forecast beyond the current fiscal year. Some states are already turning to cost-saving measures, including targeted spending cuts, hiring freezes, and drawdowns from reserves to close shortfalls.
One key question facing states is whether they can still afford the long-term budgetary commitments they made during the pandemic-era revenue surge—such as tax relief and pay raises for public employees. For instance, according to NASBO, fiscal 2023 and 2024 saw the largest net state tax cuts ever recorded (by dollar amount), ranging from targeted, temporary rebates to permanent, broad-based rate reductions. At the same time, many states approved across-the-board wage increases for public employees.
Two fiscal management tools can help states better evaluate their exposure to federal policy shifts and the long-term affordability of pandemic-era budget commitments:
- Long-term budget assessments help policymakers identify challenges that can build over time.
- Budget stress tests help leaders assess how different economic scenarios would affect their budgets and how much to set aside in their rainy day funds.
Why Pew assesses state tax revenue trends
Tax revenue serves as the primary source of funding for most states. By tracking tax revenue trends, Pew provides policymakers and analysts with insights into the long-term financial health of their states, because revenue directly affects states’ capacity to provide residents with core public services—such as education, healthcare, and infrastructure—and to fund other policy priorities.
Understanding long-term trends can also help state leaders judge whether their budgets are on a sustainable path and can support better-informed fiscal planning and policy formulation. Policymakers should assess the factors behind tax revenue deviations from long-term trends—overall and for particular revenue streams—to understand whether revenue variations stem from policy changes, external factors beyond their immediate control—such as demographic shifts—or both. And to help ensure their state’s long-term fiscal sustainability, lawmakers should also examine whether these deviations are the result of one-time or temporary factors or whether they represent a more structural change that is likely to persist without policy action.
Justin Theal is a senior officer and Alexandre Fall is a principal associate with The Pew Charitable Trusts’ Fiscal 50 project.