Philadelphia’s Public Workforce Returns to Pre-Pandemic Levels
The number of unfilled budgeted positions increases even as the city workforce rebounds

Editor's note: This brief was updated on Sept. 9, 2026, to clarify the decrease in Fort Worth's per capita workforce and the groupings for Philadelphia's departments.
Overview
Municipal workforces are crucial to shaping how local governments interact with their constituents. People in these roles provide key services for residents, including emergency, sanitation, water, and legal services. Having a fully outfitted public sector workforce helps cities thrive by ensuring that infrastructure is maintained, that citizens can interact with different branches of government as needed, and that people’s socioeconomic well-being is supported. The COVID-19 pandemic prompted many workers throughout the country to leave their jobs, straining public and municipal services.1 Philadelphia and other major U.S. cities had difficulty filling the resulting staffing gaps—at least initially.

Given the adverse socioeconomic impacts and other economic changes since the pandemic began, The Pew Charitable Trusts examined the state of the municipal workforce in 10 of the 15 most populous U.S. cities—including Philadelphia—using comparable fiscal year 2025 data to understand how municipal workforces evolved during this period. Examining the trends throughout this six-year span (from fiscal 2019 to fiscal 2025) made it possible to trace the impacts of the COVID-19 pandemic as a major economic disruption by comparing trends before and after it began, and to observe the recovery in major U.S. cities since then.
This research found that Philadelphia’s municipal workforce is now roughly the same size as it was before the pandemic, after having shrunk by 6% between fiscal years 2019 and 2022.
The research on Philadelphia and nine comparison cities—Austin, Texas; Charlotte, North Carolina; Columbus, Ohio; Dallas; Fort Worth, Texas; Los Angeles; New York; Phoenix; and San Diego—also showed that:
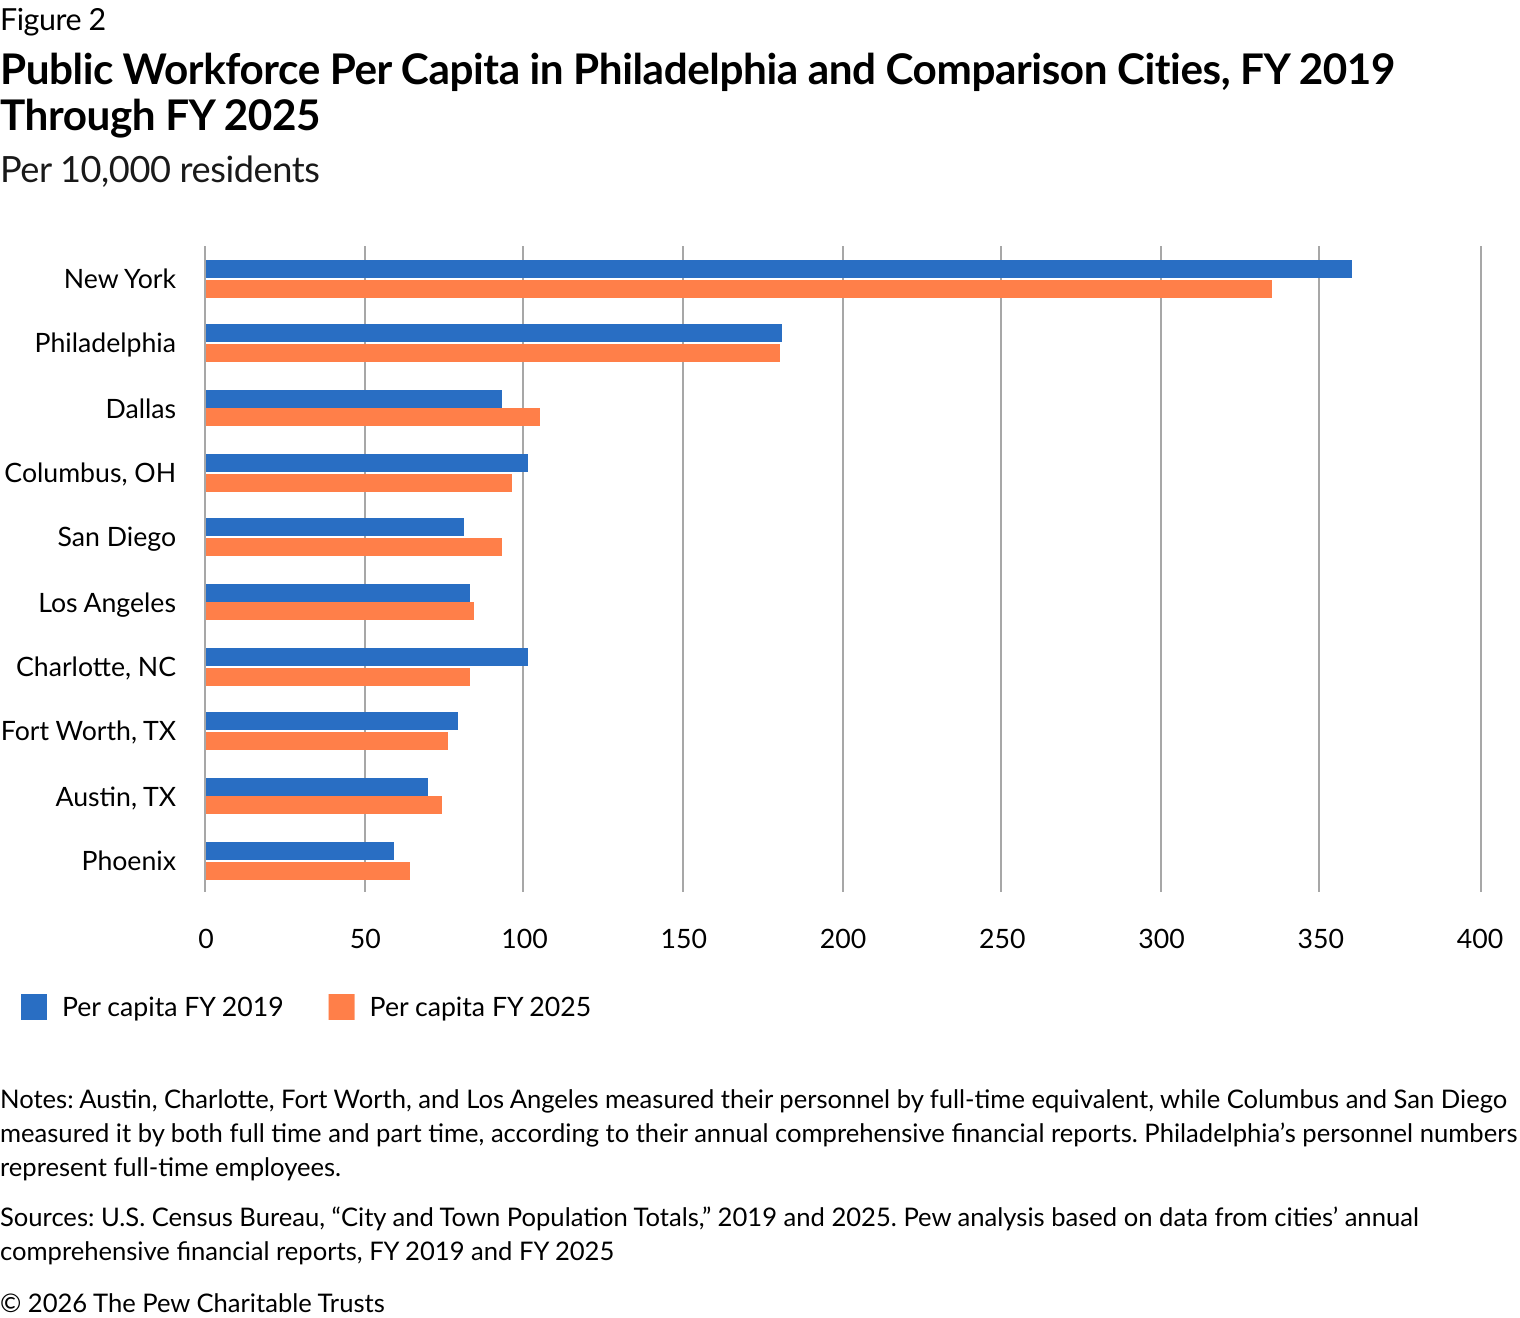
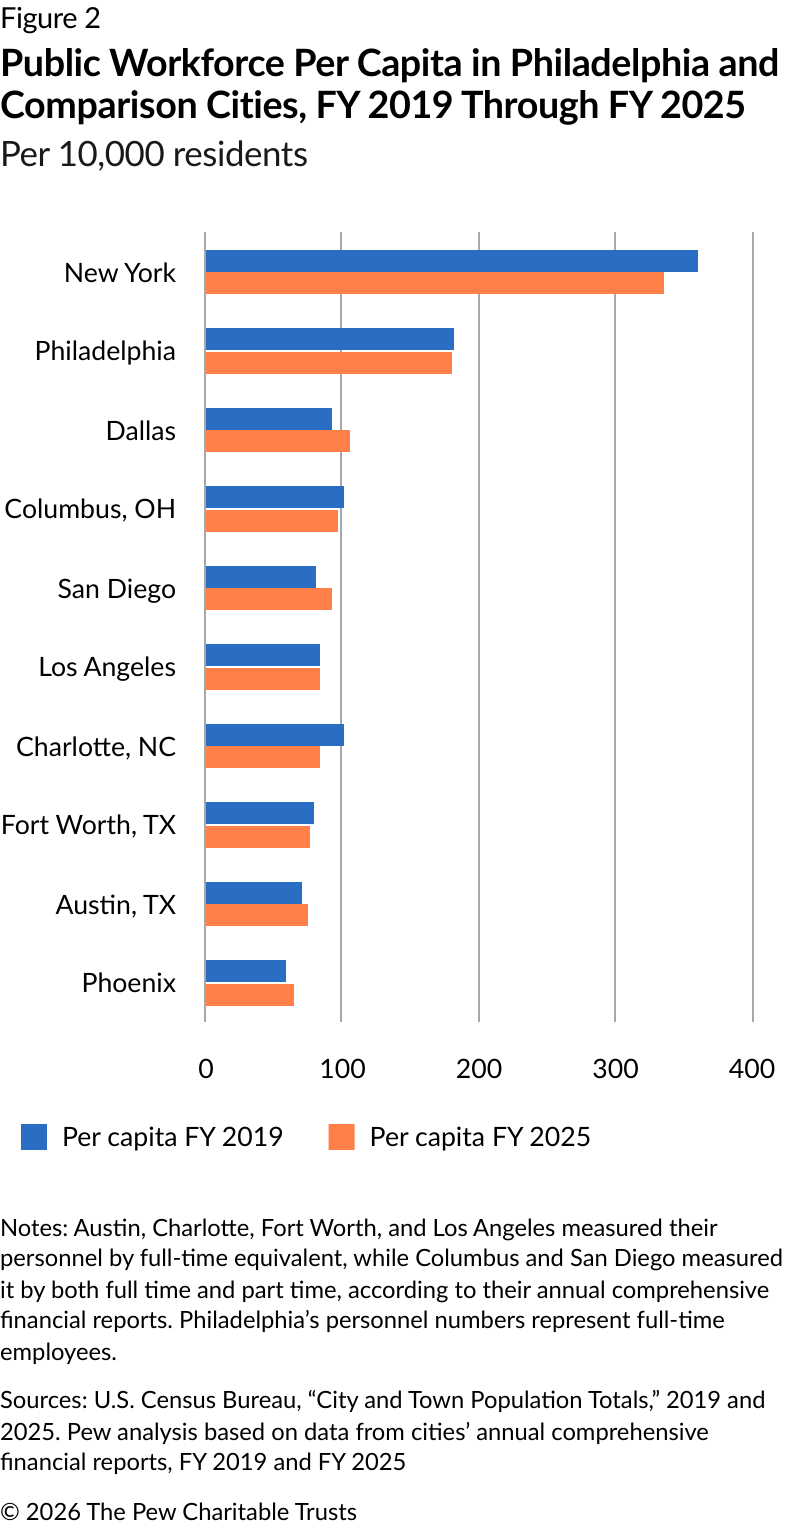
- Half of all comparison cities—Charlotte, Columbus, Fort Worth, Philadelphia, and New York—experienced a decline in their public workforce per capita (per 10,000 residents) because of a decrease in city government personnel, with a concurrent increase in cities’ overall population. Fort Worth and Philadelphia were the exception; Fort Worth’s per capita decreased because population growth exceeded the increase in public personnel, and Philadelphia’s dropped because both population and personnel decreased by 1%.
- Despite the overall rebound in Philadelphia, the size of the city’s workforce has decreased substantially in departments such as the Police and Prisons departments and the Philadelphia Courts. This is also the case in New York and, to a lesser extent, in several other cities.
- In Philadelphia’s city government, the overall vacancy rate has increased since before the pandemic. Staffing declines in public safety and the addition of 3,762 budgeted (though not necessarily filled) positions over the past six years are the major reasons for the increase in vacancies. At the same time, staffing levels have risen in the Streets Department, the Managing Director’s Office, and the Water Department.
- Although the number of people working for the city is about the same as it was before the pandemic, spending on employee overtime has increased by 78%, from around $177 million in fiscal 2019 to $315 million by fiscal 2025. A Pennsylvania Intergovernmental Cooperation Authority (PICA) report found that the city’s need for public safety services and increased overall vacancy rates drove the increased spending.
In Philadelphia and elsewhere, municipal workforces have rebounded since the pandemic
While the size of Philadelphia’s municipal workforce decreased in the months and years following the onset of the COVID-19 pandemic, the city’s workforce is now once again about the same size as it was at the end of fiscal 2019. On June 30, 2019—the end of the last full fiscal year before the pandemic—the city had 28,084 people on payroll. On the same date in 2025, the total was 28,253.
That does not mean every department has roughly the same number of employees now as it did then. The Managing Director’s Office, as well as the Streets and Water departments, have more employees than they did before the pandemic. Yet the Prisons, Police, and Human Services departments and the Philadelphia Courts (First Judicial District) have fewer personnel; they are the only four of the city’s 10 largest departments that lost employees. The Police Department recorded the biggest decline in filled positions, from 7,402 to 6,309, a decrease of 1,093. Meanwhile, the Streets Department increased by 590 filled positions, from 1,736 to 2,326. (See Table 1.)
Table 1
Staffing Trends in 10 Largest Philadelphia Departments
Filled positions, FY 2019 through FY 2025
|
Department |
FY 2019 |
FY 2020 |
FY 2021 |
FY 2022 |
FY 2023 |
FY 2024 |
FY 2025 |
Personnel change |
Percentage change |
|
Philadelphia Police Department |
7,402 |
7,339 |
7,019 |
6,792 |
6,475 |
6,313 |
6,309 |
(1,093) |
-15% |
|
Philadelphia Fire Department |
2,737 |
2,824 |
2,755 |
2,745 |
2,871 |
2,887 |
2,920 |
183 |
7% |
|
Streets Department |
1,736 |
1,926 |
1,941 |
2,073 |
2,070 |
2,152 |
2,326 |
590 |
34% |
|
Philadelphia Water Department |
1,891 |
1,989 |
1,922 |
1,924 |
1,991 |
2,022 |
2,118 |
227 |
12% |
|
First Judicial District |
2,349 |
2,323 |
2,225 |
2,094 |
2,089 |
2,089 |
2,111 |
(238) |
-10% |
|
Prisons |
2,130 |
1,975 |
1,620 |
1,393 |
1,312 |
1,266 |
1,549 |
(581) |
-27% |
|
Department of Human Services |
1,535 |
1,518 |
1,464 |
1,481 |
1,428 |
1,517 |
1,497 |
(38) |
-2% |
|
Department of Public Health |
901 |
885 |
898 |
860 |
858 |
914 |
924 |
23 |
3% |
|
Free Library of Philadelphia |
661 |
687 |
645 |
630 |
770 |
821 |
868 |
207 |
31% |
|
Parks and Recreation |
674 |
672 |
670 |
640 |
703 |
698 |
732 |
58 |
9% |
Notes: This table represents the month-end actual for the fourth quarter of each fiscal year. In FY 2024, the Streets Department split into two departments: the Streets Department and the Sanitation Department. The staffing distinction between the Streets and Sanitation departments was not reported in the FY 2025 Quarterly City Managers Report for the period ending June 30, 2025.
Source: City of Philadelphia, Quarterly City Managers Report, Office of the Director of Finance, FY 2019 through FY 2025, for the period ending June 30 each year
The Streets Department’s increase corresponded with a significant jump in the number of budgeted positions, from 1,912 to 2,705 positions—an increase of 793. The Police Department saw a slight increase in the number of budgeted positions, but its staffing levels continued to decline over the years.
Those in public safety saw the number of budgeted positions stay relatively flat while their staffing levels declined. The city has reported difficulties filling positions for these departments.2

Pew’s analysis of the city’s data shows that within the six-year period of fiscal 2019 through fiscal 2025, the Police Department accounted for 21% of all departures, the most by department. In the same six-year period, 15% of all hires were within the Streets Department, the most of any department.
Declines in public safety staffing are not unique to Philadelphia. A 2025 survey of state and local government workforces reported that public safety roles were among the hardest to fill; 66% reported difficulty recruiting police and 57% cited corrections/jail.3
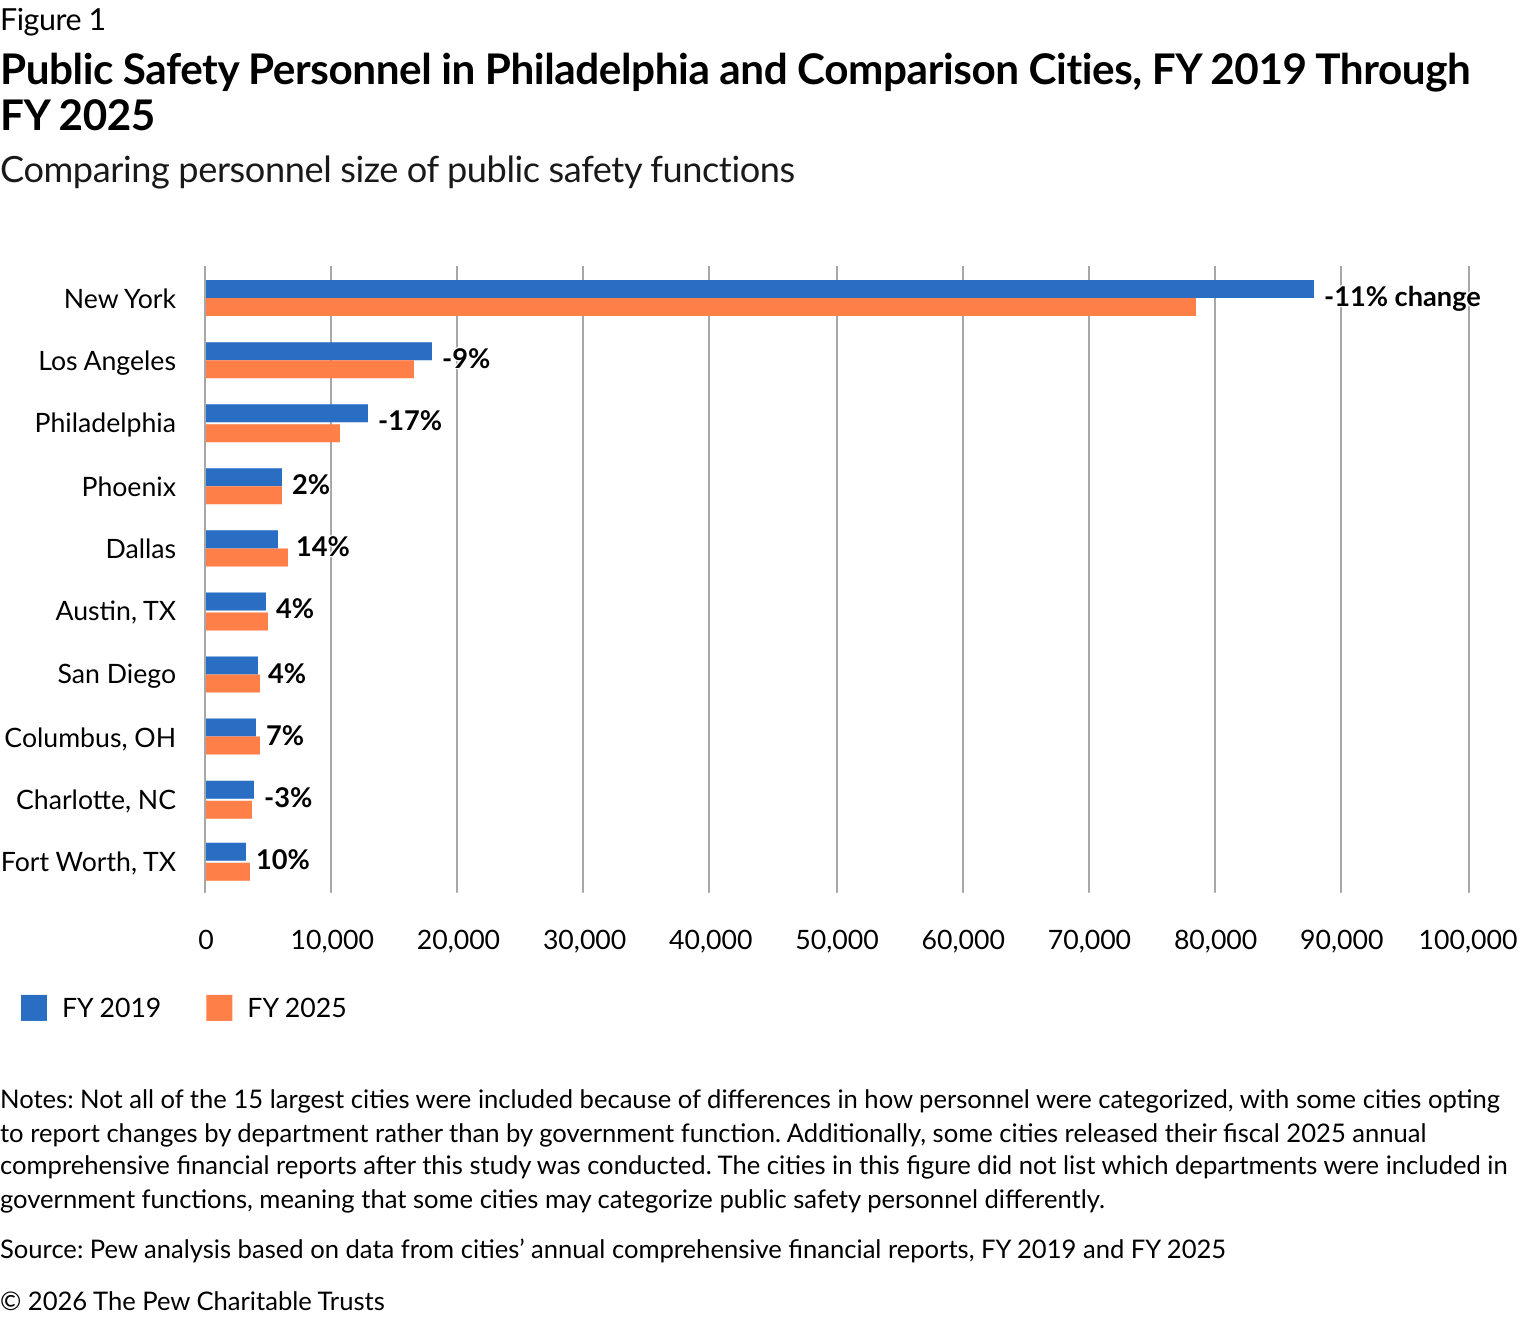
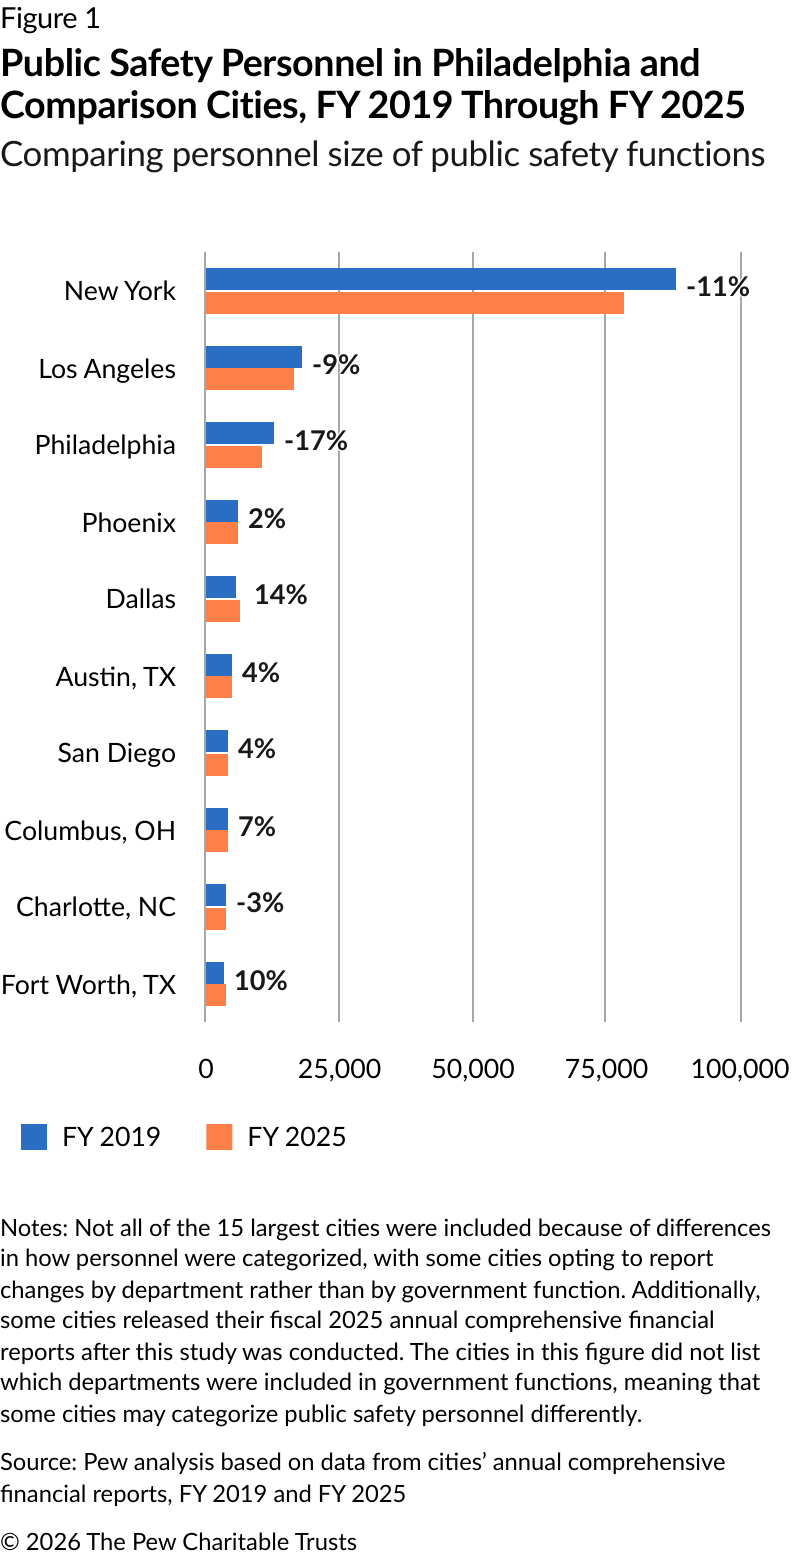
Comparisons of government functions (departments categorized by their main operation) using cities’ annual comprehensive financial reports show that public safety staffing declined in some of the most populous U.S. cities—Los Angeles, New York, and Charlotte—from fiscal 2019 through fiscal 2025. Yet Philadelphia saw the largest decline, at 17%. (See Figure 1.)
Half of all comparison cities—Charlotte, Columbus, Fort Worth, Philadelphia, and New York—saw a decrease in their public workforce per capita (per 10,000 residents). Most of these cities saw a decrease because of a drop in the number of public employees and an increase in population. However, Fort Worth saw a decline because of its population increasing at a faster rate than its government personnel. Meanwhile, Philadelphia’s decrease was due to a drop in both population and public personnel. (See Figure 2.)
As Philadelphia increases its total number of budgeted positions, vacancies are prevalent
Philadelphia city government has far more job vacancies now than it did before the pandemic.
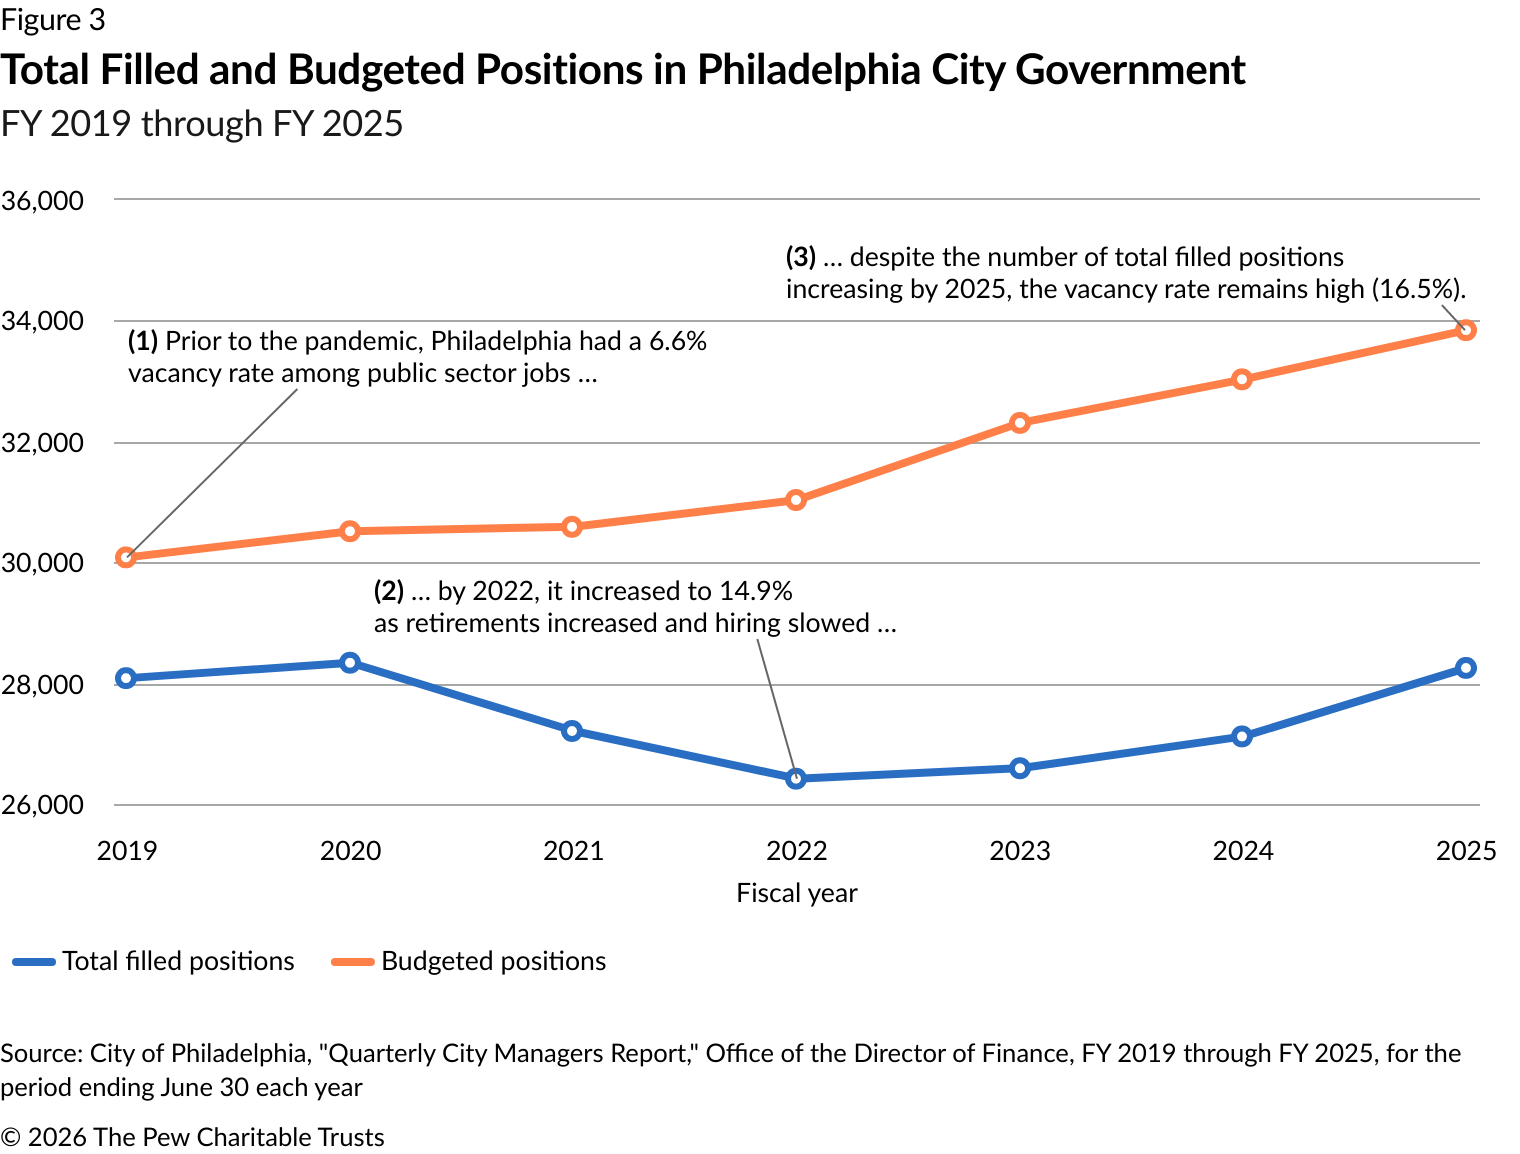
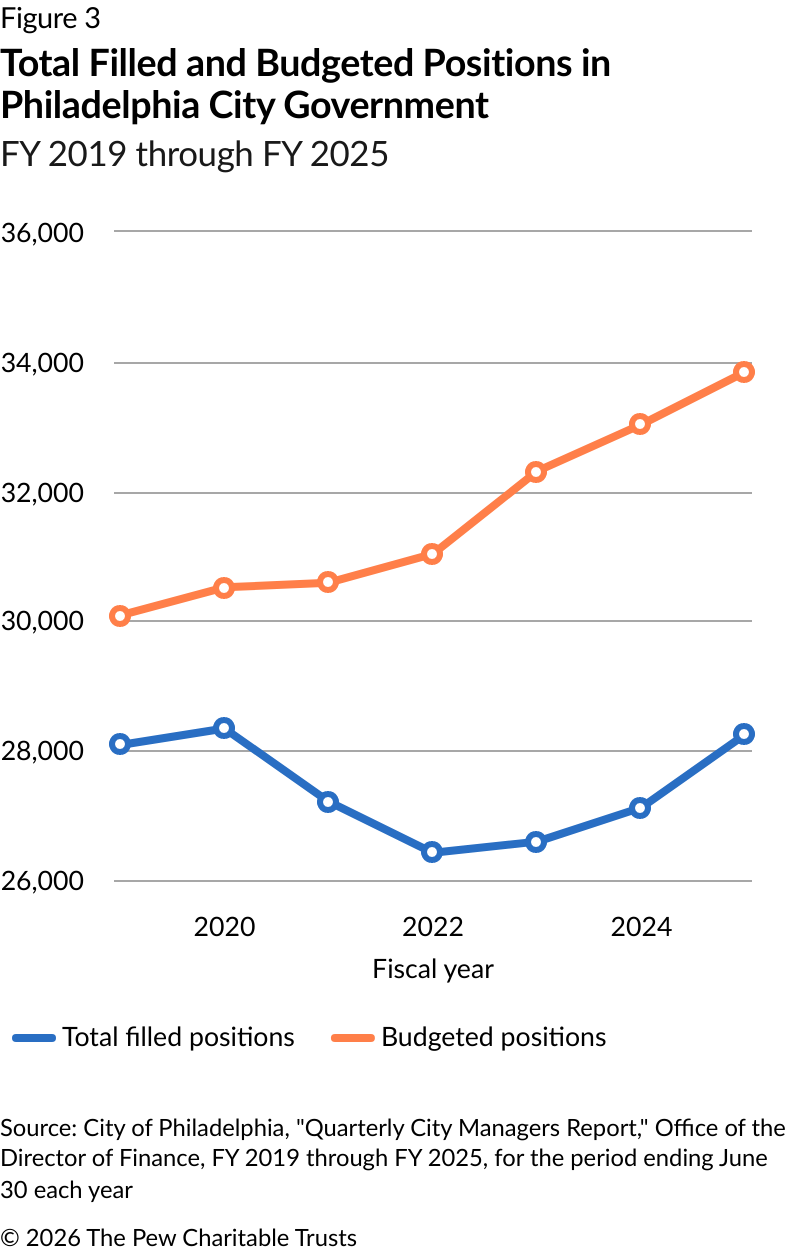
In fiscal 2019, the city had 1,999 vacancies, representing 6.6% of all positions. Vacancies peaked in fiscal 2024, at 17.9%; by the end of fiscal 2025, they dropped slightly, to 16.5%, representing 5,592 unfilled positions. One of the main reasons for the increase in vacancies is the increase in the number of budgeted positions—from 30,083 by the end of fiscal 2019 to 33,845 by the end of fiscal 2025. (See Figure 3.)
To analyze where vacancies are prevalent in the city government, Pew categorized departments as follows:
- Public safety includes the Fire Department, Police Department, and Philadelphia Courts.
- Health and social services departments are the Office of Homeless Services, Department of Public Health, and Department of Human Services.
- Government administration departments are the Department of Planning and Development, Office of Sustainability, and Procurement.
- Executive and legislative departments are the Managing Director’s Office, Office of the Mayor, and the Law Department.
- Utilities are the Philadelphia Water Department and the Water, Sewer, and Storm Water Rate Board.
- City services and economic development include the Streets Department, Philadelphia Parks & Recreation, and the Office of Community Empowerment and Opportunity.
In most of the categories, the number of personnel and budgeted positions increased, with the latter creating the increase in vacancies. Only in the public safety departments did an increase in vacancy coincide with a decrease in the number of filled positions. (See Table 2.)
Table 2
Vacancies by Government Function in Philadelphia
FY 2019 and FY 2025
|
Government functions |
Filled positions # 2019 |
Budgeted positions # 2019 |
Vacancy % 2019 |
Filled positions # 2025 |
Budgeted positions # 2025 |
Vacancy % 2025 |
Change in filled positions |
|
Public safety |
14,991 |
15,478 |
3.1% |
13,248 |
16,176 |
18.1% |
-11.6% |
|
Health and social services |
2,872 |
3,305 |
13.1% |
2,886 |
3,509 |
17.8% |
0.5% |
|
Government administration |
2,387 |
2,620 |
8.9% |
2,473 |
2,940 |
15.9% |
3.6% |
|
Executive and legislative |
1,572 |
1,611 |
2.4% |
2,175 |
2,384 |
8.8% |
38.4% |
|
Utility |
1,892 |
2,189 |
13.6% |
2,120 |
2,558 |
17.1% |
12.1% |
|
City services and economic development |
3,487 |
3,887 |
10.3% |
6,575 |
7,636 |
13.9% |
88.6% |
Notes: To see which individual departments fit into which category, see the appendix. The Department of Commerce, Office of the City Representatives, Department of Aviation, Creative Philadelphia, Office of Children and Families, Mayor’s Office of Education, Division of Housing and Community Development, and Philadelphia Art Commission were not included in this analysis because data from either fiscal 2019 or fiscal 2025 was not included or because departments were restructured, making comparisons difficult. Departments analyzed were based on departments listed under the Quarterly City Managers Report, “Departmental Full-Time Positions Summary: All Funds” table.
Source: City of Philadelphia, Quarterly City Managers Report, Office of the Director of Finance, FY 2019 and FY 2025, for the period ending June 30 each year
Among the major drivers of the increase in vacancies were staffing declines in public safety departments. From fiscal 2019 through fiscal 2025, the total number of filled positions in those departments decreased from 14,991 to 13,248, while the number of budgeted positions increased from 15,478 to 16,176. As a result, vacancies rose from 487 positions to 2,928. These job openings account for 52% of all vacancies in the city.
The Philadelphia Police Department—the city’s biggest department—had 7,402 filled positions and 7,537 budgeted positions in fiscal 2019, a vacancy rate of 1.8% (only 135 vacancies). By fiscal 2025, the number of budgeted positions was 7,883, but the number of filled positions fell to 6,309, increasing the number of vacancies to 1,574—a vacancy rate of 20%. The department alone accounted for 28% of all city government job vacancies in fiscal 2025.
Philadelphia and overtime spending
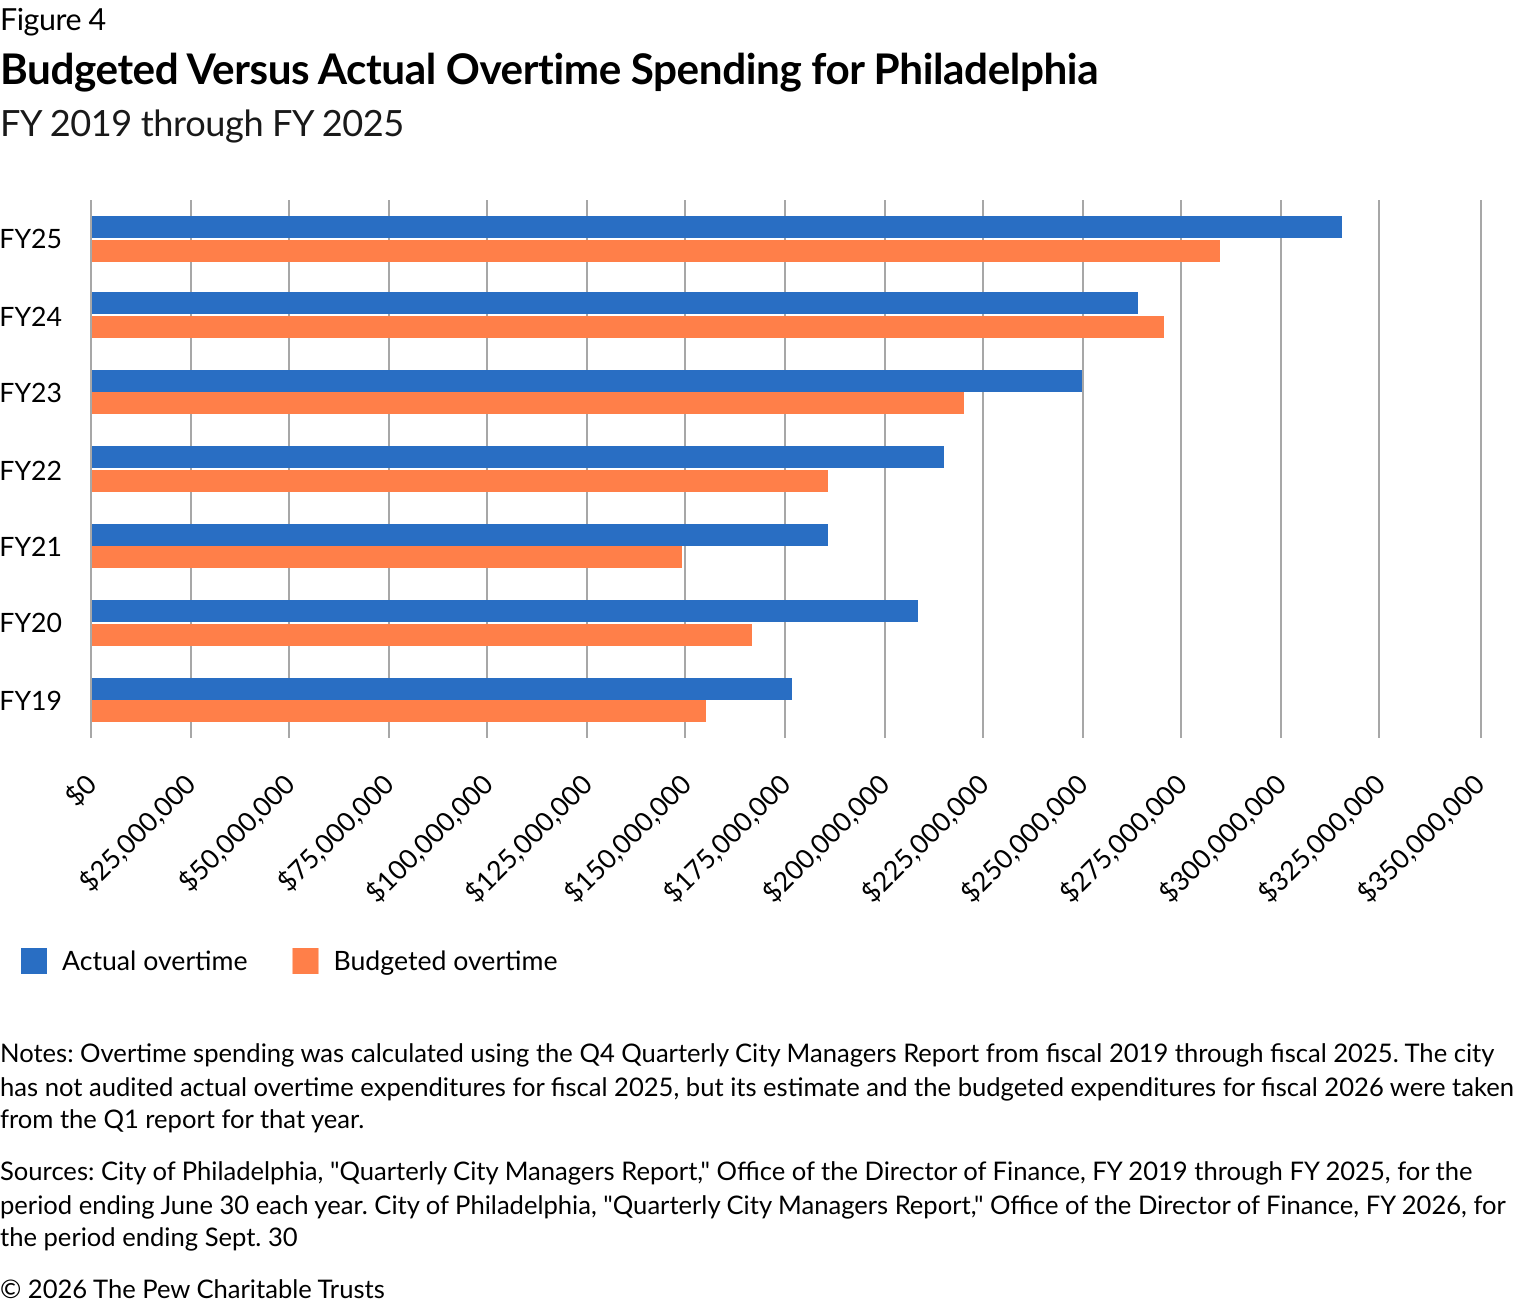
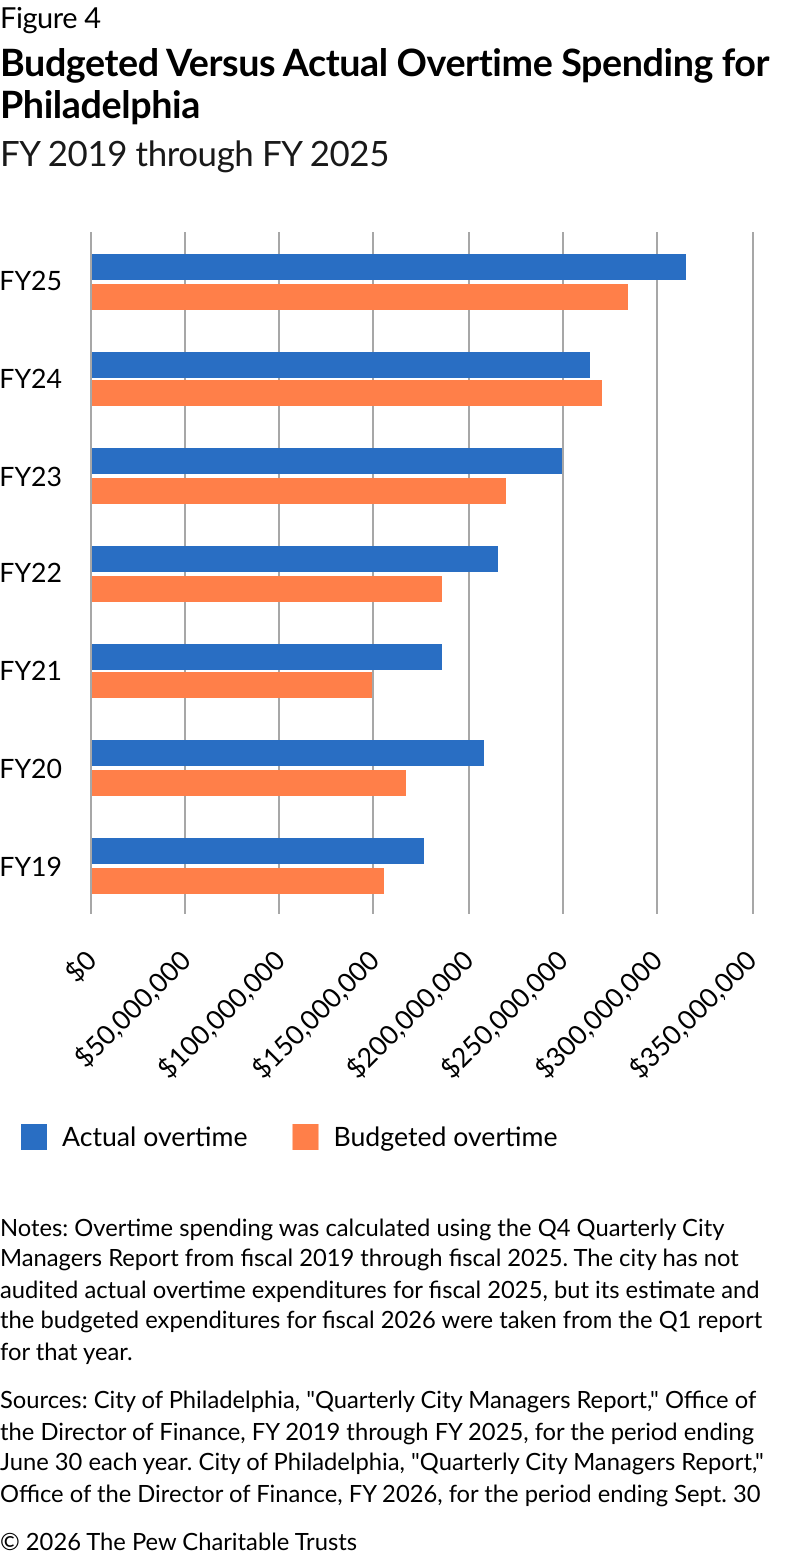
From fiscal 2019 through fiscal 2025, overtime spending in Philadelphia rose by 78%, from $177 million to $315 million. Over the same period, overall personnel spending (of which overtime is a part) rose by just 28%. The city exceeded its overtime budget in every year except fiscal 2024. On average, actual overtime spending exceeded budgeted overtime by $26 million over this period. (See Figure 4.)
A PICA report on overtime and staffing trends from fiscal 2018 to fiscal 2025 shows that spending increases were driven by rising service demands among public safety personnel, an increase in citywide vacancy rates, and an increase in employee salaries, which raised the cost of each hour of overtime. Additionally, PICA found that four departments—Police, Fire, Prisons, and Streets—were responsible for the majority (87.9%) of overtime spending over the period analyzed. The group’s report states that this increase in costs can be absorbed because of the city’s current vacancy level. However, maintaining this level of spending with staffing increases can cause departments to overspend frequently.4
Conclusion

The pandemic was a deeply disruptive period for U.S. cities, resulting in declines in staffing levels and challenges in recruiting new municipal workers. Although Philadelphia—like other U.S. cities—has returned to previous employment levels, vacancies across government functions have also increased because of a rise in the number of budgeted positions that are vacant.
A fully functioning city government enables residents to get the services they rely on and expect the government to deliver. Philadelphia and other cities are poised to strengthen these services not only by hiring new talent but also by sufficiently staffing critical government functions.
Appendix
To analyze which department had the most hires and departures, Pew used the city’s earning data, accessed through OpenDataPhilly. The data was filtered to represent fiscal 2019 through fiscal 2025. Any public identification number that first appeared after 2019 was considered a hire. Any public ID number that stopped appearing in the six-year period following 2019 was considered a departure.
To create the following tables, Pew grouped Philadelphia’s departments into categories based on their primary functions: utility, public safety, health and social services, government administration, executive and legislative, and city services and economic development.
The following tables show how individual departments were categorized.
Population, city government staffing, and city workforce per capita change
|
Cities |
2025 Total population |
City Government 2025 total |
Public workforce per capita 2025 |
2019 Total population |
City Government 2019 total |
Public workforce per capita 2019 |
Change in per capita |
Change in population |
Change in city government |
|
Austin, TX |
1,002,632 |
7,425 |
74 |
979,263 |
6,882 |
70 |
4 |
2.4% |
7.9% |
|
Charlotte, NC |
964,784 |
8,022 |
83 |
885,707 |
8,923 |
101 |
-18 |
8.9% |
-10.1% |
|
Columbus, OH |
938,396 |
9,020 |
96 |
902,073 |
9,148 |
101 |
-5 |
4.0% |
-1.4% |
|
Dallas |
1,329,491 |
14,021 |
105 |
1,343,565 |
12,474 |
93 |
12 |
-1.0% |
12.4% |
|
Fort Worth, TX |
1,028,117 |
7,829 |
76 |
913,656 |
7,203 |
79 |
-3 |
12.5% |
8.7% |
|
Los Angeles |
3,869,089 |
32,337 |
84 |
3,979,537 |
33,059 |
83 |
1 |
-2.8% |
-2.2% |
|
New York |
8,584,629 |
287,422 |
335 |
8,336,817 |
300,442 |
360 |
-25 |
3.0% |
-4.3% |
|
Philadelphia |
1,574,281 |
28,273 |
180 |
1,584,064 |
28,659 |
181 |
-1 |
-0.6% |
-1.3% |
|
Phoenix |
1,665,481 |
10,610 |
64 |
1,680,988 |
9,990 |
59 |
5 |
-0.9% |
6.2% |
|
San Diego |
1,406,106 |
13,096 |
93 |
1,423,852 |
11,598 |
81 |
12 |
-1.2% |
12.9% |
Utility
|
Departments |
Actual positions # 2019 |
Budgeted positions # 2019 |
Vacancy # 2019 |
Vacancy % 2019 |
Actual positions # 2025 |
Budgeted positions # 2025 |
Vacancy # 2025 |
Vacancy % 2025 |
Change in share of vacancy |
Change in filled positions |
|
Philadelphia Water Department |
1,891 |
2,188 |
297 |
13.6% |
2,118 |
2,557 |
439 |
17.2% |
3.6% |
12.0% |
|
Water, Sewer, and Stormwater Rate Board |
1 |
1 |
- |
- |
2 |
1 |
(1) |
-100.0% |
-100.0% |
100.0% |
|
Total |
1,892 |
2,189 |
297 |
13.6% |
2,120 |
2,558 |
438 |
17.1% |
3.6% |
12.1% |
Public safety
|
Departments |
Actual positions # 2019 |
Budgeted positions # 2019 |
Vacancy # 2019 |
Vacancy % 2019 |
Actual positions # 2025 |
Budgeted positions # 2025 |
Vacancy # 2025 |
Vacancy % 2025 |
Change in share of vacancy |
Change in filled positions |
|
Department of Prisons |
2,130 |
2,325 |
195 |
8.4% |
1,549 |
2,186 |
637 |
29.1% |
20.7% |
-27.3% |
|
Office of the Sheriff |
355 |
410 |
55 |
13.4% |
338 |
459 |
121 |
26.4% |
13.0% |
-4.8% |
|
Philadelphia Police Department |
7,402 |
7,537 |
135 |
1.8% |
6,309 |
7,883 |
1,574 |
20.0% |
18.2% |
-14.8% |
|
Office of the Inspector General |
18 |
21 |
3 |
14.3% |
21 |
26 |
5 |
19.2% |
4.9% |
16.7% |
|
Philadelphia Fire Department |
2,737 |
2,851 |
114 |
4.0% |
2,920 |
3,473 |
553 |
15.9% |
11.9% |
6.7% |
|
First Judicial District of Pennsylvania |
2,349 |
2,334 |
(15) |
-0.6% |
2,111 |
2,149 |
38 |
1.8% |
2.4% |
-10.1% |
|
Total |
14,991 |
15,478 |
487 |
3.1% |
13,248 |
16,176 |
2,928 |
18.1% |
15.0% |
-11.6% |
Health and social services
|
Departments |
Actual positions # 2019 |
Budgeted positions # 2019 |
Vacancy # 2019 |
Vacancy % 2019 |
Actual positions # 2025 |
Budgeted positions # 2025 |
Vacancy # 2025 |
Vacancy % 2025 |
Change in share of vacancy |
Change in filled positions |
|
Department of Behavioral Health and Intellectual disAbility Services |
262 |
277 |
15 |
5.4% |
286 |
341 |
55 |
16.1% |
10.7% |
9.2% |
|
Department of Public Health |
901 |
1,050 |
149 |
14.2% |
924 |
1,082 |
158 |
14.6% |
0.4% |
2.6% |
|
Department of Human Services |
1,535 |
1,790 |
255 |
14.2% |
1,497 |
1,898 |
401 |
21.1% |
6.9% |
-2.5% |
|
Office of Homeless Services |
174 |
188 |
14 |
7.4% |
179 |
188 |
9 |
4.8% |
-2.6% |
2.9% |
|
Total |
2,872 |
3,305 |
433 |
13.1% |
2,886 |
3,509 |
623 |
17.8% |
4.7% |
0.5% |
Government administration
|
Departments |
Actual positions # 2019 |
Budgeted positions # 2019 |
Vacancy # 2019 |
Vacancy % 2019 |
Actual positions # 2025 |
Budgeted positions # 2025 |
Vacancy # 2025 |
Vacancy % 2025 |
Change in share of vacancy |
Change in filled positions |
|
Department of Fleet Services |
364 |
389 |
25 |
6.4% |
340 |
403 |
63 |
15.6% |
9.2% |
-6.6% |
|
Department of Public Property |
135 |
150 |
15 |
10.0% |
111 |
158 |
47 |
29.7% |
19.7% |
-17.8% |
|
Office of Property Assessment |
196 |
225 |
29 |
12.9% |
184 |
226 |
42 |
18.6% |
5.7% |
-6.1% |
|
Department of Planning and Development |
109 |
114 |
5 |
4.4% |
137 |
168 |
31 |
18.5% |
14.1% |
25.7% |
|
Office of Sustainability |
11 |
9 |
(2) |
-22.2% |
27 |
29 |
2 |
6.9% |
29.1% |
145.5% |
|
Board of Building Standards |
1 |
1 |
- |
0.0% |
1 |
1 |
- |
0.0% |
0.0% |
0.0% |
|
Department of Labor |
22 |
23 |
1 |
4.3% |
35 |
57 |
22 |
38.6% |
34.3% |
59.1% |
|
Procurement Department |
43 |
52 |
9 |
17.3% |
37 |
55 |
18 |
32.7% |
15.4% |
-14.0% |
|
Board of Pensions and Retirement |
56 |
73 |
17 |
23.3% |
60 |
73 |
13 |
17.8% |
-5.5% |
7.1% |
|
Office of Innovation and Technology |
369 |
413 |
44 |
10.7% |
488 |
580 |
92 |
15.9% |
5.2% |
32.2% |
|
Department of Revenue |
611 |
669 |
58 |
8.7% |
534 |
621 |
87 |
14.0% |
5.3% |
-12.6% |
|
Office of the Director of Finance |
116 |
123 |
7 |
5.7% |
129 |
147 |
18 |
12.2% |
6.5% |
11.2% |
|
Office of the City Controller |
125 |
134 |
9 |
6.7% |
123 |
138 |
15 |
10.9% |
4.2% |
-1.6% |
|
Register of Wills |
70 |
70 |
- |
0.0% |
76 |
85 |
9 |
10.6% |
10.6% |
8.6% |
|
Board of Revision of Taxes |
11 |
15 |
4 |
26.7% |
16 |
17 |
1 |
5.9% |
-20.8% |
45.5% |
|
Department of Records |
55 |
59 |
4 |
6.8% |
57 |
60 |
3 |
5.0% |
-1.8% |
3.6% |
|
City Treasurer's Office |
16 |
16 |
- |
0.0% |
22 |
23 |
1 |
4.3% |
4.3% |
37.5% |
|
Office of Human Resources |
77 |
85 |
8 |
9.4% |
96 |
99 |
3 |
3.0% |
-6.4% |
24.7% |
|
Total |
2,387 |
2,620 |
233 |
8.9% |
2,473 |
2,940 |
467 |
15.9% |
7.0% |
3.6% |
Executive and legislative
|
Departments |
Actual positions # 2019 |
Budgeted positions # 2019 |
Vacancy # 2019 |
Vacancy % 2019 |
Actual positions # 2025 |
Budgeted positions # 2025 |
Vacancy # 2025 |
Vacancy % 2025 |
Change in share of vacancy |
Change in filled positions |
|
Office of the Mayor |
60 |
56 |
(4) |
-7.1% |
81 |
113 |
32 |
28.3% |
35.4% |
35.0% |
|
Office of the Chief Administrative Officer |
56 |
66 |
10 |
15.2% |
81 |
100 |
19 |
19.0% |
3.8% |
44.6% |
|
Office of the City Commissioners |
94 |
105 |
11 |
10.5% |
173 |
200 |
27 |
13.5% |
3.0% |
84.0% |
|
Managing Director's Office |
375 |
369 |
(6) |
-1.6% |
634 |
716 |
82 |
11.5% |
13.1% |
69.1% |
|
Philadelphia Commission on Human Relations |
32 |
34 |
2 |
5.9% |
32 |
35 |
3 |
8.6% |
2.7% |
0.0% |
|
Board of Ethics |
10 |
12 |
2 |
16.7% |
13 |
14 |
1 |
7.1% |
-9.6% |
30.0% |
|
Philadelphia District Attorney's Office |
566 |
589 |
23 |
3.9% |
670 |
712 |
42 |
5.9% |
2.0% |
18.4% |
|
Philadelphia City Council |
197 |
195 |
(2) |
-1.0% |
212 |
215 |
3 |
1.4% |
2.4% |
7.6% |
|
Law Department |
180 |
183 |
3 |
1.6% |
277 |
277 |
- |
0.0% |
-1.6% |
53.9% |
|
Civil Service Commission |
2 |
2 |
- |
0.0% |
2 |
2 |
- |
0.0% |
0.0% |
0.0% |
|
Total |
1,572 |
1,611 |
39 |
2.4% |
2,175 |
2,384 |
209 |
8.8% |
6.3% |
38.4% |
City services and economic development
|
Departments |
Actual positions # 2019 |
Budgeted positions # 2019 |
Vacancy # 2019 |
Vacancy % 2019 |
Actual positions # 2025 |
Budgeted positions # 2025 |
Vacancy # 2025 |
Vacancy % 2025 |
Change in share of vacancy |
Change in filled positions |
|
Department of Licenses and Inspections |
380 |
438 |
58 |
13.2% |
377 |
449 |
72 |
16.0% |
2.8% |
-0.8% |
|
Board of License and Inspection Review |
2 |
2 |
- |
0.0% |
2 |
2 |
- |
0.0% |
0.0% |
0.0% |
|
Department of Streets |
1,736 |
1,912 |
176 |
9.2% |
2,326 |
2,705 |
379 |
14.0% |
4.8% |
34.0% |
|
Philadelphia Parks & Recreation |
674 |
779 |
105 |
13.5% |
732 |
960 |
228 |
23.8% |
10.3% |
8.6% |
|
Office of Community Empowerment and Opportunity |
23 |
36 |
13 |
36.1% |
86 |
109 |
23 |
21.1% |
-15.0% |
273.9% |
|
Free Library of Philadelphia |
661 |
708 |
47 |
6.6% |
868 |
1,017 |
149 |
14.7% |
8.0% |
31.3% |
|
Mural Arts Philadelphia |
11 |
12 |
1 |
8.3% |
9 |
10 |
1 |
10.0% |
1.7% |
-18.2% |
|
Total |
3,487 |
3,887 |
400 |
10.3% |
4,400 |
5,252 |
852 |
16.2% |
5.9% |
26.2% |
About this report
This brief was researched and written by Jun Ho Phue and Karim Sharif of Pew’s Philadelphia research and policy initiative. It was edited by Larry Eichel, a senior adviser; Katie Martin, a project director; and Jennifer Clendening, a manager with the initiative, along with Erika Compart and Tricia Olszewski.
Acknowledgments
This brief benefited from the insights and expertise of external reviewer Marisa Waxman, executive director of the Pennsylvania Intergovernmental Cooperation Authority. The piece does not necessarily reflect the opinions of this reviewer or her organization.
Endnotes
- Jacob Gottlieb and Julia Bauer, “The Municipal Workforce Through the Pandemic,” National League of Cities, 2022, https://www.nlc.org/wp-content/uploads/2022/07/Municipal-Workforce-Through-the-Pandemic-Brief.pdf.
- Anna Orso, “Philly Is Slowly Rebuilding Its City Workforce After the Pandemic Exodus—but Key Jobs Remain Hard to Staff,” The Philadelphia Inquirer, March 31, 2026, https://www.inquirer.com/politics/philadelphia/philadelphia-jobs-hiring-vacancies-understaffing-20260331.html.
- MissionSquare Research Institute, “2025 State and Local Government Workforce Survey Results,” 2025, https://research.missionsq.org/content/media/document/2025/5/2025_State_Local_Workforce_Report.pdf.
- Pennsylvania Intergovernmental Cooperation Authority, “General Fund Overtime and Staffing FY18-25,” 2026, https://picapa.org/wp-content/uploads/2026/01/Overtime-and-Staffing-Report-FY18-25-1.pdf.
People


