States Are Falling Behind on Roadway Maintenance
Key assessment tool projects that funding for pavement and bridges will not keep pace with needs

Overview
States are underinvesting in roads and bridges. Previous research from The Pew Charitable Trusts has found that state roadways face a combined maintenance and repair shortfall of $86.3 billion over the next 10 years.1 And this lack of funding has serious implications: worsening infrastructure conditions, increasing vulnerability of roads and bridges to extreme weather, and rising safety hazards for drivers.2 To address this problem and avoid similar issues in the future, budget and policy leaders need robust data on the health of their states’ roadway assets and on the long-term investments needed to preserve their pavement and bridges, prevent costly backlogs, and promote sustainable spending.
One tool for providing that data is the Asset Sustainability Index (ASI), a long-term measure of “funding adequacy”—whether planned investments will meet anticipated needs—expressed as the ratio of the amount budgeted for preservation, preventive maintenance, rehabilitation, and replacement of roads or bridges to the amount needed to keep those assets at a specified condition level.3 The higher the ASI, the larger the share of the necessary funding a state has available or planned.

This brief builds on Pew’s 2025 analysis of state road and bridge funding and condition gaps, “States Fall Short of Funding Needed to Keep Roads and Bridges in Good Repair,” to calculate 10-year ASIs for the 25 states that projected annual road and bridge funding in their federally required Transportation Asset Management Plans (TAMPs).4 This ASI analysis enables cross-state comparisons of funding adequacy regardless of roadway network or budget size, as well as tracking of trends, providing insights into states’ progress toward adequate funding and risk of roadway deterioration. Because states used different starting years in their TAMPs, this brief refers to projections as Year 1 through Year 10. The key findings are:
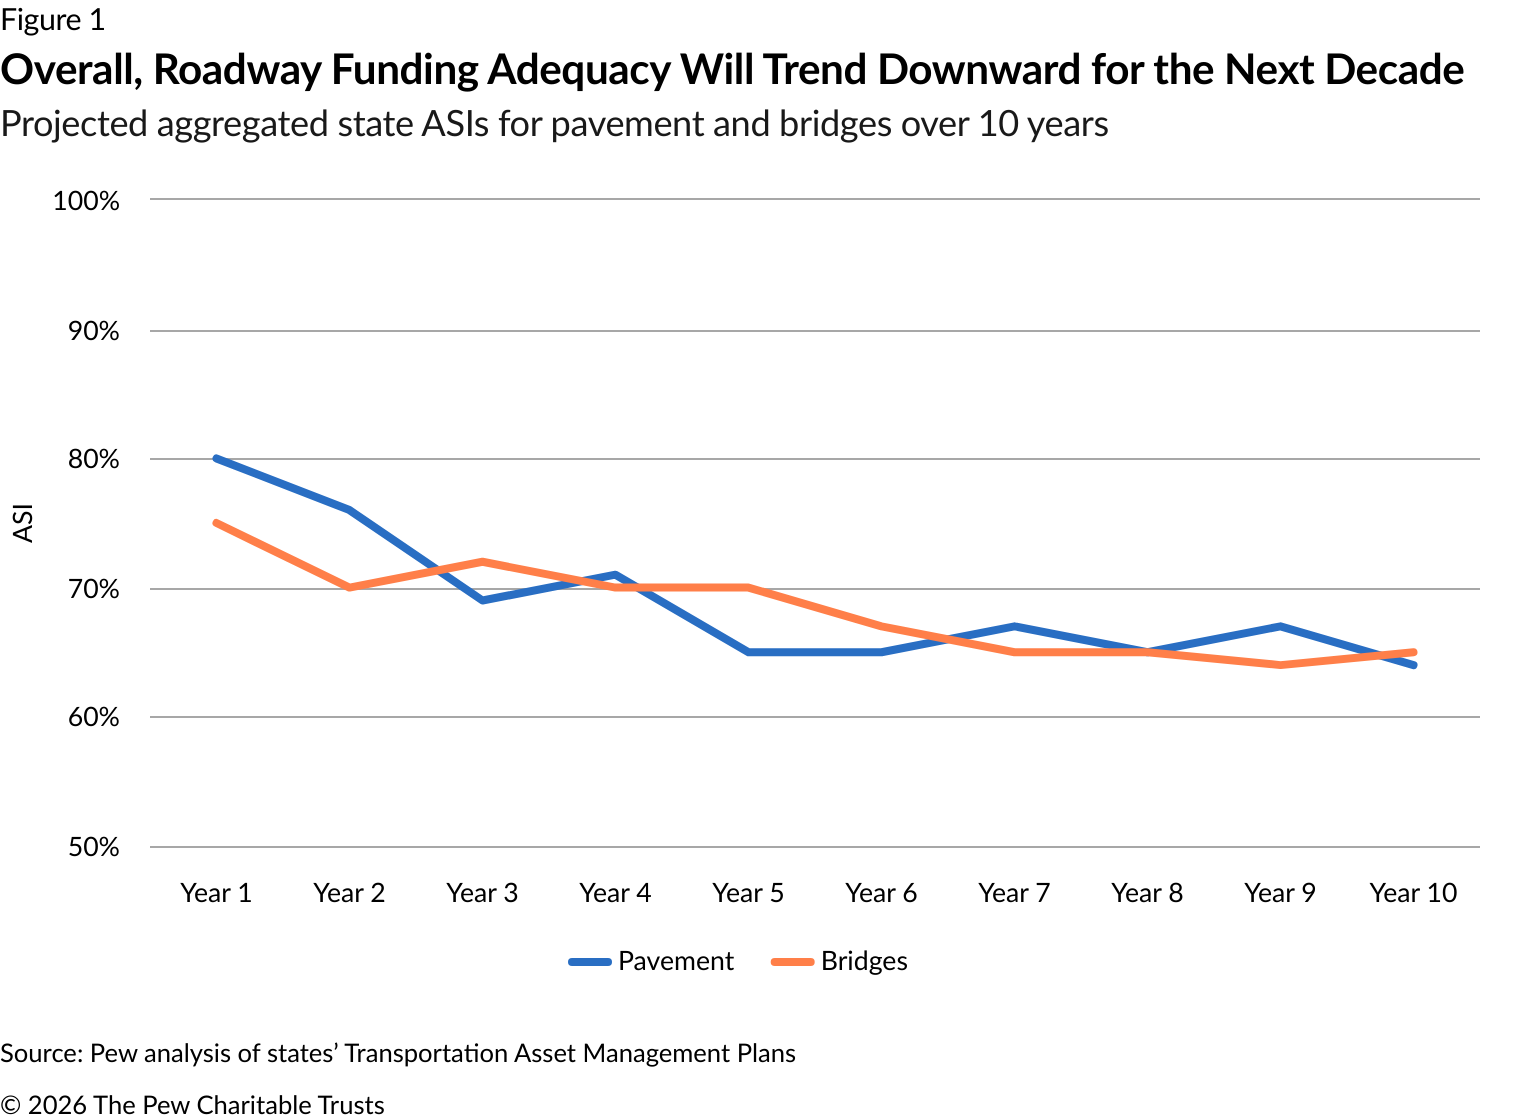
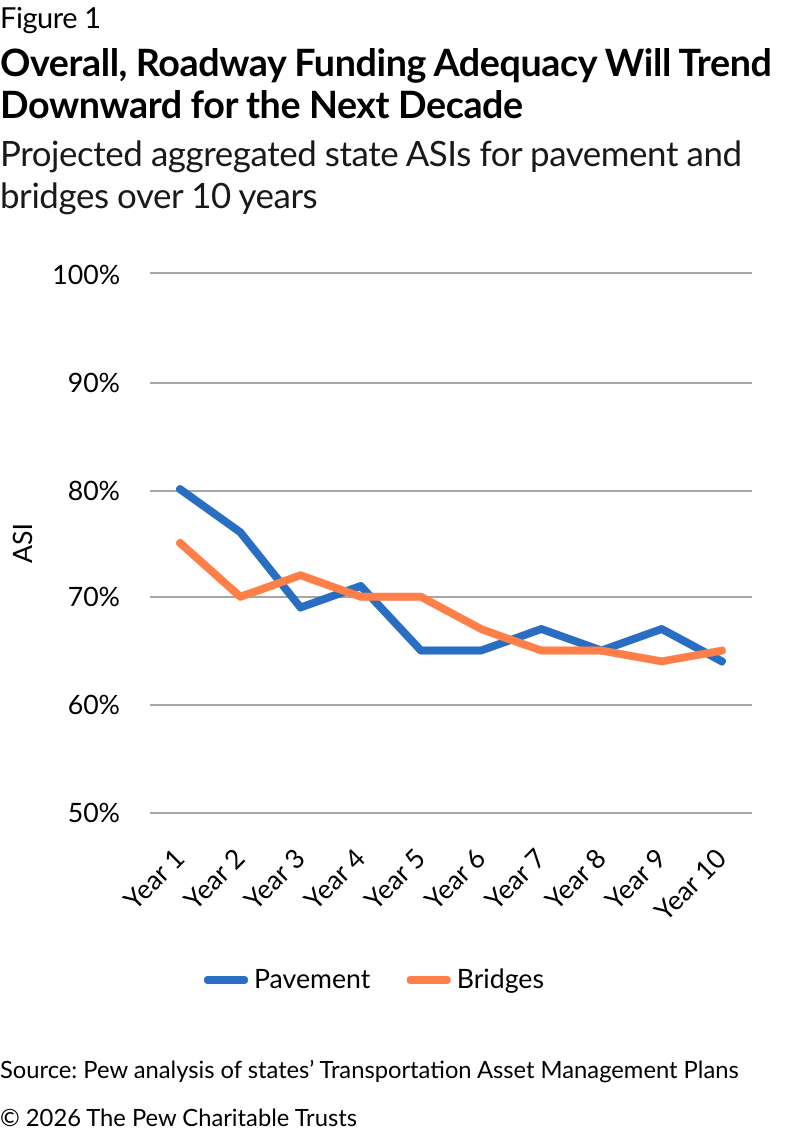
- Aggregate state investment in existing roadway assets, given current policies, will not keep pace with needs. The combined ASI for pavement and bridges will drop from 78% in Year 1 to 65% by Year 10. Aggregate pavement ASI will drop from 80% in Year 1 to 64% in Year 10, with the annual funding shortfall rising from $2.1 billion to $3.7 billion. And aggregate bridge ASI will fall from 75% to 65%, with the shortfall increasing from $2.3 billion to $3.4 billion.
- Most states’ roadways will remain underfunded over the 10-year period. States with inadequate funding in the early years typically fall further behind in the last three years. By the end of the 10 years, 16 states are short of full funding, only nine are on track to meet or exceeded estimated maintenance needs, and just two—Kansas and West Virginia—show significant improvement, going from not meeting needs to exceeding them. Connecticut, Michigan, New York, and Oregon are among the worst performers, with ASIs that either start under 50% and stay that way or start above 50% but fall below that threshold by decade’s end.
- Far more states’ projections trend downward than upward over 10 years. Only three states—Kansas, New Mexico, and West Virginia—show consistent ASI growth, while nine states show declines.
What Is the Asset Sustainability Index?
ASI is a planning metric developed by the Federal Highway Administration (FHWA) in 2012 that expresses the long-term financial sustainability of infrastructure as the ratio of planned maintenance and preservation investments to the funding levels required to meet condition targets. It supports planning, programming, and budgeting by tracking whether investment strategies align with long-term needs. Several states have used this metric in their own reporting.
An ASI of 100% indicates that expected expenditures align with needs. Values above 100% suggest spending in excess of current needs—potentially to address deferred maintenance—while values below 100% reflect an investment shortfall. For instance, an ASI of 50% means that a state has invested or plans to invest only half of the funding needed to maintain assets at target condition levels, signaling a significant gap that could lead to worsening roadway conditions over time.
State departments of transportation are not required to use or report ASIs, but ASI calculations are made possible by various requirements in the TAMP framework. Specifically, TAMPs must include cost estimates, by fiscal year and work type, for future work needed to implement states’ investment strategies, as well as the expected available funding to support the work.5 These projections are typically only for National Highway System (NHS) assets, but some states also include non-NHS roadways. Although some states report only 10-year averages for these required estimates, which are not sufficient for calculating an ASI, others include year-by-year funding breakdowns, which provide the data necessary to derive sustainability ratios and assess whether planned budgets align with funding needs.6
Ultimately, 25 states’ TAMPs included sufficient projections of 10-year budgets and funding needs to calculate ASIs for roads and bridges.
Trends in roadway funding adequacy
National trends
Nationally, in Year 1, the aggregate ASI shows that states will meet 78% of the funding needed to maintain roadway conditions at target levels—meaning that, collectively, states face a shortfall from the start. And that share is projected to decline further to 67% by Year 5 and to 65% by Year 10, with consistent downward trends in the funding levels for pavement and bridges. Pavement assets will see a steeper decline in ASI, from 80% in Year 1 to 64% in Year 10, and a substantial rise in the annual shortfall, from $2.1 billion to $3.7 billion. The ASI for bridges will also drop, though less sharply, decreasing from 75% to 65% and increasing the shortfall from $2.3 billion to $3.4 billion. (See Figure 1.)
State trends
Although national data reveals a broad downward trend, state-level projections vary significantly. Pew classified states into three ASI trend groups by comparing each state’s average ASI from the first three years and the last three years of the 10-year projection. The categories are:
- Increasing: ASI ratio increased by more than 5%, indicating sustained investment progress over the decade.
- Flat: ASI ratio remained within plus or minus 5% in the first and last three-year periods, indicating generally flat investment levels.
- Decreasing: ASI ratio declined by more than 5%, suggesting widening investment gaps.
This approach smooths out year-to-year fluctuations and highlights whether a state is holding its ASI steady, moving toward more adequate investment, or falling further behind. A flat ASI trajectory may be sufficient as long as the state’s roadway investments are sufficient from the start of the projection, but if funding is inadequate in Year 1, then the flat ASI indicates that underfunding is persistent over the decade.
The analysis found that far more states are trending downward than upward in their overall roadway ASIs over the 10-year period. Only three states—Kansas, New Mexico, and West Virginia—show improvement in their overall ASIs. In contrast, nine states—Colorado, Kentucky, Massachusetts, Michigan, New Jersey, New York, Oregon, Rhode Island, and Vermont—have decreasing ASIs, which point to growing investment shortfalls that, if unaddressed, could lead to worsening infrastructure, and a more expensive backlog over time. The remaining 13 states’ ASIs are flat. (See Figure 2.)
Across asset types, states show even greater variation. New Mexico is the only state to project improvement for both pavement and bridges. Kansas improves for pavement, while West Virginia improves only for bridges. Massachusetts, Michigan, Oregon, and Vermont decrease across both asset types, and New York and Rhode Island decline for only bridges. Colorado and New Jersey decrease slightly for pavement. Some notable details of these changes include:
- West Virginia’s projected improvement for bridges is the result of an influx of funding through the state’s Roads to Prosperity program, launched in 2017 and funded through bond issuances, which enabled the state to increase its investment in roads and bridges by 67% from 2018 to 2023 and repair more than 3,400 bridges.7
- Rhode Island will face a bridge funding gap totaling $1.1 billion over the next 10 years, largely from estimated underinvestment of $609.6 million in reconstruction. The state’s TAMP calls for more funding for major bridge reconstruction.8
- Michigan projects funding declines for pavement and bridges despite efforts to find new revenue streams to increase transportation funding, such as diverting funds from income taxes and raising fuel taxes.9 The state’s combined ASI drops from just over 50% in years 1-3 to 40% in years 8-10.
These findings underscore that although national data tells one story, state-level data reveals a more complex picture of ASI trends, one marked by gains, stability, and backsliding across overall roadway infrastructure as well as specific asset classes.
Figure 2
Source: Pew analysis of funding data from states’ Transportation Asset Management Plans
Figure 3
Pew analysis of funding data from states’ Transportation Asset Management Plans
A deeper dive into funding adequacy
Examining trends shows whether states are meeting more or less of their infrastructure maintenance and repair needs over time. But even states that improve can end up falling short of the funding required to preserve roadway assets. To better understand the overall adequacy of expected roadway funding to meet long-term transportation goals and prevent the growth of deferred maintenance, Pew averaged ASIs across three multiyear segments within the 10-year study period—years 1-3, years 4-7, and years 8-10. This analysis reveals the adequacy of states’ investment strategies across those segments and highlights significant changes.

Pew found that most states are unable to provide the funding needed to sustain their infrastructure, as indicated by having ASI values below 100% across all three segments. (See Table 1.) Moreover, states that have inadequate funding in the early years typically fall further behind in the last three years. In total, 17 states consistently have ASIs that demonstrate inadequate funding. Of those, five—Connecticut, Michigan, New Mexico, New York, and Oregon—have ASIs that drop or remain below 50% in the final three years, indicating that expected spending would need to double to address the underfunding.
Among those five states, New Mexico stands out as a case study in how an upward trend alone is not enough to gauge funding adequacy. Based on the trend analysis, the state is one of only three with increasing ASIs. But New Mexico’s growth amounts to just 9 percentage points over a decade, raising the ASI from 38% to only 47%, less than half of what is needed to meet roadway needs. By the final segment, the state will face an average annual roadway funding shortfall of $299 million, indicating that although New Mexico’s funding is moving in the right direction, its efforts fall far short of what is required to sustain its infrastructure over the long term.
Just seven states—Delaware, Florida, Idaho, Indiana, Mississippi, Montana, and Nevada—show adequate funding across all three periods.
Table 1
Most States Will Not Meet Roadway Funding Needs During Any Portion of the 10-Year Period
Average ASI for years 1-3, 4-7, and 8-10 for pavement and bridges combined
| State | Years 1-3 | Years 4-7 | Years 8-10 |
| Colorado | 100% | 65% | 66% |
| Connecticut | 38% | 38% | 38% |
| Delaware | 100% | 100% | 100% |
| Florida | 100% | 100% | 100% |
| Idaho | 100% | 100% | 100% |
| Illinois | 92% | 91% | 89% |
| Indiana | 100% | 100% | 100% |
| Iowa | 85% | 85% | 85% |
| Kansas | 94% | 100% | 100% |
| Kentucky | 84% | 72% | 60% |
| Massachusetts | 99% | 84% | 62% |
| Michigan | 56% | 33% | 40% |
| Mississippi | 100% | 100% | 100% |
| Montana | 100% | 100% | 100% |
| Nevada | 100% | 100% | 100% |
| New Hampshire | 93% | 92% | 94% |
| New Jersey | 101% | 103% | 93% |
| New Mexico | 38% | 45% | 47% |
| New York | 40% | 36% | 34% |
| Oklahoma | 94% | 93% | 94% |
| Oregon | 46% | 38% | 33% |
| Rhode Island | 75% | 72% | 58% |
| Vermont | 90% | 91% | 83% |
| Washington | 70% | 67% | 68% |
| West Virginia | 93% | 104% | 106% |
Source: Pew analysis of funding data from states’ Transportation Asset Management Plans
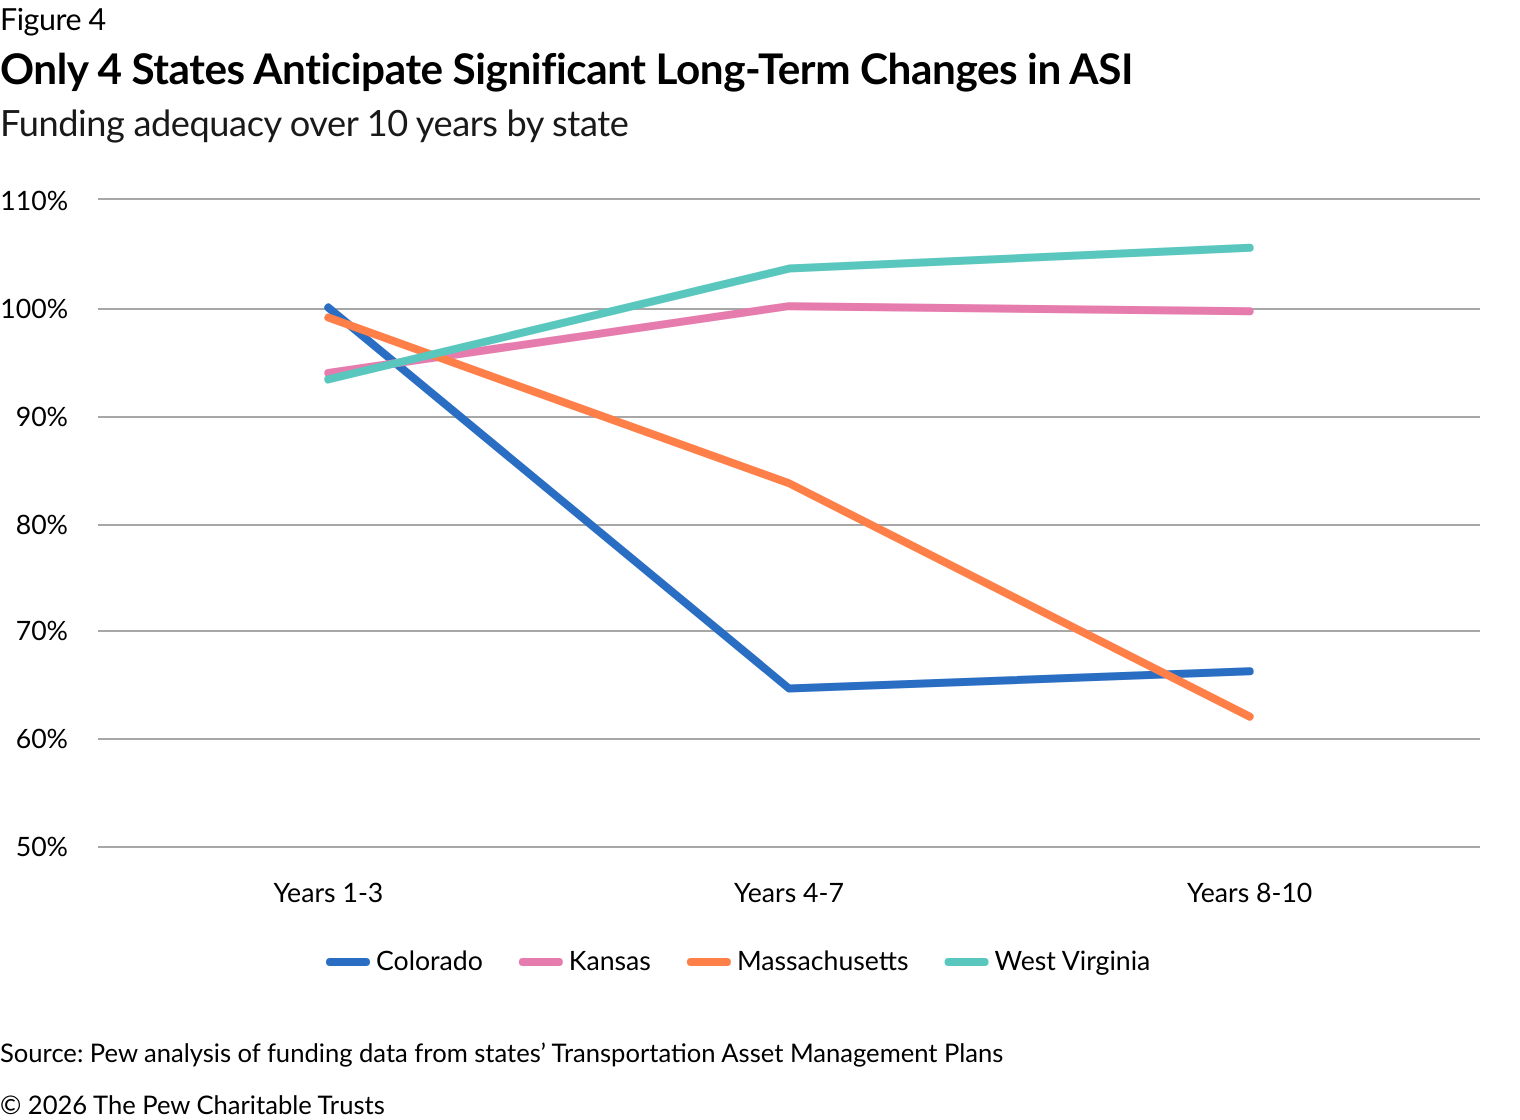
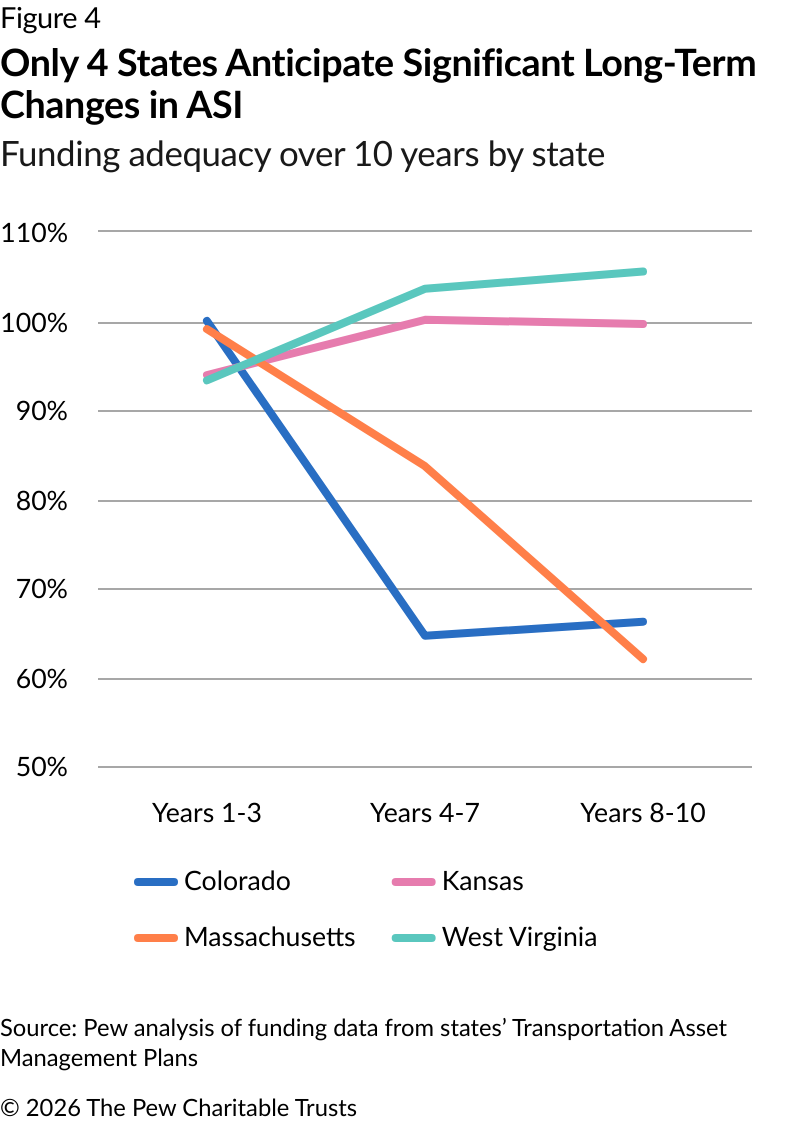
Of the 25 states examined, only four—Colorado, Kansas, Massachusetts, and West Virginia—have ASIs that change significantly across the three segments, shifting either from underfunded to fully funded or from fully funded to notably underfunded. (See Figure 4.)
- West Virginia improves from not meeting roadway needs (93% funded) to exceeding them (104% funded) in the final three years, primarily driven by a rise in the state’s bridge ASI, which increases from 65% in years 1-3 to 89% by years 8-10.
- Kansas begins the period underfunded (94%) but reaches full funding in the middle years and then maintains that level, with most of the improvement coming in the state’s pavement ASI, which rises from 77% in years 1-3 to 100% by years 8-10.
- Massachusetts will face one of the nation’s steepest drops—37 percentage points—falling from near fully funded in years 1-3 to just 62% by years 8-10 mainly because of a declining bridge ASI.
- Colorado shows a 34-point decline, dropping from fully funded to just 66.2%, driven by its pavement ASI, which drops to 53% by years 8-10.
Conclusion
Using ASI can help states track how well they are aligning their roadway maintenance and repair budgets with long-term investment needs. Despite only half of states providing sufficient data, this analysis projects a downward trend in aggregate ASI over 10 years, and although outcomes vary, most states face long-term funding gaps, with only a few states poised to make sustained progress.
Appendix: Potential limitations
The ASI is a valuable long-term financial planning tool that can reveal future funding gaps and potential risks. However, it relies on two key assumptions: that state projections are accurate, and that actual spending will follow those plans. But in practice, long-term spending can be difficult to predict and may deviate from projections—because of federal funding uncertainty, policy changes, or timing—which weakens the connection between ASI and real-world outcomes. Investment need forecasts may also be inaccurate because of outdated data or poor assumptions that overlook risk factors such as inflation in construction costs and extreme weather.
If projections are accurate, however, a 100% ASI should, in theory, allow states to sustain their infrastructure in the targeted condition. To better evaluate the long-term effectiveness of infrastructure investment, states and researchers should employ additional metrics that assess not just financial sustainability but also tangible improvements in asset conditions over time.
External reviewers
This brief benefited from the insights and expertise of outside reviewers Rocky Moretti, director of policy and research, and Carolyn Bonifas Kelly, director of communications and research, both from TRIP. Although they have reviewed the brief, neither they nor their organization necessarily endorse its findings or conclusions.
Acknowledgments
This brief was written by Pew staff members Emma Wei and Elijah Gullett. The authors thank their colleagues who made this work possible, including Jennifer V. Doctors, David Draine, Carol Hutchinson, Sarah Jones, Claire Lee, Betsy Towner Levine, Jasmine Ng, Aleena Oberthur, Edwin Rodriguez, and Fatima Yousofi for communications, editorial, review, and research support.
Endnotes
- The Pew Charitable Trusts, “States Fall Short of Funding Needed to Keep Roads and Bridges in Good Repair,” 2025, https://www.pew.org/en/research-and-analysis/reports/2025/07/states-fall-short-of-funding-needed-to-keep-roads-and--bridges-in-good-repair.
- The Pew Charitable Trusts, “States Fall Short of Funding.” “States Adapt Transportation Funding Strategies to Meet Resource Challenges,” The Pew Charitable Trusts, June 18, 2025, https://www.pew.org/en/research-and-analysis/articles/2025/06/18/states-adapt-transportation-funding-strategies-to-meet-resource-challenges.
- “Asset Sustainability Index: A Proposed Measure for Long-Term Performance,” Federal Highway Administration, 2012, https://www.planning.dot.gov/documents/ASI_report/asi-01.htm.
- The Pew Charitable Trusts, “States Fall Short of Funding.”
- Federal Highway Administration, Asset Management Plans, 23 CFR Part 515 (2016), https://www.law.cornell.edu/cfr/text/23/part-515.
- Federal Highway Administration, Asset Management Plans.
- TRIP, “Keeping West Virginia Moving Forward: Progress & Challenges in Achieving a 21st Century Transportation System,” 2025, https://tripnet.org/wp-content/uploads/2025/04/TRIP_Keeping_West_Virginia_Moving_Forward_April_2025.pdf. West Virginia Department of Transportation, “Transportation Asset Management Plan,” 2022, https://www.tam-portal.com/wp-content/uploads/sites/12/2024/05/WV_2022-Final-TAMP.pdf.
- Rhode Island Department of Transportation, “Transportation Asset Management Plan,” 2022, https://www.tam-portal.com/wp-content/uploads/sites/12/2023/01/RIDOT-TAMP-2022.pdf.
- Michigan Department of Transportation, “Transportation Asset Management Plan,” 2022, https://www.tam-portal.com/wp-content/uploads/sites/12/2023/07/TAMP-Jul-2022.pdf.
People


